A note on the acoustic environment in a usually quiet residential area after the 'state of emergency' declaration due to COVID-19 pandemic in ...
←
→
Page content transcription
If your browser does not render page correctly, please read the page content below
Noise Mapp. 2020; 7:192–198

Research Article

Kimihiro Sakagami*

A note on the acoustic environment in a usually
quiet residential area after the ‘state of
emergency’ declaration due to COVID-19 pandemic
in Japan was lifted: supplementary survey results
in post-emergency situations
https://doi.org/10.1515/noise-2020-0016                               ronment is now an emerging topic of paramount impor-
Received Aug 21, 2020; accepted Sep 03, 2020                          tance [1]. This includes its impact on the acoustic environ-
                                                                      ment; for example, lockdowns due to the COVID-19 pan-
Abstract: In a preceding report (UCL Open: Environment,
                                                                      demic have been reported in a number of cases as result-
2020;1;6), an example of results on changes in the acoustic
                                                                      ing in a significant reduction of noise in large cities and
environment from a local-scale survey in a quiet residen-
                                                                      mega-infrastructures such as airports [2–5]. A method of
tial area during and after the ‘state of emergency’ due to
                                                                      evaluation for noise levels and a taxonomy of reduction
COVID-19 pandemic in Japan is presented: the noise level
                                                                      in such cases has also been proposed [6]. There have also
was 1–2 dBA lower during the state of emergency, which is
                                                                      been some local-scale studies on the impact of lockdown
smaller than reported from large cities. This note presents
                                                                      schemes, the results of which are somewhat different from
the results of a follow-up survey in the same area to pro-
                                                                      those focused on busy areas and mega-infrastructures [7,
vide some more examples to gain an insight into the acous-
                                                                      8]. In many countries, lockdown schemes have been lifted,
tic environment in this area. In this note, the measurement
                                                                      and the people’s daily lives seem to be getting back to nor-
results of noise levels in June 2020, a few weeks after the
                                                                      mal. However, there are still many differences, e.g., social
cancellation of the state of emergency, are mainly reported.
                                                                      distancing and so-called ‘new style’ behaviours. Discus-
As the results are almost the same as those from during the
                                                                      sion on the impact of lockdowns on the urban acoustic en-
state of emergency, we can infer that either the noise level
                                                                      vironment is one thing, but now it is necessary to discuss
was reduced in June to a level that was almost the same as
                                                                      what happened after the lockdown schemes were lifted.
that during the state of emergency, or the noise level after
                                                                      This note is intended to be a follow-up report to the au-
its cancellation in May was possibly higher than usual. In
                                                                      thor’s previous work of a local-scale survey on the effect of
either case, the change in noise level was small, and it was
                                                                      the ‘state of emergency’ declaration from 7 April to 25 May
difficult to conclude which case was true.
                                                                      2020 [8]. A similar small-scale survey was made in June
Keywords: acoustic environment; COVID-19 pandemic;                    (almost a few weeks after cancellation of the state of emer-
state of emergency; noise level; local-scale survey; quiet            gency), and the results are compared herein with those
residential area                                                      found during the state of emergency and immediately after
                                                                      its cancellation in May 2020, to consider how the acoustic
                                                                      environment changed during this period.
                                                                           In contrast to the drastic reduction of noise levels in
1 Introduction
                                                                      busy and usually noisy areas reported from many coun-
                                                                      tries, usually quiet residential areas have been discussed
The COVID-19 outbreak has brought a lot of changes and
                                                                      in only a limited number of studies [7, 8]. In Japan in partic-
challenges to our daily life, and its impact on the envi-
                                                                      ular, lockdown in a strict sense was not made, but another
                                                                      scheme was employed. By this scheme, Government and
                                                                      local government requests for voluntary restraint on vari-
*Corresponding Author: Kimihiro Sakagami: Environmental
Acoustic Laboratory, Department of Architecture, Graduate School      ous activities were made in the form of the declaration of a
of Engineering, Kobe University, Rokko, Nada, Kobe 657-8501, Japan;   ‘state of emergency’. This was somewhat different from the
Email: saka@kobe-u.ac.jp

  Open Access. © 2020 K. Sakagami, published by De Gruyter.                This work is licensed under the Creative Commons Attribution 4.0
License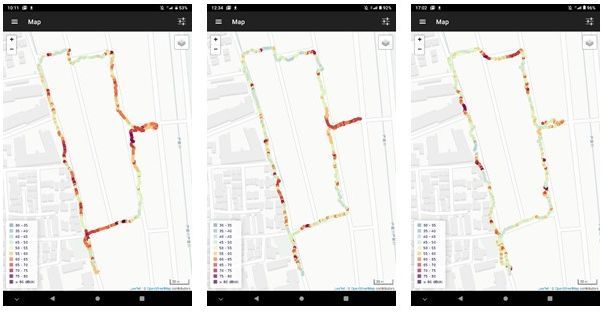
Supplementary survey results in post-emergency situations | 193

lockdowns in other countries around the world, as it was               From June, non-university schools were reopened;
a request for self-restraint that had no legal effect and was    however, the situation changed from time to time because
considered to be different in its impact on the acoustic en-     of half-day shifts and staggered classes, and it was diffi-
vironment as well. The author performed a limited small-         cult to ascertain the acoustic environment in this transi-
scale study of the noise levels and types of sound sources       tional state. This paper describes the results of a survey
during and after the state of emergency in a usually quiet       conducted in June 2020 (from 11 to 28 June, during the
residential area, and reported the results [8]. The results      rainy season in Japan) when the sound environment had
showed that, at least in the usually quiet area surveyed in      stabilised and school operations had normalised. The sur-
the study, the reduction in noise due to the declaration of      vey was based on the results of daily noise level variation
the state of emergency was about 1–2 dBA in LAeq (Equiv-         determined from fixed-point observations, which showed
alent Continuous Noise Level), which is significantly dif-       that daily activities such as school reopening and commut-
ferent from the reported differences in noise observed in        ing had almost normalised and became more or less the
large cities and airports. In this example, the considera-       same as they were before the state of emergency.
tions were limited to a very specific area, and the results,           A similar survey was also made from 19 July to 2 Au-
which were short-term averaged noise levels, are limited.        gust, which is shown in the Appendix, as the acoustic en-
However, it can be considered that similar results may be        vironment in this area was drastically changed by cicada
obtained for other quiet residential areas.                      sounds. Also, some results from a soundwalk survey in this
     Aletta et al. [7] conducted a more elaborated and com-      area are shown in Appendix A as additional information.
plete study on the impact of lockdown on the local-level               The following are the results of measurements of the
urban acoustic environment using short-term measures.            sound environment in this region with the sound pressure
They aimed to understand how lockdown measures have              level of the region as a whole. Unlike the case of a large
manifested at a local level to better determine how the          city centre, the results shown here are only an example of
person-level experience of the urban soundscape was af-          this region and are not intended to be generalised, since
fected and how those effects were different across urban         differences in behavioural patterns are likely to occur in
space types. They chose 11 points in London, and short-          residential areas depending on the attributes of the peo-
term (30-second) binaural recordings were obtained for           ple living there and the surrounding environment. Rather,
the study; they compared the results between Spring 2019         it is easy to imagine that each region has its own unique be-
(pre-lockdown) and Spring 2020 (during lockdown). Ac-            haviour and that it is not easy to generalise the results from
cording to their analyses, the average reduction in LAeq         a specific area to others, but it is considered necessary to
was 5.4 dBA, and the range was from 10.7 to 1.2 dBA. They        accumulate examples from various areas to gain insight.
pointed out that, as the multi-faceted consequences of the
COVID-19 crisis unravel, it is also important to acknowl-
edge that changes are happening at different scales. Also,
they remarked that the improvement in terms of environ-
                                                                 2 Methodology and results
mental noise pollution has been a positive unintended ef-
                                                                 In the previous report [8], various measurements and sur-
fect of the lockdown measures in many cities; planning for
                                                                 veys were performed; however, in the present study, fixed-
post-COVID scenarios is needed to make sure that sound
                                                                 point measurement was the focus. The measurements
levels do not go straight back to normal (or even worse) as
                                                                 were conducted at the same points as those previously re-
soon as containment measures are relaxed.
                                                                 ported [8], as shown in Figure 1. For the fixed-point obser-
     The above studies revealed the impact of lockdown
                                                                 vations, the equivalent noise level, LAeq (dBA), was mea-
(and similar schemes) on urban acoustic environments
                                                                 sured using a standardised (Class 2) sound level meter. The
at the local scale, which can be somewhat smaller than
                                                                 integration time was set to 1 minute in this study, although
the reported noise level reduction from city-scale stud-
                                                                 this was much shorter than that proposed by Asensio [6].
ies [2, 3, 6].
                                                                 However, according to Aletta et al. [7], short-term measures
     In Japan, the state of emergency was lifted on 25
                                                                 are useful to soundscape studies in similar situations. Con-
May 2020. However, almost all schools remained closed
                                                                 sidering the results in [6], this time of 1 min was chosen
throughout May even after the state of emergency was
                                                                 (instead of 30 s) because the measurements were made al-
lifted, and while social life showed a gradual tendency to
                                                                 most hourly and because the noise was almost stationary;
return to normal, it is likely that the life patterns of chil-
                                                                 therefore, it was difficult to show a time-specific difference
dren and students did not change significantly from those
                                                                 in the average value for a long time in order to show a clear
during the state of emergency.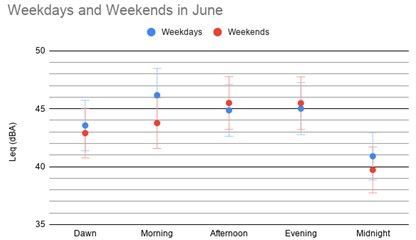
194 | K. Sakagami
no longer so crowded as it was during the surveyed period
in the previous study [8].
Sound source observations were not performed in the
main survey in the fixed-point measurements. This is be-
cause there was no significant difference between the pre-
vious survey in May (during and after the state of emer-
gency) and that in June (nearly a few weeks after the can-
cellation of the state of emergency declaration). Also, in
July–August, the acoustic environment in the area was
dominated by cicada sounds, which masked most other
sounds.
Other specific details of each survey are described in
the corresponding sections.
2.1 Day history of the noise level in June
The LAeq value was measured basically every hour every
day from 11 to 28 June 2020. The results were classified
into Dawn (04:00–06:00), Morning (07:00–11:00), After-
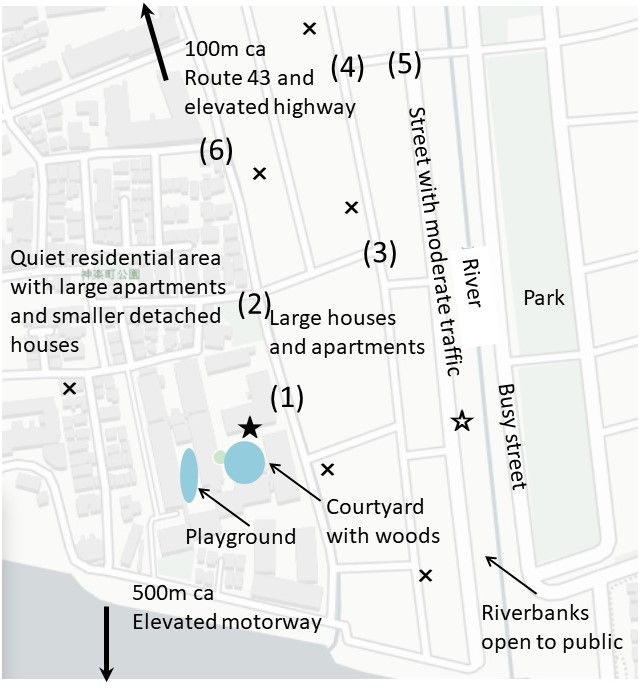
Figure 1: Map of the surveyed area (eastern edge of Kobe). The num- noon (12:00–16:00), Evening (17:00–19:00), and Midnight
bers (1) to (6) show measuring points in the previous survey [8]. The (23:00–01:00) according to people’s life patterns. Then,
black star is the measuring point for fixed-point observations in
the results obtained in a timeslot were averaged in each
both the present and previous studies. The white star is the measur-
ing point for monitoring noise levels in a public space (riverbank). time category, e.g., results obtained during 07:00–11:00
The X marks show construction sites (most of which were finished were averaged and allocated to Morning. The results ob-
during the June survey reported herein). tained in this way are summarised for weekdays and week-
ends (Saturday and Sunday) separately in Figure 2.
On both weekdays and weekends, the noise level was
time-specific change. The purpose of this survey is to un-
low at dawn and rose gradually, then fell to a low level
derstand the subsequent changes in the area covered by
in the evening, and was considerably quieter late at night.
the previous report, and it is desirable in this case to use a
There was little difference between weekdays and week-
method similar to that used in the previous report.
ends, and no statistical significance was found: t(87) = 0.67,
Regarding observation points 1 to 6, in this study, a
p = 0.5. However, there was a relatively large difference
supplemental soundwalk survey was performed to pro-
only in the morning. This is likely due to the fact that many
vide an overview of the acoustic environment in this
area. For this purpose, NoiseCapture on an Android tablet
(Teclast P80X) was used. The technical information of the
NoiseCapture app is available on its web site [9] and docu-
mented in [10]. Before the measurements, the app and the
device were calibrated using a standardised sound level
meter (SLM) (Class 1), and its validity, confirmed via the
method in [11, 12], was reported in [8]. The results of a
sound map made via soundwalk with this app give the
noise level range (dBA, LAeq ) along the soundwalk course.
Therefore, exact values of each point are not given, but one
can find the range as well as noisy or quiet areas from the
map. The results of the survey are presented later in this
note as additional information on the surveyed area. Figure 2: Comparison of the day history of noise levels (LAeq , T = 1
The point marked with a white star on the map was min) on weekdays (blue) and weekends (red) in June. The plot for
each time block is the averaged value over all weekdays and week-
not used in the present study, because the riverbank was
ends during the observation period. Error bars are also indicated
(95% range).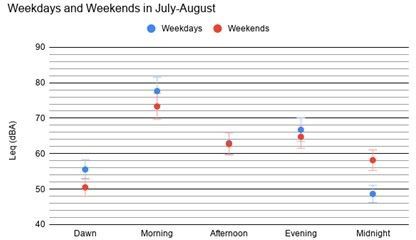
Supplementary survey results in post-emergency situations | 195

families have a high level of activity on weekdays as they
prepare for work and school in the mornings, whereas on
weekends there is relatively less activity and a lower noise
level because there is no need to do so.
     In terms of perceived sounds, since this area is usually
very quiet, it is difficult to point out a dominating or out-
standing sound source, however, in the early morning, the
only sounds were almost exclusively bird calls. The faint
road traffic noise from the rather distant national road was
heard almost always, however no other traffic noise was
heard except for occasional passing by of vehicles in the
street nearby. No other activity sounds were heard in the Figure 3: A comparison of the noise levels during the state of emer-
early morning. In the morning, household noise was heard gency, immediately after its cancellation, and in June. Error bars
early on, but this decreased as the morning progressed. indicate the 95% ranges of each value.
In the afternoon, there was generally less noise, but in
the evening, the sounds of children and students return- reference, by using unprocessed data t-test shows: t(209)
ing from school and their activities were heard. In the late = 2.58, p = 0.01).
evening, other than road traffic noise from the national          The day history of the noise level in June is inferred to
highway, most of the noise was from the mechanical venti- be close to that in the state of emergency (a t-test by using
lation of homes and boilers. Occasional construction noise the reorganised average data: t(8) = 0.30, p = 0.77; though
was also heard, but most of the work seems to have been t(203) = 1.9, and p = 0.06 with unprocessed data before reor-
completed in the morning, and such noise was less com- ganisation). The only observable difference between them
mon in the afternoon. Also, in the last week of June, oc- is in the afternoon, where the noise level in June was exclu-
casional air-conditioner noise was heard, but it was not sively lower than the others. In June, it is supposed that the
significantly strong. Therefore, it can be summarised that, town became quieter because children and students were
bird calls in the early morning and voice of children in the in school.
early evening were mainly perceived as the sounds char-           On the other hand, the day history immediately after
acterising the acoustic environment in this area. As June the cancellation of the state of emergency is exclusively
is rainy season, most days during the survey were either larger than the others. The t-test with the results in June
cloudy or rainy. The measurement point is surrounded by shows strong significance: t(8) = 2.78, p = 0.02 with reor-
many trees, and rain noise had some effect due to rainfall ganised and averaged data, and t(209) = 2.55, p = 0.00005
hitting the vegetations, which is somewhat unusual in the with unprocessed data before reorganisation; it shows es-
other seasons. Therefore, the measurement was not car- pecially clear differences in observed noise levels in the
ried out when it was heavily and mediumly raining. The morning, afternoon, and evening. This means that the
ground surface around the measurement point was mostly noise level was reduced in June to a level that was almost
paved by asphalt, except for the courtyard and vegetation the same as that during the state of emergency. In other
areas.                                                         words, the noise level immediately after the cancellation
     Figure 3 shows a comparison of the noise levels dur- of the state of emergency in May was possibly higher than
ing the state of emergency, immediately after its cancel- usual. In any case, it is highly probable that the difference
lation, and in June (nearly a few weeks after the cancel- between the level after the cancellation of the state of emer-
lation). Note that the data from the previous report repre- gency and that in June resulted from the difference in the
sented every one-hour period, but here they were reorgan- operation of schools; for example, in the early evenings,
ised into the categories used in the present work and aver- the noise level became lower in June, which is inferred to
aged in each category. In the previous report, it was shown be the result of fewer children playing outside during these
via t-test that the noise levels during the state of emergency hours. Also, June is the rainy season in Japan, and rain
and after its cancellation significantly differed. However, could prevent people from going outside, making the area
here, by this reorganisation of the data, the significance quieter.
of this difference was lowered: t(8) = 1.57, p = 0.16 (using
the reorganised and averaged data) which is interpreted as
weak significance). This reorganisation of the data allows
for comparisons of the rough trends of each data set. (For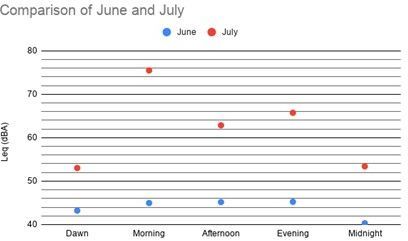
196 | K. Sakagami

2.2 Additional information from the                                        Figure 4 shows the results of the soundwalk survey
    soundwalk survey                                                  conducted nearly two months after the state of emergency
                                                                      was lifted (20 July 2020). The noise level range was almost
For measurement points 1 to 6 from the previous re-                   the same as that in the previous surveys [8]. In (a), some
port, NoiseCapture (installed on an Android tablet, Teclast           red marks indicate high noise levels due to cicada sounds,
P80X), which was also used in the previous report [8], was            which were especially high in the morning. However, in (b)
employed. It was calibrated and checked for accuracy us-              and (c), most of the red marks correspond to cars and mo-
ing a Class 1 sound level meter (SLM). For details of the             torbikes passing by. Considering these results, the acous-
accuracy check results, see [8], and for the method used              tic environment was not much different from that in winter
for the accuracy check, see [11, 12]. The overall noise level         2019.
and characteristics of the surveyed area and how these
changed after the declaration of the state of emergency
was lifted were investigated by way of a soundwalk using              3 Concluding remarks
NoiseCapture.
      In the previous report [8], it was reported that the            This note presents the results from a small-scale survey of
noise level usually ranged from 45 to 65 dBA, the higher              the acoustic environments in June and July 2020 in a res-
levels of which were observed only when cars passed by,               idential area that was surveyed during the state of emer-
in the pre-pandemic period (winter 2019). It seemed to in-            gency in April–May 2020 due to the COVID outbreak [8]. In
crease slightly during and after the state of emergency due           the previous report, the reduction in noise levels due to the
to increased traffic volume, although the difference was              state of emergency declaration was discussed, and this re-
not statistically significant. Since the COVID-19 outbreak            duction was reported to be approximately 1–2 dBA in the
began, people have tended to either stay home working re-             area. A similarly small reduction was reported by Aletta et
motely or commute by private vehicle to avoid public trans-           al. [7]. In their work, they compared the noise levels during
port. In the post-emergency situation, the traffic volume             lockdown with those in 2019 (pre-lockdown). However, al-
still seems to have not reduced to its level prior to the state       though in [8], data taken from 2019 were also referenced,
of emergency.

Figure 4: Noise maps taken from the results of soundwalks on 20 July 2020 using Noise Capture. This route includes Points (1) to (6) and
the surrounding area. (a) 09:40–45; (b) 12:10–15; (c) 16:40–45. Red marks indicate noise levels higher than 60 dBA (LAeq ). The areas with
higher levels were affected by cicada sounds in the morning (a). However, in many cases, these areas were somewhat quiet at noon and in
the evening (b and c) when the cicadas were not active. In maps (b) and (c), the red zones are mainly affected by cars passing by.
Supplementary survey results in post-emergency situations | 197
the main finding was that the noise level was smaller dur- [2] Arenas J.P., Acoustics and vibration in the time of the pan-
ing the state of emergency than after it was lifted. demic, Int. J. Acoust. Vib., 2020, 25(2), 131-132. DOI: 10.20855/
ijav.2020.25.2E96
The results from the measurements made in June (a
[3] Bruit et confinement: Acoucité objective les évolutions du
few weeks after the cancellation of the declaration) were
paysage sonore urbain en France. Le CIDB [online]. 4 May
close to those from during the state of emergency. This 2020. Available from: https://www.bruit.fr/bruit-et-politique/
can be considered in two ways: one is that the noise lev- confinement (in French) (Accessed 17 Aug 2020)
els returned to the lower level during the state of emer- [4] Acoucité, Impact sur l’environnement sonore (Ver. 1, 29 Apr
gency, and the other is that the noise level immediately af- 2020). Available from: https://www.bruit.fr/images/2020/04/
28/Impact_COVID-19_sur_lEnvironnement_Sonore_V1.pdf (in
ter the cancellation of the state of emergency was higher
French). (Accessed 17 Aug 2020)
than usual, because of rather unusual behaviour of resi- [5] Aletta F., Brinchi S., Carrese S., Gemma A., Guattari C., Mannini L.
dents due to school closures. The noise levels in each area et al., Analysing urban traflc volumes and mapping noise emis-
fluctuate according to various factors, such as human be- sions in Rome (Italy) in the context of containment measures
haviours, animals, vegetation, etc. Therefore, it is difficult for the COVID-19 disease, Noise Mapp. 2020, 7(1), 114-122. DOI:
10.1515/noise-2020-0010
to define what the ‘usual’ acoustic environment is; how-
[6] Asensio C., Aumond P., Can A., Casco L., Lercher P., Wunderi J-M.
ever, at least in the specific area surveyed in this small-
et al., A taxonomy proposal for the assessment of the changes in
scale study, the change in the noise level was small in any soundscape resulting from the COVID-19 lockdown. Int. J. Environ.
case, and there may be only a small possibility for the level Res. Pub. Health, 2020, 17, 4205. DOI: 10.3390/ijerph17124205
to change due to the impact of a pandemic, etc. [7] Aletta F., Oberman T., Mitchell A., Tong H., Kang J., Assessing
As, however, this is only an example and cannot be the changing urban sound environment during the COVID-19
lockdown period using short-term measurements, Noise Mapp.
generalised, it may be necessary to consider what the
2020, 7, 123-134. DOI:10.1515/noise-2020-0011
usual acoustic environment is or how it should be, if one [8] Sakagami K., How did the ‘state of emergency’ declaration in
should take this opportunity presented by the COVID out- Japan due to COVID-19 pandemic affect the acoustic environment
break as a motivation to reconstruct the acoustic environ- in a rather quiet residential area? UCL Open Environ., 2020, (1)06.
ment in urban areas. DOI: 10.14324/111.444/ucloe.000009
[9] NoiseCapture page in Noise Planet. Available from: https://
noiseplanet.org/noisecapture (Accessed 17 Aug 2020)
Funding: This work received no external funding.
[10] Picaut J., Fortin N., Bocher E., Petit G., Aumond P., Guillaume G.,
An open-science crowdsourcing approach for producing commu-
Conflict of Interests: There is no conflict of interest regard- nity noise maps using smartphone, Build Environ., 2019, 148,
ing the publication of this paper. 20-33. DOI: 10.1016/j.buildenv.2018.10.049
[11] Sakagami K., Satoh F., Omoto A., Revisiting acoustics educa-
tion using mobile devices to learn urban acoustic environments:
Author contribution: All work was carried out by the au-
Recent issues on current devices and applications, Urban Sci.,
thor (KS). 2019, 3, 73. DOI: 10.3990/urbansci3030073
[12] Sakagami K., Satoh F., Omoto A., Use of mobile devices with mul-
tifunctional sound level measurement applications: Some expe-
riences for urban acoustics education in primary and secondary
References schools, Urban Sci., 2019, 3, 111. DOI: 10.3990/urbansci3040111
[1] Aletta F., Osbon D., The COVID-19 global challenge and its impli-
cations for the environment – what we are learning, UCL Open
Environ., 2020, 1, 5. DOI: 10.14324/111.444/ucloe.000008198 | K. Sakagami
quite high throughout the day. The cicadas’ activity is in-
Appendix A: Supplementary results fluenced by the temperature and weather conditions, and
and observations from cicada activity seems to have been particularly high dur-
ing the measurement period due to high daytime temper-
measurements made in July-August atures; however, there is little qualitative difference in the
change trend, and the values are similar, i.e., low at Dawn
In July, due to the large number of trees in the area, the
and in the Evening, and high in the Morning and After-
noise level from cicadas was very high. As a result, the
noon. Exceptionally, Midnight noise levels were particu-
noise level was exclusively determined by the sound of ci-
larly high on weekends because there were days when it
cadas (Figure A1).
was particularly hot and cicadas were active until late at
The sound of cicadas determined the noise level al-
night. Therefore, Figure A2 shows the averages for week-
most exclusively on both weekdays and weekends, with
days and weekends combined. This makes the above trend
extremely high noise levels in the morning when cicadas
even clearer.
are more active. When the temperature rose above a cer-
Comparing the results for June and July together (Fig-
tain level, the noise level quietened down, but it was still
ure A3), we can see that although the noise level was over-
whelmingly higher in July, the change trends throughout
the day were generally similar, with low levels at dawn and
at night and higher levels during the daytime. The large
peak in the morning in July is because this was the most
active time for cicadas. However, excluding these fluctua-
tions due to cicadas, the rough trends of the noise level day
history can be assumed to be the same in residential areas
like this and in any season if only qualitative trends are
considered.
Figure A1: Comparison of the day history of the noise levels (LAeq , T
= 1 min) on weekdays (blue) and weekends (red) in July–August (19
July to 2 August 2020). The plot of each time block is the averaged
value over all weekdays and weekends during the observation
period. Error bars are also indicated (95% range). Note that the
significant difference was not observed by t-test between Weekdays
and Weekends: t(57) = 0.18, p = 0.86.
Figure A3: Comparison of the day history of the averaged noise lev-
els from June measurements (blue) and July–August measurements
(red).
These examples cannot be used in a discussion to eval-
uate the effect of the COVID outbreak on the acoustic envi-
ronment in this area as they are strongly dominated by ci-
cada sounds. However, this should be considered a ‘usual’
environment every summer in this area with many trees.
Figure A2: A comparison of the day history of the averaged noise
levels (LAeq , T = 1 min) over both weekdays and weekends in July–
August. The plot of each time block is the averaged value over all
weekdays and weekends during the observation period. Error bars
are also indicated (95% range).You can also read