A place to call home: housing vulnerable Victorians - September 2020
←
→
Page content transcription
If your browser does not render page correctly, please read the page content below
A place to call home: housing
         vulnerable Victorians

                    September 2020
Housing vulnerable Victorians
 Housing isn’t affordable to low-income earners
  • Low-income households are spending more of their budgets on housing
  • Victoria’s homelessness problem is getting worse
  • Worsening housing affordability widens inequality

                                                                          2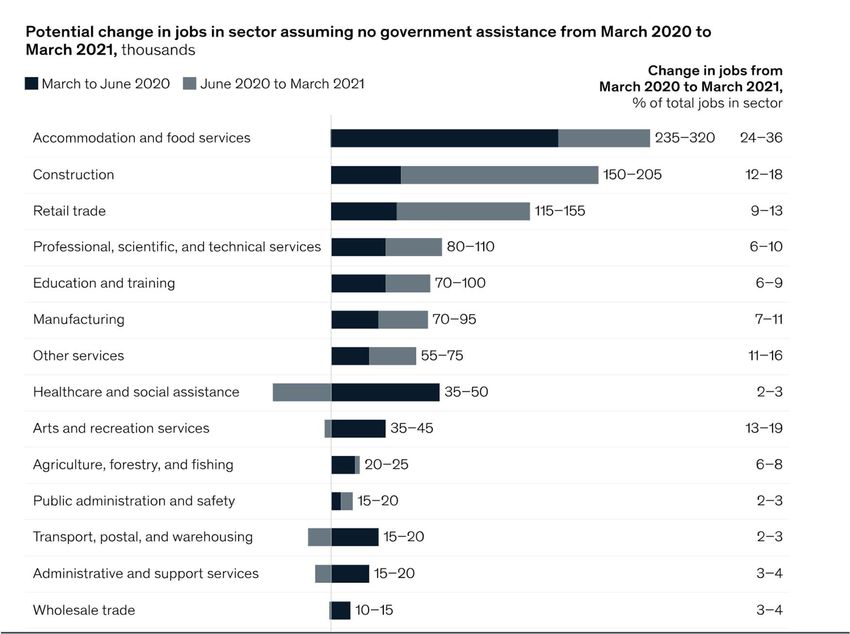
Low-income Victorians are spending more of their
incomes on housing
Share of income spent on housing
 30%
                                                                                                   Lowest

 25%

                                                                                                   Second
 20%
                                                                                                   Third
 15%                                                                                               Fourth

                                                                                                   Highest
 10%

   5%

   0%
            1995            1997            2000             2003      2006   2010   2014   2018
                                                Financial year ending
Sources: ABS Household Expenditure Survey 2017-18, Grattan analysis.                                   3
Households that rent are much more vulnerable –
 particularly young people on income support
Per cent of households facing at least one financial stress, 2015-2016
  50
                            Home owner
  40                        Renter

  30

  20

  10

     0
                     65+                                   65+                               18-65                                18-65
                 (no pension)                           (pension)                         (no welfare)                           (welfare)
Notes: Financial stress defined as money shortage leading to 1) skipped meals; 2) not heating home; 3) failing to pay gas, electricity or telephone bills
on time; or 4) failing to pay registration insurance on time. ‘Pension’ includes everyone over the age of 65 who receives social assistance benefits in
cash of more than $100 per week. ‘Welfare’ includes those who receive more than $100 per week from a disability support pension, carer payment,
unemployment or student allowance, or other government pension.                                                                                             4
Sources: ABS Household Expenditure Survey 2015-16, Grattan analysis.
Homelessness is increasing, especially among
overcrowded dwellings
Number of homeless per 10,000 of population, per state, 2006 to 2016
60
                                                     2006
                                                     2011
                                                     2016

40

20

  0
           NSW              VIC                QLD   WA   SA   TAS   ACT   AUS
Note: The NT is excluded for readability.
Sources: Estimating Homelessness, ABS (2016)                                     5
Most homeless Victorians are under the age of 35
Number of homeless per 10,000 of population, per state, 2006 to 2016

 4000
                 60% of homeless Victorians

 3000
                                                               Men
                                                               Women
 2000

 1000

       0
              Under         12–18 19–24 25–34 35–44 45–54 55–64 65–74 75 and
               12                                                      older
Sources: Estimating Homelessness, ABS (2016)                                   6
Incomes have risen across the board; but less so
after housing costs
Real growth from 2003-04 to 2015-16 per equivalised household
             Disposable income                   Disposable income                            Net wealth
                                                 after housing costs
50%

40%

30%

20%

10%

 0%
         1st 2nd 3rd 4th High
        Low              5th                   1st 2nd 3rd 4th High
                                               Low             5th                    1st 2nd 3rd 4th High
                                                                                      Low             5th
              Income quintiles                      Income quintiles                       Wealth quintiles
Notes: Income estimates for 2003–04 onwards are not perfectly comparable with estimates for 2015-16 due to
improvements in measuring income introduced in the 2007–08 cycle.
Source: Source: for income, ABS SIH 2003-04 and SIH 2015-16; for wealth, ABS 6523.0 Household Income and Wealth   7
The challenges faced by low-income earners in
securing affordable housing

Housing is more            Some households             Some households
expensive than it          can’t afford                face other barriers
should be because          housing, because            to accessing
our cities have not        their incomes are too       housing, such as
built enough housing       low to cover the rent       those with severe
to meet the needs of
                       &   or a mortgage.
                                                   &   disabilities, mental
Australia’s growing                                    health, or other
population.                                            issues.

                                                                              8
Housing low-income Australians in need
Housing isn’t affordable to low-income earners
• Low-income households are spending more of their budgets on housing
• Victoria’s homelessness problem is getting worse
• Worsening housing affordability widens inequality
Housing supply matters for people at the bottom but policy is failing
• Private rental is important for the bottom; but construction lags population growth
• More supply would reduce rents; tenancy reforms to make housing secure
9Younger, poorer Australians live in private rentals
Share of each age and income quintile by housing tenure type, 2015-16
Age group
15–29 30–44 45–59 60+
100 Other
80
60
Owner
40
occupiers
Public
20 renters
Private
0 renters
1 2 3 4 5 1 2 3 4 5 1 2 3 4 5 1 2 3 4 5
Income quintile
Notes: Age groups are determined by the “Age of Household reference person” category given in the Survey of Income and Housing. Income quintiles
are calculated by age group based on equivalised household disposable income 10
Source: ABS Survey of Income and Housing (2017)Fewer low-income Australians own their homes
compared to the past
Home ownership rates by age and income, 1981 and 2016, per cent
Age group
25–34 35–44 45–54 55–64
90
1981
80
2016
70
60
50
40
30
20
1 2 3 4 5 1 2 3 4 5 1 2 3 4 5 1 2 3 4 5
Income quintile
Notes: This graph updates Burke et al 2014 using Census data obtained from the ABS. Difficulties in accurately calculating household incomes across
time using Census data means that changes in home ownership rates by age and income are indicative and small changes in ownership rates should
be ignored. Excludes households with tenancy not stated (for 2016) and incomes not stated. Household age group according to age of household
reference person. Income quintiles are equivalised household income quintiles. 11
Sources: ABS Census; Burke et al 2014 ‘Generational change in home purchase opportunity in Australia’; Grattan InstituteRetirees of the future are more likely to be renters
Homeownership rate by age, per cent
90
Home-ownership
rates for over-65s
80 are projected to fall
13% by 2056
70
55-64
35-44 45-54 65+
60
25-34
50
40
2006 2016 2026 2036 2046 2056
Notes: Home ownership projections have been updated since Coates and Chen (2019) to exclude temporary migrants, many of whom are
younger and have low rates of home ownership but are unlikely to stay in Australia long term. 12
Source: ABS (2018); Grattan analysis.There’s a shortage of medium density housing
compared to what people want
Per cent of housing stock, actual and preferred
100
4 storeys
and
80 above
Up to 3
storeys
60
Semi-
detached
40
Detached
20 house
0
2006 actual 2016 actual Preferred 2006 actual 2016 actual Preferred
stock stock
Melbourne Sydney
Notes: ‘Preferred stock’ is from the survey of 700 residents about housing preferences from Grattan’s 2011 report, The housing we’d
choose. Data may not sum to 100 due to rounding. Excludes dwellings listed as ‘Not stated’ and ‘Other dwellings’, such as caravans.
Source: Census; Housing we’d choose; Grattan analysis 13And areas that built more have seen slower rent
increases for those at the bottom
Change in the bottom quintile of private market rents paid from 2011 to 2016, by
SA4, per cent
40%
Each 1% increase in
housing saw rents
30% grow ~2% slower
20%
10%
0%
-4 -3 -2 -1 0 1 2 3 4
-10%
-20%
Change in dwelling stock per 100 people
Notes: Excludes those with tenure type not stated. Private market includes those renting from a real estate agent, parent or other relative, or
other individual 14
Source: ABS Census Data (various years)Lower market rents could better house low-income
Australians even without bigger rental subsidies
Rental savings to low income private renter households, billions of dollars
3
Bottom 20 per cent by income
Bottom 40 per cent by income
2
1
0
5% 10% 15% 20%
Decrease in rents
Notes: Excludes those with tenure type not stated. Private market includes those renting from a real estate agent,
parent or other relative, or other individual.
15
Source: ABS Census Data (various years)Increasing rents is one of the key drivers of rising
homelessness
Increase in probability of entering homelessness among Journeys Home
participants
Never Been Employed
Previously slept rough
Low-income rents increase
Frequent drug use
Ever been in state care
Year 9 education or lower
Male
Experienced violence
Unemployment rate increases
Increased alcohol consumption
0% 1% 2% 3% 4% 5%
Notes: Journeys Home surveyed very disadvantaged income support recipients who were already at risk of homelessness. Therefore these results
are not representative of the entire population. Low-income rents and the unemployment rate are structural variables measured at the SA4 level.
Low-income rents are the 20th percentile of weekly rents. An increase in low-income rents is defined as a $100 increase in weekly rent. An increase
in the unemployment rate is defined as a 1 per cent increase. Some of the variables are excluded for readability.
Source: Johnson, Scutella, Tseng, and Wood (2018); Moschion (2017). 16Housing low-income Australians in need
Housing isn’t affordable to low-income earners
• Low-income households are spending more of their budgets on housing
• Victoria’s homelessness problem is getting worse
• Worsening housing affordability widens inequality
Housing supply matters for people at the bottom but policy is failing
• Private rental is important for the bottom; but construction lags population growth
• More supply would reduce rents; tenancy reforms to make housing secure
Rent assistance is a cost-effective way to house most low-income earners
• Rent assistance is well targeted by need; it’s fair; but it hasnt kept up with rental costs
• Little evidence that Rent Assistance pushes up rents
17Most rent assistance goes towards the bottom 20
per cent by wealth
Rent assistance spending for private renters by household wealth decile, $ millions
3,000
2,500
2,000
78% of CRA spending goes to the
poorest 20% of renters by wealth
1,500
1,000
500
0
1 2 3 4 5 6 7 8 9 10
Equivalised household net wealth decile 18
Source: ABS (2017)Commonwealth Rent Assistance hasn’t kept up with
rents, or low-income households expenditure on rent
Rent, change in the maximum rate of CRA, low-income HH median expenditure on
rent, index, weighted average of eight capital cities
200%
Actual rents paid
150%
Quality-adjusted
rents
100%
Rent Assistance
50%
0%
1995 2000 2005 2010 2015 2020
Note: Rent index for all households is constructed by the ABS using a weighted average of the eight capital cities. Max rate of Commonwealth Rent
Assistance is indexed to CPI. Note that low-income households’ median expenditure 19
Sources: ABS (2019), 6401.0 - Consumer Price Index, Australia, Jun 2019, A2325841T, A2331876FAustralian literature suggests increasing
Rent Assistance has little impact on rents
Foard (1995) – Renters are likely to spend almost all additional net income on
Most of any non-housing goods and services
increase in Rent
Pender (1996) – Even with a segmented private rental market, a $100 million
Assistance
increase in CRA would only increase rents by 0.59%
wouldn’t be
spent on rents Bray (1997) – When people on low incomes gain higher incomes, they spend
most of it on food, clothing, or bills
Vipond (1987) – The price elasticity of supply for the private rental stock is
almost perfectly elastic, meaning landlords don’t increase rents when demand
increases
Rents would be
unlikely to Bray (1997) – Each $1 of Rent Assistance raises rents by 1 and 5 cents
increase
Hulse (2002) – concludes Australian housing market is already relatively well-
informed, regulated, and competitive – suggesting CRA increases would be
unlikely to cause rental price inflation
Hyslop and Rea (2018) – Increased rental subsidies in Auckland saw rents
increase by 36 per cent of the value of additional subsidies, but mostly reflected
Increases in extra spending on (better) housing rather than higher rental prices.
rental subsidies
Kangasharju (2010) – Increasing housing allowances in Finland in 2002 also
increased rents by 60 to 70 cents in the dollar. But in Finland housing
allowances are paid directly to the landlords. 20Housing low-income Australians in need
Housing isn’t affordable to low-income earners
• Low-income households are spending more of their budgets on housing
• Victoria’s homelessness problem is getting worse
• Worsening housing affordability widens inequality
Housing supply matters for people at the bottom but policy is failing
• Private rental is important for the bottom; but construction lags population growth
• More supply would reduce rents; tenancy reforms to make housing secure
Rent assistance is a cost-effective way to house most low-income earners
• Rent assistance is well targeted by need; it’s fair; but it hasnt kept up with rental costs
• Little evidence that Rent Assistance pushes up rents
Expand social housing for the most vulnerable, but not for everyone
• There is a strong case for more social housing for those at risk of long-term
homelessness that can’t access private rental housing
• Stagnating social housing stock means little available for new high-needs groups
• Housing first approaches are effective, but expensive, and there are no free lunches
• Social housing would be an effective fiscal stimulus giving slowing residential
construction
21Social housing substantially reduces the risk of
homelessness
“…a lack of adequate and affordable housing contributes to
housing stress and homelessness, and is detrimental to
people’s physical and mental health. Homelessness affects
life expectancy, with homeless people estimated to live 15–
20 years less than the mainstream population.”
Productivity Commission, Report on Government Services:
Housing and Homelessness, 2017, G.11
“In the period following placement, the person’s
probability of experiencing homelessness was 13
percentage points lower than similar individuals not in
social housing, who have a homelessness rate of about
20%. This is equivalent to a 65% reduction in the risk of
homelessness for social housing residents.”
Scutella, R., Social housing protects against
homelessness – but other benefits are less clear, The
Conversation, 4 July 2018
22Social housing has never housed most low-income
Australians, but the stock is stagnating
Social housing as a proportion of all housing, per cent
7%
6%
5%
Community
4% housing
3%
Public
2% housing
1%
0%
1976 1981 1986 1991 1996 2001 2006 2011 2016
Note: Before 1996 community housing was not recorded in the Census, but it likely accounted for a small amount of the total social housing stock. 23
Sources: Grattan analysis of ABS (1978), ABS (1983), ABS (1988), ABS (1993), ABS (1997), ABS (2001), ABS (2006), ABS (2011) and ABS (2016)Many Australians are ‘eligible’ for social housing,
but for most it’s a false promise
Gross income limits to apply for social housing waitlist, per state, 2018
Single, no children Couple, no children
Gross income Share eligible Gross income Share eligible
threshold ($) threshold ($)
NSW 31,720 48% 43,680 24%
VIC (Register of Interest) 51,584 66% 78,936 50%
VIC (Priority access list) a 28,860 40% 49,868 30%
QLD 31,668 44% 39,260 17%
WA (Metro and country) 22,360 13% 34,840 9%
WA (North West and Remote) 31,720 48% 48,880 32%
SA 50,856 74% 66,508 46%
TAS b 28,704 52% 49,608 35%
ACT 37,180 29% 46,436 8%
NT 41,028 34% 53,300 12%
Notes: Assumes 5 per cent nominal wage growth from 2015-16 to 2018. Application eligibility criteria may be different from the ongoing eligibility criteria once allocated
housing. a. Priority access applicants may be offered a home sooner. Applicants may be eligible if they are subject to violence in their own home, need to move for
health reasons, have current housing inadequate for their family size, live in emergency or transitional housing, stay with someone temporarily while looking for a home.
b. To be eligible for social housing in Tasmania, one’s incomes must qualify for a Commonwealth Low Income Healthcare card. 24
Source: ABS Survey of Income and Housing (2017), State Government Websites (2018), Department of Human Services (2018)Most social housing tenants have been there for
more than five years
Per cent of social housing households, 2016
30
25
20
15
10
5
0
< 6 months 6 months 2 to 4 5 to 9 10 to 19 20 to 29 30 or more
to 1 year
Tenure length (years)
25
Source: AIHW (2017)Very few tenants leave social housing of their own
accord
Per cent of public housing exits, 2012-13
Private rental Left due to own
choices
Unknown
Purchased home
Death
Age/health
Eviction and fixed
Inter-public housing tenancy termination
transfer Prison
26
Source: Wiesel, Pawson, Stone, Herath, and McNelis (2014)New ‘greatest needs’ public housing tenants were
mostly homeless prior to entry
Greatest need households allocated into public housing by main reason for need,
proportion, 2016-17
8.4
100 1.4
6.7
11.1
75 19.3
53.1
50
39% at risk of homelessness
25
0
Already Safety Health Living in Cost Other Total
homeless issues unsuitable
housing
Notes: Data unavailable for NT. Where multiple categories apply main reason is recorded. ”Other” is undefined in the source data, but likely includes
other outstanding reasons for which the State Housing Authority would determine a household in great need. 27
Source: AIHW 2018 Housing Assistance – Priority Groups. Table priority.2But many high needs applicants aren’t getting
assisted
Number of new “greatest needs” applicants and number of new households
assisted for social and community housing, 2013-2017
250,000
New “greatest need” applicants
New households assisted
200,000
150,000
100,000
50,000
0
Public housing Community housing
Notes: A “greatest need” applicant is a low-income household which at the time of allocation was either homeless, had their life or safety at risk in their
current accommodation, had housing inappropriate to their needs, or had very high rental housing costs. A low income greatest need household
satisfies eligibility for housing assistance
28
Source: Productivity Commission, Report on Government Services, Housing, 2018But providing substantially more social housing
will be very expensive
Estimates of average cost per year of providing a social and affordable housing unit,
compared to NRAS subsidies
‘Affordable’ housing Social / Public housing
15000
12000
9000
6000
3000
0
Affordable Social Public Social NRAS
Housing Housing Housing Housing subsidy
(COAG) (COAG) (PC) (AHURI)
Notes: COAG estimates are for income based rents, not exceeding 25 % of a $30,000 annual income for social housing, or 75 % of a $47,500
annual income for affordable housing. Public Housing is based on net recurrent real government spending per average public housing unit. AHURI
estimate based on providing 5.5% increase on social housing dwellings across 20 years. COAG figures also assume a capital cost of $225,000.
Sources: COAG Affordable Housing Working Group, Supporting the implementation of an affordable housing bond aggregator, September 2017,
p.12.; Productivity Commission Report on Government Services, Housing 2018; Lawson, J et al (2018), Social housing as infrastructure: an 29
investment pathway, AHURI Final Report 306, p. 55.The fall in construction employment appears to be
accelerating
Weekly Payroll jobs index, benchmarked to 14 March 2020
100
98
96 SA
WA
94
QLD
VIC
NSW
92
Apr May Jun Jul Aug
30
Source: ABS Weekly Payroll Jobs and Wages in Australia, Week ending 11 July 2020Expect more job losses in the coming months,
especially in construction
150k-205k jobs
(12-18% of total
workforce) to go
by March 2021
31
Source: McKinseySocial housing would make for very effective
stimulus
"The Commonwealth Social Housing
Initiative will provide up to $6.0 billion to
fund the construction of approximately
20,000 new public and community
housing dwellings, to be largely
completed by December 2010.
“The Government will also provide
$200.0 million in 2008-09 and $200.0
million in 2009-10 for repairs to existing
public housing stock.”
Australian Government, Updated
Economic and Fiscal Outlook, February
2009.
32
Source: Department of Social Services.… and in very quick time
Dwelling approvals, public sector, rolling 12 month sum
20000
Other residential
Houses
15000
10000
5000
0
Mar-1985 Mar-1991 Mar-1997 Mar-2003 Mar-2009 Mar-2015
33
Source: ABS (2019) 8731.0 Building Approvals, Australia, Table 11Housing low-income Australians in need
Housing isn’t affordable to low-income earners
• Low-income households are spending more of their budgets on housing
• Victoria’s homelessness problem is getting worse
• Worsening housing affordability widens inequality
Housing supply matters for people at the bottom but policy is failing
• Private rental is important for the bottom; but construction lags population growth
• More supply would reduce rents; tenancy reforms to make housing secure
Rent assistance is a cost-effective way to house most low-income earners
• Rent assistance is well targeted by need; it’s fair; but it hasnt kept up with rental costs
• Little evidence that Rent Assistance pushes up rents
Expand social housing for the most vulnerable, but not for everyone
• There is a strong case for more social housing for those at risk of long-term
homelessness that can’t access private rental housing
• Stagnating social housing stock means little available for new high-needs groups
• Housing first approaches are effective, but expensive, and there are no free lunches
• Social housing would be an effective fiscal stimulus giving slowing residential
construction
More affordable housing is not the answer
34Affordable housing is typically not well
targeted at those that need it most
Share of NRAS households by unequivalised household income, 2015-16
100 Bottom 20%
Bottom 40%
Top 60%
80
60
40
20
0
10,000 20,000 30,000 40,000 50,000 60,000 70,000 Over
70,000
Households with gross household incomes below...
Notes: Household income isn’t equivalised for household size due to limitations in the NRAS data.
Source: DSS Tenant demographic report 2016; ABS SIH 2015-16; Grattan analysis
35NRAS subsidies are greater than what’s
required in every suburb in Australia
Value of a 20 per cent discount to median rent for each NRAS allocation, 2016
12000
10000 NRAS subsidy: $10,983
Investor / Developer
windfall
8000
6000
4000
Value for
2000 tenants
0
0 5000 10000 15000 20000 25000 30000 35000
NRAS Allocations
Notes: Assumes a landlord incentive of $10,983 for a 20 per cent rent subsidy in each suburb. Incentive for the 2015-16 calendar year is an average of
incentives for the 2015-16 and 2016-17 financial years. Assumes that each allocation would have market rent equal to the suburb median. Some suburbs
are unable to be matched up, given different naming between the ABS and DHS, however the analysis captures over 99 per cent of all NRAS allocations.
Source: DHS December 2016 NRAS Quarterly Report; ABS Census 2016
36NRAS subsidies also don’t vary with the size
(or location) of the dwelling constructed
Value of a 20 per cent rental discount on the median rental dwelling by SA2, Victoria,
2018, thousands
1 bedroom flat 2 bedroom flat
15 15
NRAS subsidy: $11,192 NRAS subsidy: $11,192
10 10
5 5
0 0
3 bedroom house 4 bedroom house
15 15
NRAS subsidy: $11,192 NRAS subsidy: $11,192
10 10
5 5
0 0
Notes: Data is for new bonds lodged in September 2018. Total LGAs = 79. Data unavailable for some LGAs, for some dwelling sizes, due to small
number of new bonds lodged. 1 BR Flat reports 57 LGAs, 2 BR Flat reports 68 LGAs, 3 BR House reports 78 LGAs, 4 BR House reports 65 LGAs.
NRAS Incentive reported is for 2018-19, valued at $11,192. Use of new bond information likely incorporates the new build premium which may boost
the market rent value of NRAS properties. 37
Source: Victorian Rental Report September Quarter 2018.Most NRAS dwellings were small, so landlords
could pocket more of the subsidy
Allocations by number of bedrooms by state/territory, 30 Sept 2018
10,000
5+ BR
4 BR
3 BR
8,000 2 BR
1 BR
Studio
6,000
4,000
2,000
0
NSW VIC QLD WA SA TAS ACT NT
Source: Quarterly Performance Report Sept 2018, Table 11. 38Fewer NRAS properties were delivered than
planned, and at a much slower rate
Subsidies provided to NRAS investors, cumulative, March 2018
60,000 Target
NRAS closed to Actual
new applications
40,000
20,000
0
2009 2010 2011 2012 2013 2014 2015 2016 2017 2018
Source: DSS Monthly and quarterly reporting
Notes: Cumulative figures at April for each year. 2018 figures are for March due to available data. Figures are for dwellings built and able 39
to be rented, do not include reserved allocations still being built.Grattan’s earlier housing work focused on
affordability more broadly
40It found that all the important reforms are
difficult; all the easy reforms are cosmetic
Social, economic and budgetary impacts
Positive Home in pension
Abolish stamp duty
assets test Boost density in
Improve transport middle suburbs
Congestion project selection
charging Reform state land taxes
Improve renting CGT discount
conditions Boost density along
Negative
Macro-prud. transport corridors
Tax empty gearing
dwellings Foreign investor rules ↑ greenfield land supply
SMSF borrowing crackdown / taxes CGT on primary residence
Neutral
Social housing ↓stamp duty
Shared equity Reduce Impact on housing
bond aggregator for downsizers
schemes Deposit immigration affordability
schemes Downsizers
keep pension /
Regional exempt from
development super rules
FHB grants /
concessions
Negative Minimal Small Medium Large Very large
Source: Grattan analysis.
Political difficulty: Easy Medium Difficult
Notes: Prospective policies are evaluated on whether they would improve access to more affordable housing for the community overall, assuming no other policy
changes. Assessment of measures that boost households’ purchasing power includes impact on overall house prices. Our estimates of the economic, budgetary
41 on
or social impacts should not be treated with spurious precision. For many of these effects there is no common metric, and their relative importance depends
the weighting of different political values. Consequently our assessments are generally directional and aim to produce an informed discussion.In Victoria, areas that built more housing have seen
lower growth in rents
Change in median rents by LGA, 2006 to 2016
100%
Each 1% extra
dwelling stock per
80% person saw rents
grow 3.7% less over
the past decade
60%
40%
20%
y = -3.67x + 0.61
0%
-5% 0% 5% 10% 15%
Change in housing stock per inhabitant aged 20+ (per cent)
42
Source: DHHS (2018), ABS Census (multiple years)Filtering is an important source of affordable
housing for low-income earners
Per cent of US affordable rental housing stock in 2013 by source
Constructed or
added after 1985
(23%)
Preserved from
1985 stock
(32%)
Converted from
owner-occupier or
seasonal rental
Filtering accounts for (22%) Filtered down
45% of affordable from higher price
housing available to low- (23%)
income earners in the US
Notes: Affordable housing is defined as costing no more than 30 per cent of income for households with very low incomes (earning less than 50 per cent
of area median). Units added include rentals that were temporarily out of the stock in that year.
Source: Weicher, Eggers, Moumen (2016), The Long-Term Dynamics of Affordable Rental Housing.
43You can also read