Trading Update Presentation - Results for the Nine Months to 30 September 2020 Release: 24 November 2020 - Travelodge
←
→
Page content transcription
If your browser does not render page correctly, please read the page content below
Replace image

Trading Update Presentation
Results for the Nine Months to 30 September 2020

Release: 24 November 2020

Disclaimer
You must read the following before continuing

This presentation has been prepared by Thame and London Limited, TVL Finance plc and Travelodge Hotels Limited (collectively, “the “Company”) solely for informational purposes. For the purposes of this
disclaimer, the presentation that follows shall mean and include the slides that follow, the oral presentation of the slides by the Company or any person on their behalf, any question and answer session that
follows the oral presentation, hard copies of this document and any materials distributed in connection with the presentation. By attending the meeting at which the presentation is made, dialling into the
teleconference during which the presentation is made or reading the presentation, you will be deemed to have agreed to all of the restrictions that apply with regard to the presentation and acknowledged that
you understand the legal and regulatory sanctions attached to the misuse, disclosure or improper circulation of the presentation. The Company does not make any representation or warranty or other
assurance, express or implied, that this document or the information contained herein or the assumptions on which they are based are accurate, complete, adequate, fair, reasonable or up to date and they
should not be relied upon as such. The Company does not accept any liability for any direct, indirect or consequential loss or damage suffered by any person as a result of relying on all or any part of this
document and any liability is expressly disclaimed.

The Company has included non-IFRS financial measures in this presentation. These measurements may not be comparable to those of other companies. Reference to these non-IFRS financial measures
should be considered in addition to IFRS financial measures, but should not be considered a substitute for results that are presented in accordance with IFRS.

The information contained in this presentation has not been subject to any independent audit or review. A significant portion of the information contained in this document, including all market data and trend
information, is based on estimates or expectations of the Company, and there can be no assurance that these estimates or expectations are or will prove to be accurate. Our internal estimates have not been
verified by an external expert, and we cannot guarantee that a third party using different methods to assemble, analyse or compute market information and data would obtain or generate the same results. We
have not verified the accuracy of such information, data or predictions contained in this report that were taken or derived from industry publications, public documents of our competitors or other external
sources. Further, our competitors may define our and their markets differently than we do. In addition, past performance of the Company is not indicative of future performance. The future performance of the
Company will depend on numerous factors which are subject to uncertainty.

Certain statements contained in this document that are not statements of historical fact, including, without limitation, any statements preceded by, followed by or including the words “will,” “targets,” “believes,”
“expects,” “aims,” “intends,” “may,” “anticipates,” “would,” “could” or similar expressions or the negative thereof, constitute forward-looking statements, notwithstanding that such statements are not specifically
identified. In addition, certain statements may be contained in press releases, and in oral and written statements made by or with the approval of the Company that are not statements of historical
fact and constitute forward-looking statements. Examples of forward-looking statements include, but are not limited to: (i) statements about future financial and operating results; (ii) statements of strategic
objectives, business prospects, future financial condition, budgets, potential synergies to be derived from acquisitions, projected levels of production, projected costs and projected levels of revenues and
profits of the Company or its management or board of directors; (iii) statements of future economic performance; and (iv) statements of assumptions underlying such statements.

Forward-looking statements are not guarantees of future performance and involve certain risks, uncertainties and assumptions which are difficult to predict and outside of the control of the management of the
Company. Therefore, actual outcomes and results may differ materially from what is expressed or forecasted in such forward-looking statements. We have based these assumptions on information currently
available to us, if any one or more of these assumptions turn out to be incorrect, actual market results may differ from those predicted. While we do not know what impact any such differences may have on our
business, if there are such differences, our future results of operations and financial condition, and the market price of the notes, could be materially adversely affected. You should not place undue reliance on
these forward-looking statements. All subsequent written and oral forward-looking statements attributable to the Company or any person acting on its behalf are expressly qualified in their entirety by the
cautionary statements referenced above. Forward-looking statements speak only as of the date on which such statements are made. The Company expressly disclaims any obligation or undertaking to
disseminate any updates or revisions to any forward-looking statement to reflect events or circumstances after the date on which such statement is made, or to reflect the occurrence of unanticipated events.

We have included other operating information in this presentation, some of which we refer to as “key performance indicators.” We believe that it is useful to include this operating information as we use it for
internal performance analysis, and the presentation by our business divisions of these measures facilitates comparability with other companies in our industry, although our measures may not be comparable
with similar measurements presented by other companies. Such operating information should not be considered in isolation or construed as a substitute for measures prepared in accordance with IFRS.

The presentation does not constitute or form part of, and should not be construed as, an offer to sell or issue, or the solicitation of an offer to purchase, subscribe to or acquire the Company or the Company’s
securities, or an inducement to enter into investment activity in any jurisdiction in which such offer, solicitation, inducement or sale would be unlawful prior to registration, exemption from registration or
qualification under the securities laws of such jurisdiction. No part of this presentation, nor the fact of its distribution, should form the basis of, or be relied on in connection with, any contract or commitment or
investment decision whatsoever. This presentation is not for publication, release or distribution in any jurisdiction where to do so would constitute a violation of the relevant laws of such jurisdiction nor should it
be taken or transmitted into such jurisdiction.

                                                                                                           2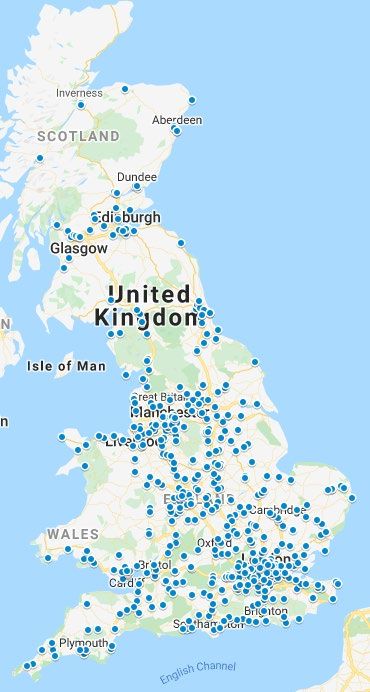
Summary
Covid-19 impact continues - navigating the material uncertainty
Significant impact of Covid-19 on the year-to-date
Decisive action taken to optimise trading and preserve liquidity
Tough conditions but relatively resilient sales and outperformance when hotels permitted to open
Approaching the new year with a strengthened position
- retained a large and diversified hotel network – equivalent to over 98% of 2019 UK hotel EBITDA(1)
- positioned to benefit from recovery as it emerges – direct distribution, domestic travel focus, business/leisure mix
- benefiting from temporary rent reductions
- new £60m super senior term facility signed on 18 November 2020 (2)
- further £30m equity injection to complete by 2 December 2020
Material uncertainty still remains and a long road ahead - but starting to move forward
1. 2019 UK hotel EBITDA is EBITDA (adjusted), excluding Spain, Ireland, management contracts and central and marketing costs and the EBITDA of the one hotel lease surrendered in July 2020
2. As part of the refinancing of existing £60m Super Senior RCF
3
Covid-19 Impacted Trading for the Year-to-Date
Travel restrictions driving significantly reduced performance
Strong trading continued in early months of year
Significant Covid-19 impact from mid-March
Most hotels closed from 24 March to 15 July, national/regional restrictions from 22 September
Virtually no trading in first lockdown, encouraging positive EBITDA in Q3, second English lockdown from 5 November
Adverse trading conditions – Nine Months to 30 September 2020:
- Overall YTD to Q3 revenue down (57.7)% to £230.9m (2019: £546.1m)
- LFL RevPAR(1) down (57.1)% to £18.00 (2019: £41.98)
- RevPAR growth(1) 3.2pts ahead of competitive segment (London 4.7pts / Regions 3.4pts)
- EBITDA (adjusted)(2) down £(150.5)m to a loss of £(48.3)m (2019: profit of £102.2m)
Q3 resilience – encouraging occupancy, positive EBITDA benefiting from rent reductions and job retention scheme
Cash at 30 September of £71.5m
1. RevPAR is computed as the product of the Average Daily Rate for a specified period multiplied by the Occupancy for that period.
Like-for-like (“LFL”) RevPAR compares the RevPAR in Q3 YTD 2020 vs. Q3 YTD 2019 on the basis of RevPAR generated by hotels that were opened before 1 January 2019.
2. EBITDA (adjusted) = Earnings before interest, tax, depreciation, amortisation and before rent adjustment and non-underlying items, before IFRS16. Non-underlying items have been removed
as they relate to non-recurring, one-off items.
4
Current Position
Securing the business amid material uncertainty
England lockdown scheduled to end on 2 December
- trading c.200 hotels where permitted during current restrictions
Strong, diversified network secured for the future
- retained hotels accounted for over 98% of 2019 UK hotel EBITDA(1)
Strengthened liquidity position
- £60m new facility – will fully fund by 1 December, we will receive the remaining £30m
- £40m equity injection – will fully fund by 2 December, we will receive the remaining £30m
Tough conditions but resilient trading
- Midscale and Economy segment continues to outperform UK hotel market
- Diversification helps mitigate Covid-19 restrictions
- c. £55m in CVA rent reductions through 2021
- Cost optimisation continues with use of job retention scheme
- Nine new hotels opened to date
Outlook remains materially uncertain
1. 2019 UK hotel EBITDA is EBITDA (adjusted), excluding Spain, Ireland, management contracts and central and marketing costs and the EBITDA of the one hotel lease surrendered in July 2020
5
Q3 YTD Results

       6
Significant Covid-19 Impact on YTD Trading
     Strong recovery over summer then impacted by restrictions and English lockdown

                                                                                              Total UK revenue (£m)
     90.0                                                                                                                                                                                  60%

     80.0                                                                                                                                             Start of November lockdown           40%

     70.0                                                                                                                                                                                  20%
                 6%              4%
     60.0                                                                                                                                                                                  -

     50.0                                                                                                                                                                                  (20%)

                                                                                                                                                                                                    YoY %
£m

     40.0                                                                                                                    (47%)    (47%)                                                (40%)
                                        (43%)
                                                                                                                                              (55%)      (57%)
     30.0                                                                                                                                                                                  (60%)

                                                                                                                (82%)                                                (80%)       (81%)
     20.0                                                                                                                                                                                  (80%)
                                                                             (94%)           (93%)
                                                       (95%)
     10.0                                                                                                                                                                                  (100%)

         -                                                                                                                                                                                 (120%)
                   P1             P2              P3             P4              P5             P6               P7           P8       P9      P10       Week 45      Week 46    Week 47

                                                                                                         FY20         FY19    YoY %                                P11 to date
UK revenue (exc. management contracts) presented on management accounting periods (5/4/4 weekly basis)

                                                                                                                  7
YTD Operating Metrics
Material impact from hotel closures but continuing to outperform
RevPAR Decline Driven by Onset of Covid-19 and Related Hotel Closures
LFL1 RevPAR (£)2 Q3 YTD RevPAR Growth Ahead of Market
Q3 YTD 2020 vs. Q3 YTD 2019
STR MS&E Travelodge
41.98 RevPAR: like-for-like UK RevPAR
decline of (57.1)%
18.00
RevPAR vs Market: 3.2pts
outperformance against MSE segment
(57.1)%
Q3 YTD 2019 Q3 YTD 2020 Occupancy: occupancy decreased
38.2pts to 41.9%
LFL1 Occupancy (%)2 LFL1 ADR (£)2
ADR: down (18.0)% to £42.94
80.1
52.38
41.9
42.94
Q3 YTD 2019 Q3 YTD 2020 Q3 YTD 2019 Q3 YTD 2020
1. RevPAR is computed as the product of the Average Daily Rate for a specified period multiplied by the Occupancy for that period. Like-for-like (LFL) RevPAR compares the RevPAR in HQ3 YTD
2020 vs. Q3 YTD 2019 on the basis of RevPAR generated by hotels in the UK that were opened before 1 January 2019.
2. Occupancy, ADR and RevPAR for UK leased estate only.
8YTD Financial Results
Revenue more than halved and substantial EBITDA loss
Revenue declines impacting EBITDA
Revenue (£m) EBITDA(1) (£m) Q3 YTD 2020 vs. Q3 YTD 2019
Revenue decrease of (57.7)%/£(315.2)m was primarily due to:
Like-for-like UK RevPAR decline of (57.1)% following hotel
546.1 102.2 closures
Spain down (70)%/£(7.9)m, due to Covid-19 hotel closures
230.9
EBITDA(1) decreased £(150.5)m to a loss of £(48.3)m driven by:
(48.3) Revenue declines as a result of the hotel closures
Q3 YTD 2019 Q3 YTD 2020 Q3 YTD 2019 Q3 YTD 2020 Partially offset by actions to reduce run-rate operating costs
Revenue (£m) EBITDA(1) (£m) Q3 2020 vs. Q3 2019
Revenue decrease of (57.8)%/£(120.6)m was primarily due to:
Like-for-like UK RevPAR decline of (59.4)%
208.8
57.5 Reflecting a transition from hotel closures at the beginning of
the quarter to all available hotels re-open by mid August
88.2
EBITDA(1) decreased £(53.4)m to a profit of £4.1m driven by:
4.1
Revenue declines as a result of the hotel closures
Q3 2019 Q3 2020 Q3 2019 Q3 2020 Strong cost control and benefit of JRS
1. EBITDA (adjusted) = Earnings before interest, tax, depreciation, amortisation and before rent adjustment and non-underlying items, before IFRS16. Non-underlying items have been removed
as they relate to non-recurring, one-off items.
9YTD Cash Flow
Cash position managed tightly and strengthened by new facilities and equity injection
(48.3)
90.0
10.0
70.0 70.0
£m
7.9 (31.3)
50.0
89.2
71.5
30.0 61.5
(22.1)
10.0 (1.3) (2.8) 0.2
(10.0)
Cash outflow of £(97.7)m before drawdown of RCF’s and new equity
Working capital benefited from rent payments (both reductions and the move to monthly payment in advance for some landlords) as
well as the deferral of payments in respect of VAT as a result of UK government Covid-19 support measures, partially offset by lower
inflows from prepaid rooms and the net VAT reclaim position for the third quarter
Provisions and Non-underlying items includes recovery plans costs (including CVA costs) offset by Holborn lease surrender premium
Drawdown of £40m of existing RCF (fully drawn) and £30m of new SSRCF (further £30m undrawn), £10m of new equity
1. EBITDA (adjusted) = Earnings before interest, tax, depreciation, amortisation and before rent adjustment and non-underlying items, before IFRS16. Non-underlying items have been removed
as they relate to non-recurring, one-off items.
2. Although the adoption of IFRS16 has no impact on opening or closing cash balances, in order to facilitate the comparability of the underlying business to the prior year the cash flow is
presented in line with the accounting principles ‘before IFRS16’
10Recent Trading
11Recent Trading
RevPAR prior to new wave of lockdown restrictions – underpinned by good occupancy
Hotel RevPAR
• Positive sales results between lockdowns
60 Re-opening and Impacts of tiered and 0%
summer trading November lockdowns (10)% - resilient blue-collar business travel
50 (20)%
RevPAR (£ per room)
(30)% - some pent-up leisure demand in coast and countryside
40
YoY variance %
(40)%
30 (50)% • Good outperformance of UK market and MSE segment
(60)%
20 (70)% - MSE RevPAR(1) growth tracked c. 10pts better than UK
10 (80)% hotel market as a whole
(90)%
0 (100)% - TVL outperformed by average 4pts over July to October
Week 26
Week 27
Week 28
Week 29
Week 30
Week 31
Week 32
Week 33
Week 34
Week 35
Week 36
Week 37
Week 38
Week 39
Week 40
Week 41
Week 42
Week 43
Week 44
Week 45
Week 46
Week 47
• New tiered restrictions announced end of September
Oct Nov
2020 2019 YoY variance %
Hotel Occupancy Hotel ARR
100% 70
90% 60
80%
70% 50
ARR (£ per room)
Occupancy %
60% 40
50%
40% 30
30% 20
20%
10% 10
0% 0
Week 26
Week 27
Week 28
Week 29
Week 30
Week 31
Week 32
Week 33
Week 34
Week 35
Week 36
Week 37
Week 38
Week 39
Week 40
Week 41
Week 42
Week 43
Week 44
Week 45
Week 46
Week 47
Week 26
Week 27
Week 28
Week 29
Week 30
Week 31
Week 32
Week 33
Week 34
Week 35
Week 36
Week 37
Week 38
Week 39
Week 40
Week 41
Week 42
Week 43
Week 44
Week 45
Week 46
Week 47
2020 2019 2020 2019
Week 41 – w/c 1 October 2020. Week 47 – w/c 18 November 2020
12Performance vs. Benchmark
Continuing to outperform the UK hotel market and MSE sector since re-opening
% point outperformance vs MSE competitive segment
7.6%
7.3%
6.4% 6.6%
5.7%
5.3%
4.1%
3.3% 3.4% 3.5%
0.7%
0.3%
P7 P8 P9 P10
UK MSE London MSE Region MSE
Source: STR
P7 25/6 – 29/7. P8 30/7 – 26/8. P9 27/8 – 23/9. P10 24/9 – 28/10
13Cashflow Update – 1 October to 18 November (by key element)
Cash position remains resilient
Group Cashflow from 1 October 2020 to 18 November 2020
(17.2)
37.4
(11.6)
(12.2)
(2.2) 0.6 (1.0)
(6.3) 5.2
£m
71.5
64.3
Cash at 30 Revenue less Wages (net of Operating costs Net rent (1) Capex (1)(3) Interest (4) VAT Receipt Corp Tax Other (5) Cash at 11
September 2020 refunds (1) furlough reclaims) (1)(2) November 2020
(1) Including VAT
(2) Mainly relating to prior period operating costs paid in line with standard payment terms
(3) Mainly relating to maintenance and new development
(4) Interest on the SSN and RCF/LOC facility
(5) Spain, Ireland and Management Contracts
14Net Debt and Leverage
New facilities strengthen liquidity
Debt (£m) Liquidity / Financial Ratios
Cash on Balance Sheet: £64.3m 18 November, pro-
£m 18-Nov Pro-forma forma for term loan refinancing (inc. interest and fees due
on repayment of the SSRCF) and equity funding
Cash and Cash Equivalents 64.3 122.4 Pre-existing RCF: £40m (fully drawn). Revised covenant
terms in place with a minimum liquidity covenant of £10m
Pre existing RCF 40.0 40.0 until June 2021
New RCF: new £60m agreement on 20 Apr 2020, £30m
New RCF 30.6 - currently drawn, refinancing signed 18 November
New Super Senior Term Facility: new £60m facility due
New Super Senior Term Facility - 61.9
to fund 1 Dec. Maturity extended to July 2024, no
scheduled repayment of principal before maturity with
FRNs @ L + 5.375% 440.0 440.0 initial fees deferred to Dec 2021 and proportion of interest
PIK’d at group’s election
Senior Secured Debt 510.6 541.9 Letter of Credit Facility: £30m (£24.3m utilised)
Finance leases 14.4 14.4 Further equity funding
Agreement for further equity funding of up to £40m to
Total Third Party Indebtedness 525.0 556.3
be provided by shareholders or affiliates thereof
Note: New RCF and New Super Senior Term Facility include deferred
£10m received 24 August 2020 with remaining £30m of
fees of £0.6m and £1.9m respectively additional equity being injected by 2 December 2020
15Outlook
Considerations
16Outlook Considerations
Assessing potential amid material uncertainty
Network: strong and diverse network retained
- assets representing over 98% of 2019 UK hotel EBITDA(1)
Revenue: UK Market forecasts suggest recovery in 2021 to c.20-30% behind 2019 levels
- regional restrictions likely to remain a factor in short-term
- MS&E sector expected to be more resilient – domestic travel focus, value proposition, lower costs
- faster return to business travel, events and leisure staycations possible positive catalysts
Costs: Optimising largely fixed cost base
- rent continues to benefit from temporary reductions
- options for use of JRS to end March
- reduced variable costs according to occupancy
Capex: Expecting £30-40m in 2021 to maintain strong current position
- well-invested estate with low customer use in 2020
- timing of capex on new openings remains uncertain
Liquidity: solid cash position, new facilities and equity injection
1. 2019 UK hotel EBITDA is EBITDA (adjusted), excluding Spain, Ireland, management contracts and central and marketing costs and the EBITDA of the one hotel lease surrendered in July 2020
17Network Outlook
Pre Lease Breaks
Number of UK hotels(2):
580
Number of rooms:
43,886
Post Lease Breaks
Number of UK hotels(2):
563
Number of rooms:
42,556
2019 UK Hotel EBITDA(1)
retained:
> 98%
1. 2019 UK hotel EBITDA is EBITDA (adjusted), excluding Spain, Ireland,
management contracts and central and marketing costs and the EBITDA of the
one hotel lease surrendered in July 2020
2. UK hotels at 20 November 2020, including 10 management contracts, excluding
Ireland franchises.
18Revenue Outlook
Emerging recovery expected and MSE segment to benefit – but wide range of possible outcomes
PwC Market Forecasts for UK hotels imply total revenues c.30% behind 2019 levels
- Restrictions to remain
- Likely even impact on occupancy and rate
- London RevPAR c. 50% behind 2019 levels
- Regions RevPAR c. 25% behind 2019 levels
MSE segment has been outperforming total market consistently through 2020
- domestic focus, business/leisure mix, lower price point, value proposition
- consistent c.10pt gap in performance
TVL has been outperforming the MSE segment when fully open
- consistent 2-4pt outperformance – although affected by London/Regional/independent mix
Wide range of outcomes possible
19Revenue Outlook - Market
MSE segment has been demonstrating resilience and Travelodge has been outperforming
2020 Revenue as a percentage of 2019 revenue - UK MS&E versus Total UK market
MS&E UK Total Market UK
70%
62%
60% 54%
50% 51%
48% 48% 47% 47%
50% 44% 45% 44%
42% 42% 42%
2020 % of 2019
40% 39%
35% 37%
40% 34% 34% 34% 33% 34%
31% 31% 30% 32% 32%
30%
30%
19%
20%
10%
0%
Wk 32 Wk 33 Wk 34 Wk 35 Wk 36 Wk 37 Wk 38 Wk 39 WK 40 WK 41 WK 42 WK 43 WK 44 WK 45 WK 46
Week Commencing
Travelodge outperformance vs UK MSE
6.4%
Hotels re-opening
4.1%
3.4%
0.7%
Source: STR
P7 P8 P9 P10
20Revenue Outlook - Impact of Restrictions
Restrictions have led to wide range of impacts on sales
Normalised 2019 sales per week £10-16m
Post re-opening 3 Tier Lockdown Nov lockdown
Full closure £Cost Outlook
Temporary rent reductions will benefit largely fixed operating cost base
Operating costs dominated by rent and 2021 operating cost movements
other property costs (UK)
Run-rate weekly costs of £8-12m
Year ended 31 December 2019
Property costs
UK Hotel Wages
23% - Rent expected to be £175-185m depending on RPI/CPI
impact on rent reviews and timing of new openings
- Business rates holiday in Q1 2021 – c. £3m per month
UK Property
Costs
47% UK Hotel Wages
- NLW increases in April 2021
- JRS benefit to March 2021, depending on utilisation
and level of rebate available
Other
30%
Other
- Typically variable with occupancy
- Occupancy will scale in line with recovery
c. 50% of operating costs are rent and
property-related
22Capex
Expecting to maintain core investment
Strong starting point
- historic spend of c.7-8% of revenues on capex over the cycle
- well-invested base
- c. £40m invested in 2020, including c. £11m on refit and property projects which was committed before Covid-19
Expecting c.£30-40m in capex for full year to maintain core position
Will keep under constant review according to trading and opportunities
23Liquidity
Strengthened position to take forward to year end and first quarter
Liquidity
- cash of £64m as at 18 November
- term facility due to fully fund by 1 December, £30m balance to be received
- additional £30m equity due to be injected by 2 December
Trading performance is highly operationally geared
Expected average weekly costs of c.£8-12m depending on seasonality, occupancy and government support schemes
Cashflow phasing remains important
- advance rent payments at or around month-end (monthly or quarterly depending on hotel category), all hotels
return to quarterly in advance from the 25 December 2021 quarter date
- salaried payroll at end of month, hourly paid every 4 weeks
- end of month vendor run with operating costs and capex paid in arrears
Benefiting from
- PIK ability on portion of new £60m term loan
- no fee paid on new £60m term loan until after 1 January 2022
24Summary
Navigating the Material Uncertainty of Covid-19
Clear and significant impact of Covid-19 on the year-to-date
Decisive action taken to optimise trading and preserve liquidity
Resilient sales and strong outperformance when hotels have been permitted to open
Approaching the new year with a strengthened position
- retained a large and diversified network
- positioned to benefit from recovery as it emerges – domestic travel focus, business/leisure mix
- benefiting from temporary rent reductions
- new £60m super senior term facility signed on 18 November 2020, due to be fully funded on 1 December
- further £30m equity injection to complete by 2 December 2020
Material uncertainty still remains and a long road ahead - but starting to move forward
25Q&A 26
Appendices

    27
Company Overview
Strength through brand, scale and operational expertise
Who We Are Where We Are (as at 20 November 2020)
UK’s second largest hotel brand based on number of hotels and rooms United Kingdom International
Positioned in the attractive value segment with 578 hotels (as at 20 76 Hotels 5 Hotels
November 2020) and serving 19m business and leisure customers 9,423 Rooms 621 Rooms
London Spain 1% of total
22% of total
Well invested modernised hotel portfolio Rooms Rooms
Well balanced approximately even business / leisure customer split 487 Hotels 10 Hotels
33,133 Rooms 833 Rooms
Almost 90% booking direct, with c. 80% through own websites Regions3 Ireland/NI4
75% of total 2% of total
Rooms Rooms
Low upfront capex leasehold model
Key Statistics (FY2019)
Hotels 588
Rooms 44,832
Occupancy¹ 80.6%
ADR¹ £51.82
RevPAR¹ £41.75
Revenue £727.9m
EBITDAR £337.8m
EBITDA £129.1m
Rent Cover2 1.6x
1. Occupancy, ADR and RevPAR for Travelodge UK leased Hotels only.
2. Represents the ratio of EBITDAR to net external rent payable.
3. Includes 10 hotels operated under management contracts.
4. Operations in island of Ireland under a master franchise.
28Track Record of Class-Leading Performance
Leading brand at low cost driving outperformance and growth
Leading segment brand recognition in the UK Class leading low cost model
(1)
93.6 93.3 Resilient Hotel EBITDAR Margins
58.4% 57.7% 56.3% 55.2% 55.4%
75.5
72.2
2015 2016 2017 2018 2019
Source: YouGov BrandIndex, August 2020 - 12 week rolling average
Continued above market RevPAR growth Strong track record of delivering financial success
Revenue (£m)(3) EBITDA (£m)(3)
Annual RevPar Growth(2)
11.7% £728
7.2% £129
£433
2.5% 2.9% 2.2% 3.2%
1.4% 0.9% 0.3%
£41
2015 2016 2017 2018 2019(2.0)%
Travelodge Midscale & Economy Segment 2013 2019 2013 2019
1. UK hotels, EBITDA (adjusted), before rent, before central cost allocations and before IFRS16UK hotels
2. UK hotels RevPAR growth (Source: STR Research Midscale & Economy Sector)
3. Group financial data 29 29Key Strengths
Diversified network, balanced customer mix and direct distribution focus
Well invested diversified network
Capital investment
of 7-8% of c. 45% Central (2)
revenues (1) c. 55% Greater London (2)
London
Regions
c. 20% Major Markets (2)
c. 80% Other (2)
1. 2013-2019
2. Based on rooms
Diverse Customer Mix Market leading direct distribution model
Indirect
OTA’s represent
less than 1% of
total revenue
Business
Leisure
Direct
Q3 YTD 2020
Q3 YTD 2020
30Company Voluntary Arrangement 2020
Reminder of Key Terms
CVA approved by creditors on 19 June 2020
Temporary rent reductions of approximately £140m on full estate from March 2020 to December 2021
Reminder of key terms:
No hotels closed
Temporary rent reductions in Cat B, C1 and C2 from March 2020 to December 2021
Move to monthly rather than quarterly rents for Cat B to the end of 2021
Cat B, C1 and C2 temporary options to terminate leases (Cat B expired, Cat C expires 31 Dec 2021)
Additional lease extension options for compromised landlords
31IFRS16 Impact on YTD to Sept 2020 Results
Analysis of impact
Before IFRS 16
Nine months ended 30 September 2020 (£m) Statutory Income statement
IFRS16 (1) impact
EBITDA increased by £106.5m as rent is not charged to the consolidated income
EBITDAR 55.6 - 55.6 statement
Depreciation and amortisation (including the rent adjustment) increased by
Net rent payable (104.2) 106.5 2.3
£20.8m due to charges relating to the ‘right of use’ asset
Other income 0.3 - 0.3 Financing costs increased by £127.2m relating to notional charges relating to
lease liabilities
EBITDA (48.3) (2) 106.5 58.2
(3)
Loss for the period increases by £44.8m to £222.6m due to the net impact of rent
Depreciation and amortisation (inc rent
(97.1) (20.8) (117.9) being replaced by depreciation and financing costs
adjustment)
Operating profit/(loss) (before exceptional Balance sheet
(145.4) 85.7 (59.7)
items) The impact of the CVA on category B, C1 and C2 leases has been treated as lease
Net finance income and costs (37.6) (127.2) (164.8) modifications, reflecting the impact of the rent reductions as well as the
reassessment of discount rates as at June 2020, driving the majority of the following
Income tax 3.5 (3.5) - key balance sheet movements:
IFRS16 ‘right of use’ asset opening balance of £2.5bn reduced by £0.4bn to
Loss for the period (before exceptional items) (179.5) (45.0) (224.5)
£2.1bn
Non-underlying items 1.7 0.2 1.9 IFRS16 lease liability opening balance of £2.6bn reduced by £0.3bn to £2.3bn
Loss for the period (after exceptional items) (177.8) (44.8) (222.6)
1. Before IFRS 16 - In order to facilitate the comparability of the underlying business and clarify the calculation of non-IFRS Alternative Performance Measures, including EBITDA (adjusted), additional columns have
been added to reflect the position in line with previous accounting principles.
2. EBITDA (adjusted) = Earnings before interest, tax, depreciation and amortisation, and before rent adjustment, non-underlying items and reflective of the position in line with the accounting principles applicable to
the previous year for purposes of comparability (before IFRS 16). This measure reflects the rent reductions following the CVA which completed on 19 June 2020, recognised in line with the cash benefit. Non-
underlying items have been removed as they relate to non-recurring, one-off items.
3. EBITDA = Earnings before interest, tax, depreciation, amortisation and non-underlying items.
32Navigating Through the Largest Ever Impact on Global Hospitality
Decisive action taken during first lockdown
Company actions Government support
All discretionary spend stopped Used Job Retention Scheme to facilitate
furlough > 8,000 staff
Non-essential capex deferred
Business rates relief to April 2021
Pay reductions
Deferral of Q2 2020 VAT
No pay rises other than NLW
Fully drew down on pre-existing £40m RCF
New £60m SSRCF entered into on 20 April
2020
New equity committed of up to £40m, initial
£10m injected on 24 August 2020
CVA approved, facilitating temporary rent
reductions
33Navigating Through the Largest Ever Impact on Global Hospitality
Good trading following re-opening but second lockdown impacting trading conditions
Re-opening hotels Supporting liquidity
All available hotels re-opened by mid-August Further cost reductions implemented
TL Protect + launched New £60m term loan agreement on 18
November to refinance the £60m SSRCF
Good early trading over the summer period
Further £30m of new equity to be injected by
Continued to outperform the market 2 December 2020
Second lockdown announced 31 October
impacting trading
No leisure stays permitted but trading over 200
hotels for business travel and key workers
Closures of all bar cafes
Hotels expected to re-open in line with demand
34You can also read