Q1 FY20 Supplemental Deck - February 6, 2020 - Mohegan Gaming ...
←
→
Page content transcription
If your browser does not render page correctly, please read the page content below

Q1 FY20 Supplemental Deck
       February 6, 2020

                            1
Disclosures
This presentation contains “forward-looking statements” within the meaning of the Private Securities Litigation Reform Act of 1995, Section 27A of the Securities Act of 1933, as
amended, and Section 21E of the Securities Exchange Act of 1934, as amended. Certain statements contained in this presentation, including those that express a belief, expectation or
intention, as well as those that are not statements of historical fact, are forward-looking statements within the meaning of the federal securities laws and as such are based upon the
current beliefs of Mohegan Gaming & Entertainment (“MGE”, “we”, “us”, “our”, or the “Company”) as to the outcome and timing of future events. There can be no assurance that the
expectations, conclusions or beliefs expressed in any forward-looking statements will in fact occur. Examples of forward looking statements in this presentation include, but are not
limited to, statements regarding: (i) the earnings impact of our investments; (ii) improvements in our new business production; (iii) future M&A activity; (iv) global brand recognition;
(v) the leveraging of internal resources across divisions; (vi) our ability to stay in front of improvements in technology; (vii) growth drivers and expected levels of our organic growth;
(viii) our management team; (ix) our balance sheet; and (x) our return to shareholders.

 Forward-looking statements are generally identifiable by use of forward-looking terminology such as “may,” “will,” “should,” “potential,” “intend” “expect,” “seek,” “anticipate,”
“estimate,” “believe,” “could,” “project,” “predict,” “hypothetical,” “continue,” “future” or other similar words or expressions. All forward-looking statements included in this
presentation are based upon information available to the Company on the date hereof and the Company is under no duty to update any of the forward-looking statements after the date of
this presentation to conform these statements to actual results. The forward-looking statements involve a number of significant risks and uncertainties. Factors that could have a material
adverse effect on the Company’s operations and future prospects are set forth in the Company’s Annual Report on Form 10-K for the fiscal year ended December 31, 2017 including the
sections entitled “Risk Factors” contained therein. The factors set forth in the Risk Factors section and otherwise described in the Company’s filings with SEC could cause the
Company’s actual results to differ significantly from those contained in any forward-looking statement contained in this presentation. The Company does not guarantee that the
assumptions underlying such forward-looking statements are free from errors.

Should one or more of these risks or uncertainties occur, or should underlying assumptions prove incorrect, the Company’s business, financial condition, liquidity, cash flows and results
could differ materially from those expressed in any forward-looking statement. While forward-looking statements reflect our good faith beliefs, they are not guarantees of future
performance. Any forward-looking statement speaks only as of the date on which it is made. New risks and uncertainties arise over time, and it is not possible for us to predict the
occurrence of those matters or the manner in which they may affect us. We disclaim any obligation to publicly update or revise any forward-looking statement to reflect changes in
underlying assumptions or factors, of new information, data or methods, future events or other changes. Use caution in relying on past forward-looking statements, which were based on
results and trends at the time they were made, to anticipate future results or trends.

This presentation includes Adjusted EBITDA and other non-GAAP financial measures. The non-GAAP measures provided herein may not be directly comparable to similar measures
used by other companies in MGE's industry, as other companies may define such measures differently. The non-GAAP measures presented herein are not measurements of financial
performance under GAAP, and should not be considered as alternatives to, and should only be considered together with, MGE's financial results in accordance with GAAP. The
Authority does not consider these non-GAAP financial measures to be a substitute for, or superior to, the information provided by GAAP financial results.

                                                                                                                                                                                              2
Quarterly Highlights

                       3
MGE Q1 FY20 Financial Performance
Mohegan Sun                                                                                         Q1 Financial Performance
• YOY results reflect impact of Encore Boston Harbor’s second quarter of                                     Quarter Ended          Quarter Ended
  operations                                                                ($ in thousands)                  12/31/2019             12/31/2018        Year/Year Change
                                                                            Mohegan Sun
                                                                            Net Revenues                 $           243,335    $           252,679               (3.7%)
Mohegan Sun Pocono                                                          Adjusted EBITDA                           65,098                 68,549               (5.0%)
• Sportsbook & iGaming generated $1.1M of new gaming revenue                EBITDA Margin                             26.8%                  27.1%                (0.4%)
• Sportsbook driving additional table games and F&B revenue
                                                                            Mohegan Sun Pocono

MGE Niagara Resorts                                                         Net Revenues                 $            61,954    $            60,791                1.9%
                                                                            Adjusted EBITDA                           11,209                 10,608                5.7%
• Gaming volumes slightly lower than anticipated
                                                                            EBITDA Margin                             18.1%                  17.4%                 0.6%
• Results negatively impacted by Niagara Falls Entertainment Center delay
• Table games hold lower than anticipated, a $6.0M EBITDA reduction         MGE Niagara Resorts
                                                                            Net Revenues                 $            84,974    $               -                100.0%
Management, Development and Other                                           Adjusted EBITDA                            3,811                    -                100.0%
• Cowlitz management fees $8.1M                                             EBITDA Margin                               4.5%                    -                100.0%
• Resorts management fees $0.4M
                                                                            Management, Development and Other
• MGE Niagara management fees $0.2M
                                                                            Net Revenues                 $             9,012    $             5,712               57.8%
                                                                            Adjusted EBITDA                            2,130                   159              1239.6%
Corporate                                                                   EBITDA Margin                             23.6%                    2.8%               20.9%
• Net revenue decrease driven by lower Play 4 Fun revenue
                                                                            Corporate

Total MGE                                                                   Net Revenues                 $              108     $              378               (71.4%)
                                                                            Adjusted EBITDA                           (7,147)                (7,450)               4.1%
• YOY increases attributed to addition of MGE Niagara Resorts
                                                                            EBITDA Margin                              N.M.                   N.M.                 N.M.

                                                                            Total MGE 1
                                                                            Net Revenues                 $           399,052    $           319,500               24.9%
                                                                            Adjusted EBITDA                           75,082                 71,866                4.5%
                    1   Includes inter-segment results                      EBITDA Margin                             18.8%                  22.5%                (3.7%)
                                                                                                                                                                           5
Quarterly Highlights – Management, Development and Other
                         Core management businesses continue to grow

                                        For the Three Months Ended
(in thousands)           December 31, 2019      December 31, 2018         Variance        Percentage Variance
Net Revenues             $            9,012    $             5,712    $          3,300                 57.8%
Income from Operations   $             (918) $                (413)   $           (505)               122.3%
Adjusted EBITDA          $            2,130    $               159    $          1,971                  N.M.

Net Revenues for the quarter ended December 31, 2019, reflects:
• The increase is primarily driven by higher management fees from ilani, as a result of continued revenue
  and EBITDA growth at the property
• MGE recognized $8.1M of ilani management fees in the quarter compared to $4.9M the prior year

Adjusted EBITDA for the quarter ended December 31, 2019 reflects:
• An increase of $2.0M over prior year, primarily related to higher management fees from ilani
• EBITDA performance also reflects higher expenses associated with ongoing domestic and international
  development efforts

                                                                                                                6
Quarterly Highlights – MGE Corporate
                           Improved EBITDA driven by cost initiatives

                                          For the Three Months Ended
(in thousands)            December 31, 2019       December 31, 2018       Variance        Percentage Variance
Net Revenues             $               108     $               378  $           (270)               (71.4%)
Loss from Operations     $            (7,164) $               (7,472) $            308                   4.1%
Adjusted EBITDA          $            (7,147) $               (7,450) $            303                   4.1%

Net Revenues for the quarter ended December 31, 2019, reflects:
• The decrease in revenues is attributed to a decline in Play 4 Fun revenue

Adjusted EBITDA for the quarter ended December 31, 2019 reflects:
• Improvements within Adjusted EBITDA were driven by better overall labor expense control along with
  lower consulting fees

                                                                                                                7
Quarterly Highlights – MGE Consolidated
Committed to capital reinvestment in the face of competitive pressure

                            Capital Expenditures
                            Fiscal Quarter Ended   Remaining Forecasted
   (in millions)             December 31, 2019       Fiscal Year 2020
   Mohegan Sun
      Maintenance            $               3.4   $              18.0
      Development                            2.4                  12.9
           Subtotal                          5.8                  30.9
   Mohegan Sun Pocono
      Maintenance                            0.7                   4.6
      Development                            0.3                   0.7
           Subtotal                          1.0                   5.3
   Other
      MGE Niagara Casinos                    7.5                  18.3
      Project Inspire                       20.0                 298.6
      Corporate                              -                     1.9
           Subtotal                         27.5                 318.8
           Total             $              34.3   $             355.0

                                                                          8
Bridge Summary for Normalized EBITDA
                                                                               Adj for Normalized
($ in thousands)                                         Reported Results                                Weather Impact     Normalized Results
                                                                                   Table Hold
                                                                       1Q20
Net Revenues       Mohegan Sun                       $              243,335    $            3,493    $              2,366   $           249,194
                   Mohegan Sun Pocono                                61,954                  (198)                    776                62,532
                   MGE Niagara Casinos                               84,974                 5,974                   2,054                93,002
                   Management, Development & Other                    9,012                   -                       -                   9,012
                   Corporate                                            108                   -                       -                     108
                   Inter-segment                                       (331)                  -                       -                    (331)
                   Total                             $             399,052     $           9,269     $             5,196    $          413,517
EBITDA             Mohegan Sun                       $               65,098    $            3,493    $              1,609   $            70,200
                   Mohegan Sun Pocono                                11,209                  (166)                    367                11,410
                   MGE Niagara Casinos                                3,811                 5,974                   1,100                10,885
                   Management, Development & Other                    2,130                   -                       -                   2,130
                   Corporate                                         (7,147)                  -                       -                  (7,147)
                   Inter-segment                                        (19)                  -                       -                     (19)
                   Total                             $              75,082     $           9,301     $             3,076    $           87,459
                   Margin %                                          18.8%                                                               21.2%
                                                                       1Q19
Net Revenues       Mohegan Sun                       $              252,679    $                76   $               813    $           253,568
                   Mohegan Sun Pocono                                60,791                   (74)                   329                 61,046
                   MGE Niagara Casinos                                  -                     -                       -                     -
                   Management, Development & Other                    5,712                   -                       -                   5,712
                   Corporate                                            378                   -                       -                     378
                   Inter-segment                                        (60)                  -                       -                     (60)
                   Total                             $             319,500     $                 2   $             1,142    $          320,644
EBITDA             Mohegan Sun                       $               68,549    $                76   $               619    $            69,244
                   Mohegan Sun Pocono                                10,608                   (62)                   166                 10,712
                   MGE Niagara Casinos                                  -                     -                       -                     -
                   Management, Development & Other                      159                   -                       -                     159
                   Corporate                                         (7,450)                  -                       -                  (7,450)
                   Inter-segment                                        -                     -                       -                     -
                   Total                             $              71,866     $               14    $               785    $           72,665
                   Margin %                                          22.5%                                                               22.7%
                                                                                                                                                   9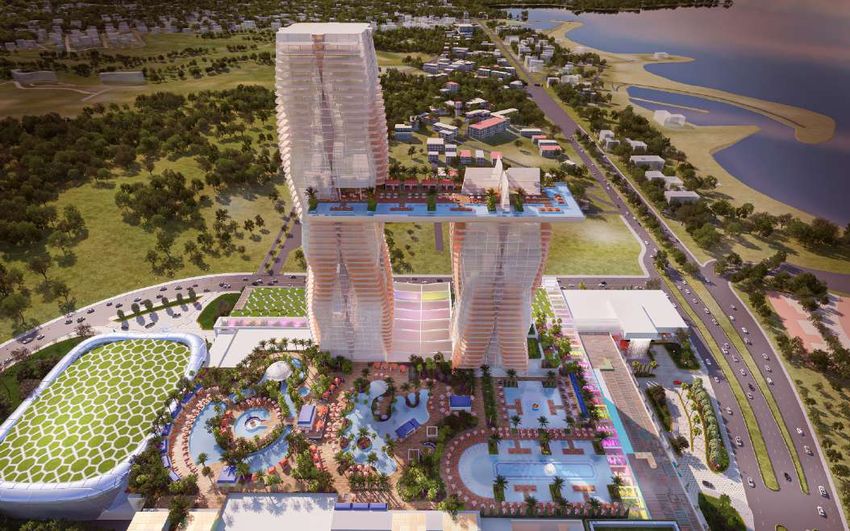
Quarterly Highlights – MGE Consolidated
Operational performance in core properties remains stable despite incremental competition

                                                     Historical Net Revenues

($ in millions)

$500
                                                                                                              $414   $399
$400
                                $346   $357                         $343   $343                        $348
           $322   $330                        $328    $329                        $320   $308                               MGE Niagara
$300                                                                                                   $326   $323   $314

$200

$100

   $0
             Q1   Q2            Q3     Q4     Q1       Q2           Q3     Q4     Q1     Q2            Q3     Q4      Q1
                         FY17                                FY18                               FY19                 FY20

                                                                                                                                          10
MGE Total Leverage Ratio
MGE’s Debt to EBITDA ratio is inline with the US regional industry
operators average following the addition of Niagara
Total Restricted Debt / Covenant Adjusted EBITDA
6.50x
Industry Average
6.00x
5.77x
5.54x
5.50x 5.37x
5.27x 5.32x 5.26x
5.20x
5.06x 5.11x 5.02x
4.95x Adjusted for
5.00x 4.93x 4.80x 4.78x normalized LTM table
4.75x 4.77x 4.80x 4.73x hold at Mohegan Sun
4.65x 4.59x 4.63x 4.61x
4.50x
4.38x
Adjusted for $300M
equity investment in
4.00x Korea
3.50x
1 Restricted group leverage based on 2016 credit facility definition of total recourse debt/covenant adjusted EBITDA
2 US regional operators industry average includes US subsidiaries of Caesars Entertainment Corp., Boyd Gaming, Eldorado Resorts, Penn National and Red Rock Resorts as of the most
recent public filings, estimated pro forma for announced acquisitions and divestitures
SOURCE: Company financials and public filings 11Quarterly
Quarterly Highlights
Highlights –– Mohegan
Mohegan Sun
Sun
Trending better than many expected, with robust non-gaming driving performance
Gaming
• Table games hold was 19.1% vs. 19.9% in prior year
• Gaming revenues experienced a slight decline due to increased competition
• Free slot play was down 21.4% compared to prior year
• Continue to experience modest impact from Boston, as new management adapts to market. Catskills has ramped up
free slot play
• Increased spend per trip from slot patrons compared to prior year
Non-Gaming
• Non-gaming revenues increased by $0.9M or 1.1% over prior year
• F&B revenue declined 2.1% compared to prior year
• Hotel revenue increased 3.9%, driven by higher ADR and an increase in facility fees
• Entertainment revenue increased 7.1%, due to an increase in arena events. Headliners in the arena included Journey
and Twenty One Pilots
13Quarterly Highlights – Mohegan Sun
Meeting and convention growth and strategic expense control improving the bottom line
MICE
• The meeting/convention segment continues to perform well and generated guest room revenue of $3.4M
during the quarter
• Hosted the 2020 Miss America 2.0 Competition, which occurred over multiple nights in December. The event
was televised on NBC and provided brand exposure to a national, prime-time audience
• Entering 2020 with 39 confirmed events in the Earth Expo Center, a 25% increase over prior year. Room
nights associated with the events are projected at 33,250
Expenses
• Total operating expenses for the period were $178.2M compared to $185.1M in the prior year, representing a
favorable variance of $6.9M or 3.7%
• Labor and benefits decreased by $3.0M from prior year. The savings was attributed to having 210 fewer FTEs
during the period and reductions in other labor costs
• FTEs are at their lowest quarterly level since fiscal year 2000
• Marketing expenses increased by $0.2M or 0.6% as a result of costs related to hosting the 2020 Miss America
2.0 Competition. Excluding these costs, expenses were favorable $1.2M compared to prior year
14Quarterly Highlights – Mohegan Sun
Q1 table games hold inline with historical ranges
Historical Table Hold %
21%
20%
Historical Hold Trend 1
19%
18%
17%
16%
15%
14%
1Q14 2Q14 3Q14 4Q14 1Q15 2Q15 3Q15 4Q15 1Q16 2Q16 3Q16 4Q16 1Q17 2Q17 3Q17 4Q17 1Q18 2Q18 3Q18 4Q18 1Q19 2Q19 3Q19 4Q19 1Q20
1 Represents trend based on actual hold results
15Quarterly
Quarterly Highlights
Highlights –– Mohegan
Mohegan Sun
Sun
For the Three Months Ended
(in thousands) December 31, 2019 December 31, 2018 Variance Percentage Variance
Revenues:
Gaming $ 160,259 $ 170,482 $ (10,223) (6.0%)
Food and beverage 28,533 29,135 (602) (2.1%)
Hotel 22,048 21,220 828 3.9%
Retail, entertainment and other 32,495 31,842 653 2.1%
Net revenues $ 243,335 $ 252,679 $ (9,344) (3.7%)
Expenses:
Gaming $ 86,862 $ 90,455 $ (3,593) (4.0%)
Food and beverage 21,944 22,598 (654) (2.9%)
Hotel 9,332 9,152 180 2.0%
Retail, entertainment and other 19,652 20,517 (865) (4.2%)
Advertising, general and administrative 40,447 41,789 (1,342) (3.2%)
Depreciation and amortization 19,966 23,637 (3,671) (15.5%)
Other, net 67 468 (401) (85.7%)
Total expenses $ 198,270 $ 208,616 $ (10,346) (5.0%)
Income from operations $ 45,065 $ 44,063 $ 1,002 2.3%
Adjusted EBITDA $ 65,098 $ 68,549 $ (3,451) (5.0%)
16Quarterly
Quarterly Highlights
Highlights –– Mohegan
Mohegan Sun
Sun
For the Three Months Ended
(in thousands) December 31, 2019 December 31, 2018 Variance Percentage Variance
Slots:
Handle $ 1,618,815 $ 1,735,057 $ (116,242) (6.7%)
Gross revenues $ 133,396 $ 136,627 $ (3,231) (2.4%)
Net revenues $ 109,573 $ 112,147 $ (2,574) (2.3%)
Free promotional slot plays (1) $ 12,058 $ 15,344 $ (3,286) (21.4%)
Weighted average number of machines (in units) 4,124 4,420 (296) (6.7%)
Hold percentage (gross) 9.0% 8.8% 0.2% 2.6%
Hold percentage (net) 8.2% 7.9% 0.4% 4.7%
Win per unit per day (gross) (in dollars) $ 352 $ 336 $ 16 4.8%
Win per unit per day (net) (in dollars) $ 289 $ 276 $ 13 4.7%
Table Games:
Drop $ 456,564 $ 487,825 $ (31,261) (6.4%)
Gross revenues $ 87,135 $ 96,821 $ (9,686) (10.0%)
Net revenues $ 49,439 $ 56,980 $ (7,541) (13.2%)
Weighted average number of games (in units) 275 289 (14) (4.8%)
Hold percentage (gross) (2) 19.1% 19.9% (0.8%) (3.9%)
Hold percentage (net) (2) 10.8% 11.7% (0.9%) (7.3%)
Win per unit per day (gross) (in dollars) $ 2,948 $ 3,125 $ (177) (5.7%)
Win per unit per day (net) (in dollars) $ 1,956 $ 2,145 $ (189) (8.8%)
Poker:
Net revenues $ 757 $ 744 $ 13 1.7%
Weighted average number of tables (in units) 33 42 (9) (21.4%)
Win per unit per day (gross) (in dollars) $ 636 $ 445 $ 191 42.9%
Win per unit per day (net) (in dollars) $ 249 $ 193 $ 56 29.0%
1 Free promotional slot plays are included in slot handle but not reflected in slot revenues.
2 Table game hold percentage is relatively predictable over longer periods of time but can significantly fluctuate over shorter periods.
17Quarterly Highlights – Mohegan Sun
For the Three Months Ended
(in thousands) December 31, 2019 December 31, 2018 Variance Percentage Variance
Food and beverage:
Revenues $ 28,532 $ 29,135 $ (603) (2.1%)
Meals served 878 956 (78) (8.2%)
Average price per meal served (in dollars) $ 15.30 $ 15.73 $ (0.43) (2.7%)
Hotel:
Revenues $ 22,048 $ 21,220 $ 828 3.9%
Rooms occupied 137 137 - 0.0%
Occupancy rate 95.2% 95.2% 0.0% 0.0%
Average daily room rate (in dollars) $ 141 $ 139 $ 2 1.4%
Revenue per available room (in dollars) $ 134 $ 132 $ 2 1.5%
Retail, entertainment and other:
Revenues $ 32,496 $ 31,842 $ 654 2.1%
Arena events (in events) 39 30 9 30.0%
Arena tickets 257 207 50 24.2%
Average price per arena ticket (in dollars) $ 54.39 $ 60.58 $ (6.19) (10.2%)
18Hosted Miss America 2.0 in
December, which included a two-
hour live telecast with 3.6 million
viewers crowning Camille Schrier
of Virginia as Miss America 2020
Filmed in 2018, Mohegan Sun is
featured in Adam Sandler’s Uncut
Gems which was released in U.S.
theaters on December 13, 2019
19Michael Jordan's 23.Sportcafe is
being renovated and rebranded as
MJ23 Sports Bar & Grill and will
reopen in mid-February
Construction commenced on the
new Tao Restaurant at Mohegan
Sun opening in fall 2020
20Strategic Initiatives
We continue to evaluate all aspects of our operations for improvement
Gaming:
• Evaluating table games and slot mix to meet customer demand
Strategic partnerships:
• Tao Restaurant
• MJ23 Sports Bar & Grill
• Yale Hew Haven Health
New revenue generating opportunities:
• Assessing available space for best use
• Evaluating revenue centers for better yielding opportunities
Labor & Marketing:
• Workforce optimization
• Strategic marketing and advertising profitability initiatives
21FTEs by Fiscal Year – Since FY 2007
Continued focus on labor efficiency, helping to drive cash flow improvement
8,500
8,000
7,500
7,000
6,500
6,000
5,500
5,000
4,500
2007 2008 2009 2010 2011 2012 2013 2014 2015 2016 2017 2018 2019 2020
22Mohegan Gaming & Entertainment Properties
24
Quarterly Highlights – Mohegan Sun Pocono
Initial results from sports wagering and interactive gaming complement current operations

 • MSP delivered strong results for the quarter

 • Property EBITDA was $11.2M, an increase of $0.6M or 5.7% over prior year

 • MSP outperformed the NEPA slot market as the region saw slot volumes increase by 0.8%,
   while MSP grew 1.4%

 • Interactive gaming operations began on November 12th and are gaining traction

 • Unibet Sportsbook completed a successful first full quarter of operations

 • Non-gaming revenues increased 6.8% over prior year as a result of increased F&B and hotel
   revenues

 • Opened Tony Luke’s cheesesteak restaurant in January

                                                                                               25
Quarterly Highlights – Mohegan Sun Pocono
For the Three Months Ended
(in thousands) December 31, 2019 December 31, 2018 Variance Percentage Variance
Revenues:
Gaming $ 51,978 $ 51,453 $ 525 1.0%
Food and beverage 6,082 5,713 369 6.5%
Hotel 1,980 1,758 222 12.6%
Retail, entertainment and other 1,914 1,867 47 2.5%
Net revenues $ 61,954 $ 60,791 $ 1,163 1.9%
Expenses:
Gaming $ 38,162 $ 38,209 $ (47) (0.1%)
Food and beverage 3,999 3,849 150 3.9%
Hotel 683 651 32 4.9%
Retail, entertainment and other 316 245 71 29.0%
Advertising, general and administrative 7,585 7,229 356 4.9%
Depreciation and amortization 3,477 3,416 61 1.8%
Other, net (62) - (62) (100.0%)
Total expenses $ 54,160 $ 53,599 $ 561 1.0%
Income from operations $ 7,794 $ 7,192 $ 602 8.4%
Adjusted EBITDA $ 11,209 $ 10,608 $ 601 5.7%
26Quarterly Highlights – Mohegan Sun Pocono
For the Three Months Ended
(in thousands) December 31, 2019 December 31, 2018 Variance Percentage Variance
Slots:
Handle $ 583,013 $ 574,862 $ 8,151 1.4%
Gross revenues $ 58,698 $ 57,270 $ 1,428 2.5%
Net revenues $ 42,767 $ 43,620 $ (853) (2.0%)
Free promotional slot plays (1) $ 12,579 $ 10,435 $ 2,144 20.5%
Weighted average number of machines (in units) 1,963 2,324 (361) (15.5%)
Hold percentage (gross) 10.1% 10.0% 0.1% 1.0%
Hold percentage (net) 7.3% 7.6% (0.3%) (3.9%)
Win per unit per day (gross) (in dollars) $ 255 $ 219 $ 36 16.4%
Win per unit per day (net) (in dollars) $ 237 $ 204 $ 33 16.2%
Table Games:
Drop $ 42,825 $ 40,982 $ 1,843 4.5%
Gross revenues $ 9,161 $ 8,652 $ 509 5.9%
Net revenues $ 6,223 $ 5,680 $ 543 9.6%
Weighted average number of games (in units) 56 71 (15) (21.1%)
Hold percentage (gross) (2) 21.4% 21.1% 0.3% 1.4%
Hold percentage (net) (2) 14.5% 13.9% 0.6% 4.3%
Win per unit per day (gross) (in dollars) $ 1,792 $ 1,325 $ 467 35.2%
Win per unit per day (net) (in dollars) $ 1,217 $ 870 $ 347 39.9%
Poker:
Net revenues $ 462 $ 428 $ 34 7.9%
Weighted average number of tables (in units) 10 18 (8) (44.4%)
Win per unit per day (gross) (in dollars) $ 536 $ 279 $ 257 92.1%
Win per unit per day (net) (in dollars) $ 498 $ 259 $ 239 92.3%
1 Free promotional slot plays are included in slot handle but not reflected in slot revenues.
2 Table game hold percentage is relatively predictable over longer periods of time but can significantly fluctuate over shorter periods.
27Quarterly Highlights – Mohegan Sun Pocono
For the Three Months Ended
(in thousands) December 31, 2019 December 31, 2018 Variance Percentage Variance
Food and beverage:
Revenues $ 6,081 $ 5,713 $ 368 6.4%
Meals served 153 133 20 15.0%
Average price per meal served (in dollars) $ 18.73 $ 18.66 $ 0.07 0.4%
Hotel:
Revenues $ 1,980 $ 1,758 $ 222 12.6%
Rooms occupied 17 17 - 0.0%
Occupancy rate 79.0% 78.8% 0.2% 0.3%
Average daily room rate (in dollars) $ 101 $ 98 $ 3 3.2%
Revenue per available room (in dollars) $ 80 $ 77 $ 3 3.4%
Retail, entertainment and other:
Revenues $ 1,914 $ 1,867 $ 47 2.5%
28Quarterly
Quarterly Highlights
Highlights – Niagara
– Casino Niagara Properties
& Fallsview Casino Resort
Strategic asset performing inline with expectations
• MGE assumed control of the Niagara Bundle on June 11, 2019
• Revenue and EBITDA performance for the quarter reflect the impact of lower than expected table
hold, four weather impacted days, and the continued delay of the Niagara Falls Entertainment
Center (NFEC)
• Results reflect the impact of new competition offering table games in the Greater Toronto Area
(GTA) and GTA West markets, which commenced in August 2018. Impact of competition was
contemplated during the bidding process
• While table volumes declined, revenue per trip continues to grow across all segments
• Non-gaming revenues benefitted from improved hotel yielding strategies and a strong entertainment
calendar
30Quarterly
Quarterly Highlights
Highlights – Niagara
– Casino Niagara Properties
& Fallsview Casino Resort
For the Three Months Ended
(in thousands) December 31, 2019 December 31, 2018 Variance Percentage Variance
Revenues:
Gaming $ 52,032 $ - $ - -
Food and beverage 15,953 - - -
Hotel 3,563 - - -
Retail, entertainment and other 13,426 - - -
Net revenues $ 84,974 $ - $ - -
Expenses:
Gaming $ 32,164 $ - $ - -
Food and beverage 15,750 - - -
Hotel 1,827 - - -
Retail, entertainment and other 5,018 - - -
Advertising, general and administrative 26,404 - - -
Depreciation and amortization 5,054 - - -
Other, net 90 - - -
Total $ 86,307 $ - $ - -
Income from Operations $ (1,333) $ - $ - -
Adjusted EBITDA $ 3,811 $ - $ - -
31Niagara Falls
Entertainment
Centre
• 5,000 seat theater
• Pedestrian
bridge/walkway connects
to Fallsview Casino
Resort, driving visitation
• Expected to open in 2020
3233
Quarterly
                     Quarterly Highlights Highlights
                                          – ilani Casino Resort
                                 ilani performance exceeding expectations

• The property continues to perform above expectations
  and recorded its highest quarterly net revenue and
  EBITDAM since opening
• Net revenue and EBITDAM increased 22.0% and
  17.0%, respectively, over prior year
• The database continues to grow, increasing 23.4% over
  prior year
• Management Fees increased to $8.1M or $3.2M over
  prior year, the highest for a quarter since opening
• Construction of the 2,700 space structured parking
  garage and a 17,000 sq. ft. gaming expansion is
  underway with completion expected in fall of 2020
• Planning for a potential hotel expansion continues

                                                                            34
35
Quarterly Highlights – Resorts Casino
                          Property performing well despite increased competition

• EBITDAM was down $3.2M to a loss of $0.5M for the quarter
  attributed to a 300 basis point decline in table hold and volatility in
  high-end play
• Gaming revenues impacted by a shift in market share to the two newer
  properties
• Marketing spend remains aggressive due to the maturation of newer
  competitors’ marketing efforts
• Management fees earned by MGE in the quarter were approximately
  $0.4M

                                                                                   36
37
Quarterly Highlights – Paragon Casino Resort
                          Performance is improving despite intense competition

• The property experienced strong year over year
  EBITDA growth of 182.9%
• EBITDA margin grew from 4.7% in prior year to
  13.5% this quarter
• Strategic labor and marketing initiatives are improving
  the bottom line
• Guest and employee survey results remain very
  positive, despite focus on expense reduction

                                                                                 38
Development Updates
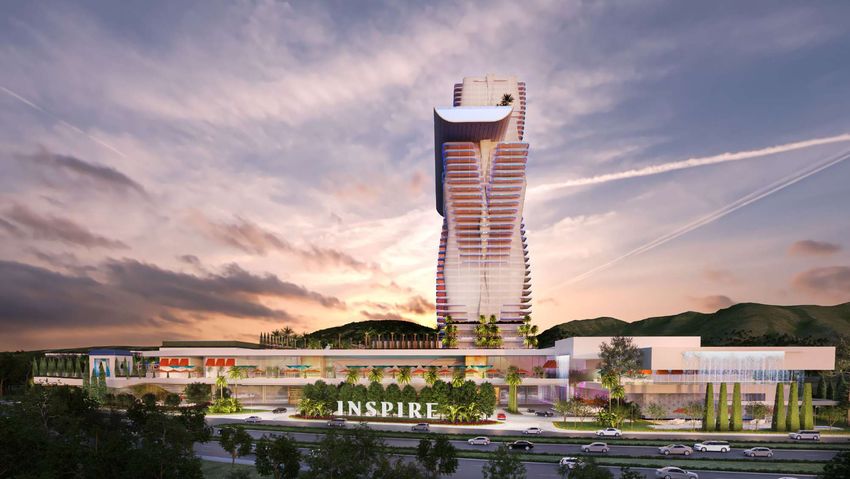
Inspire construction    progress
                    PHASE 1 (COMPLETION IN 2022) on time and on budget
                     PHASE 2 (COMPLETION IN 2025)
                     PHASE 3 (PLANNING IN PROGRESS)
                     PHASE 4 (PLANNING IN PROGRESS)

  TP1
704,915㎡

                                                                         41
PHASE 1A 2022
PHASE 1 (COMPLETION IN 2022)
PHASE 1B 2025
PHASE 2 (COMPLETION IN 2025)
PHASE 2
PHASE 3 (PLANNING IN PROGRESS) A Multi-Phased Project
PHASE 3
PHASE 2 PHASE
1B
PHASE 4 (PLANNING IN PROGRESS) with Vast Site Area for Scalability
PHASE 4
• Phase 1A includes a foreigner-only casino, 5-
star resort with over 1,248 rooms, suites, and
PHASE
1A villas, large-scale and unique F&B, retail and
PHASE 2 PHASE 2
entertainment offerings, a 15,000-seat indoor
arena, and large meeting/convention facility
TP1 PHASE 2 • A true destination resort, with a comprehensive
704,915㎡ set of family-based entertainment offerings to
PHASE 3
PHASE 4
attract and offer an unparalleled experience to
both foreign and domestic Korean visitors
PHASE 4 PHASE 4
PHASE 3 PHASE PHASE 3
3
PHASE 3
42Hotel MICE Casino Arena Retail . F&B . 5-star hotel towers Meeting & conference facilities 150 tables, 700 slots 15,000+ seat Entertainment with 1,248 rooms with Seoul’s largest ballroom and electronic games entertainment arena Luxury shopping mall
Phase 1B: Paramount
Theme Park 2025

• Phase 1B involves the construction
  of a theme park utilizing
  intellectual property of Paramount
  on over 404,659m2 of land area

• Tremendous local demand for
  theme park-type offerings –
  Korea’s Everland and Lotte World
    Korea’s first IP Theme Park
  ranked   #47Attractions
    40 Branded     and #49, respectively,
  as the most visited attractions           .

  globally, and the #6 and #7 most
  visited theme parks in Asia

• Introduce 40+ branded attractions,
  integrated retail, dining and
  entertainment to Korean consumers
                                                44
• Globally recognized motion picture library
• Given 25M+ Seoul local population, will transform
the Incheon area of South Korea into Asia’s next
major entertainment destination
• Paramount, Live Nation, and others represent both
the convergence and evolution of a new kind of
global integrated resort, the integrated entertainment
resort
45Market Highlights
• INSPIRE to be Korea and Northeast Asia’s first
true Integrated Entertainment Resort
• Ideally positioned within Korea and Northeast
Asia to capture growing tourism flows
• Broad appeal to both domestic and foreign visitors
• Partnership with Incheon Airport provides unique
support and competitiveness with 70M annual
visitors
Project Timeline
• 2022 Integrated Resort slated to open
• 2025 Paramount Theme Park slated to open
446• Property closed for rebranding on February 3rd
FPO
• Casino resort to open in fall of 2020
• 60,000 square-foot casino leased by MGE
• Momentum rewards & loyalty program
Additional property features include:
• 1,504 Chamber, Grand Chamber and Penthouse
suites by Hilton’s Elite Curio Collection
• New world-class restaurants, lounges and bars
• Over five acres of luxe outdoor spaces and pools
• The Joint: Existing 4,255-capacity venue
• 130,000 square feet of meeting and convention space
48• Bids were submitted by MGE and Hard Rock in
October 2019
• In January 2020, MGE was selected to advance after
meeting part 1 of the 3 part tender process
• MGE remains the only qualified bidder, though
disqualified bidder has submitted an appeal of the
recent tender decision
50• MGE has partnered with GEK TERNA, 35% equity
partner
• Construction could begin in 2021 with potential
opening in 2024
51Capitalization Summary
52Q1 FY20 Current Debt Summary
MGE and Mohegan Tribe remain committed to deleveraging while strategically diversifying
(in thousands) 12/31/2019 Coupon/Spread Maturity Rating 1
Credit Facility - Revolving $ 137,000 L + 3.75% 10/13/21 -
Credit Facility - Term Loan A 256,940 L + 3.75% 10/13/21 B1/B-
Credit Facility - Term Loan B 820,149 L + 4.00% 10/13/23 B1/B-
Mohegan Expo Credit Facility 29,657 L + 4.50% 4/1/22 -
Other 4,781 - - -
Total Restricted Senior Secured Debt 1,248,527
2016 7 7/8% Senior Unsecured Notes 500,000 7.875% 10/15/24 B3/CCC+
BIA Loans 32,375 L + 2.75% 10/1/23 -
Line of Credit 75 L + 3.25% 10/13/21 -
Total Restricted Debt 1,780,977
Redemption Note Payable 100,106 - 4/1/2024 -
Niagara Credit Facility 2 105,628 BA +2.75% - -
Niagara Convertible Debenture 2 30,728 3.50% 4/30/2040 -
Niagara Capital Leases 2 28,210 - - -
Total Debt $ 2,045,649
1
Corporate Rating: B2/B-
2
Niagara Debt in USD; USD/CAD = 1.3016 53You can also read