INVESTOR PRESENTATION - MARCH 2017 - StockDeck.io

Page created by Joshua Strickland
 
CONTINUE READING
INVESTOR PRESENTATION - MARCH 2017 - StockDeck.io
INVESTOR PRESENTATION
      MARCH 2017
INVESTOR PRESENTATION - MARCH 2017 - StockDeck.io
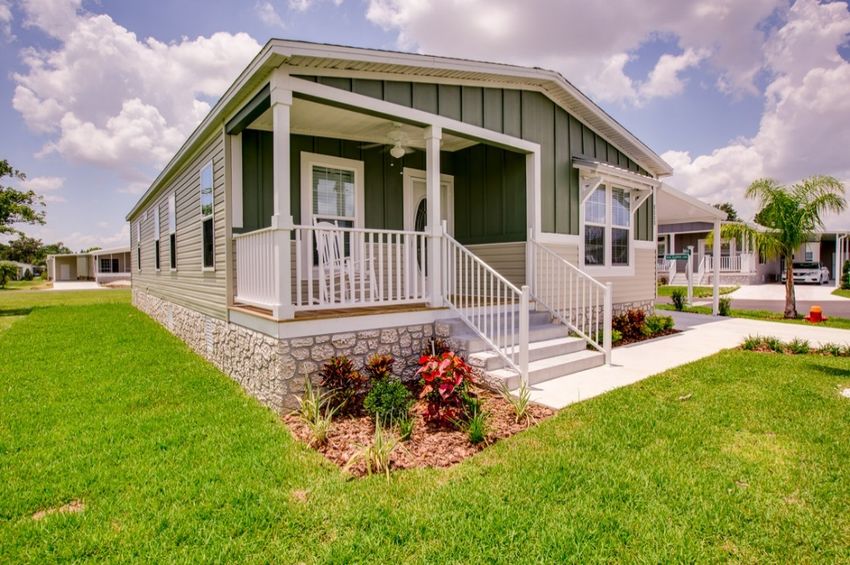
FORWARD-LOOKING STATEMENTS
This presentation has been prepared for informational purposes only from information supplied by Sun Communities, Inc. (the "Company") and from third-
party sources indicated herein. Such third-party information has not been independently verified. The Company makes no representation or warranty,
expressed or implied, as to the accuracy or completeness of such information.
This presentation contains various “forward-looking statements” within the meaning of the United States Securities Act of 1933, as amended, and the United
States Securities Exchange Act of 1934, as amended, and we intend that such forward-looking statements will be subject to the safe harbors created thereby.
For this purpose, any statements contained in this presentation that relate to expectations, beliefs, projections, future plans and strategies, trends or
prospective events or developments and similar expressions concerning matters that are not historical facts are deemed to be forward-looking statements.
Words such as “forecasts,” “intends,” “intend,” “intended,” “goal,” “estimate,” “estimates,” “expects,” “expect,” “expected,” “project,” “projected,”
“projections,” “plans,” “predicts,” “potential,” “seeks,” “anticipates,” “anticipated,” “should,” “could,” “may,” “will,” “designed to,” “foreseeable future,”
“believe,” “believes,” “scheduled,” “guidance” and similar expressions are intended to identify forward-looking statements, although not all forward looking
statements contain these words. These forward-looking statements reflect our current views with respect to future events and financial performance, but
involve known and unknown risks and uncertainties, both general and specific to the matters discussed in this presentation. These risks and uncertainties may
cause our actual results to be materially different from any future results expressed or implied by such forward-looking statements. In addition to the risks
disclosed under “Risk Factors” contained in our Annual Report on Form 10-K for the year ended December 31, 2016, and our other filings with the Securities
and Exchange Commission from time to time, such risks and uncertainties include but are not limited to:

   changes in general economic conditions, the real estate industry and the markets in which we operate;
   difficulties in our ability to evaluate, finance, complete and integrate acquisitions, developments and expansions successfully;
   our liquidity and refinancing demands;
   our ability to obtain or refinance maturing debt;
   our ability to maintain compliance with covenants contained in our debt facilities;
   availability of capital;
   changes in foreign currency exchange rates, specifically between the U.S. dollar and Canadian dollar;
   our failure to maintain effective internal control over financial reporting and disclosure controls and procedures;
   increases in interest rates and operating costs, including insurance premiums and real property taxes;
   risks related to natural disasters;
   general volatility of the capital markets and the market price of shares of our capital stock;
   our failure to maintain our status as a REIT;
   changes in real estate and zoning laws and regulations;
   legislative or regulatory changes, including changes to laws governing the taxation of REITs;
   litigation, judgments or settlements;
   our ability to maintain rental rates and occupancy levels;
   competitive market forces;
   the ability of manufactured home buyers to obtain financing; and
   the level of repossessions by manufactured home lenders.
Readers are cautioned not to place undue reliance on these forward-looking statements, which speak only as of the date the statement was made. We
undertake no obligation to publicly update or revise any forward-looking statements included in this presentation, whether as a result of new information,
future events, changes in our expectations or otherwise, except as required by law. Although we believe that the expectations reflected in the forward-looking
statements are reasonable, we cannot guarantee future results, levels of activity, performance or achievements. All written and oral forward-looking
statements attributable to us or persons acting on our behalf are qualified in their entirety by these cautionary statements.

                                                                                                                                                                 1
INVESTOR PRESENTATION - MARCH 2017 - StockDeck.io
SUN COMMUNITIES, INC.                                                                                                                               (NYSE: SUI)
Current Portfolio
As of December 31, 2016

                                                                                                                                              341 communities
                                                                                         4,868
                                                                                                                        1,521
                                      226
                                                                    426

                                                                                                                                                consisting of
               473
                                                                                548                          1,717
                                                                                        24,716                               680
                                                                                                                           149

                                                                                                                                          approximately 117,000
                                                                      413                               1,277
                                                                                              2,913
                     324                                                                                                3,002
                                                                                1,652
                                                                                                                        916
                                            2,483

                                                                                                                                           sites across 29 states
           5,375                                                          976                            698         1,215

                                                                                                        672
                                                                                        237
                            4,614

                                                                                               1,049
                                                                                                       418
                                                                                                                                                and Ontario
                                                         7,593

                                                                                                               42,823

    28 manufactured housing and recreational vehicle communities                                                                                                                      20,916
             87 recreational vehicle only communities                                                                                                                  37,210
                                                                                                                                                                                       (56%)
                                                                                                                                                                                      annual /
                                            226 manufactured housing only communities                                                             80,166              recreational    seasonal

                                                                                                                                                  manufactured             vehicle
                                                                                                                                                  housing sites               sites   16,294
                                                                                                                                                                                       (44%)
                                                                                                                                                                                      transient

            Source: Company Information. Refer to Sun Communities, Inc. Form 10-K and Supplemental for the year ended December 31, 2016 for additional information.                               2
INVESTOR PRESENTATION - MARCH 2017 - StockDeck.io
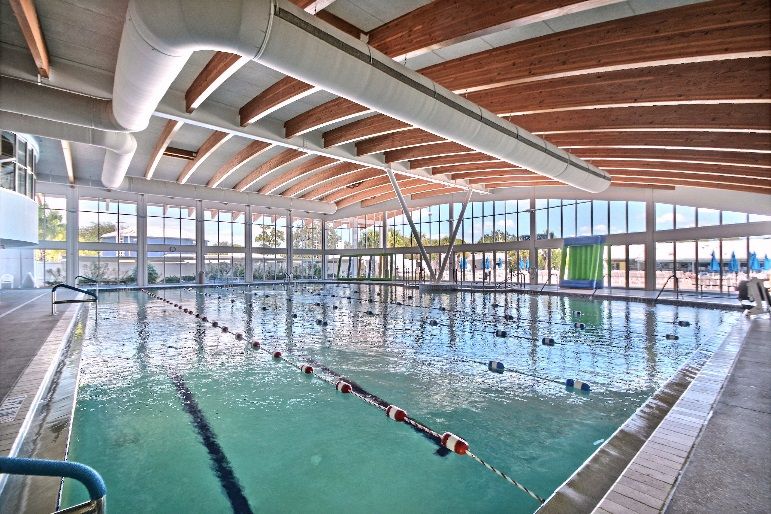
Q4 & 2016 YEAR-END HIGHLIGHTS
 Same-community NOI Growth                                                                                          Financial Data
                                                                                                                     (in millions except for EPS)
       2016 - 7.1%
                                                                                                                                                                          2016
       Q4 2016 - 9.1%                                                                                                                                                   Full Year         4Q 2016
 Rent Per Site                                                                                                        Revenue                                               $833.8         $218.6

       $489/site for MH & RV as of December 2016                                                                      EPS (Diluted)                                         $0.26          -$0.02

 Home Sales                                                                                                           FFO/Share (Diluted)                                   $3.79           $0.91
       2016 - 3,172 homes sold, increase of 27.8%
        compared to YE 2015                                                                                                                                                  San Pedro RV Resort & Marina
                                                                                                                                                                                           Islamorada, FL
       Q4 2016 - 762 homes sold, increase of 3.3%                                                                                                                                    Acquired June 2016
        compared to Q4 2015
 Acquisitions
       2016 - 111 MH & RV communities for
        $1.77 billion
       Q4 2016 - 3 RV communities for $13.2 million

          Source: Company Information. Refer to Sun Communities, Inc. Form 10-K and Supplemental for the year ended December 31, 2016 for additional information. Refer to
          information regarding non-GAAP financial measures in the attached Appendix.                                                                                                                       4
                                                                                                                                                                                                            3
INVESTOR PRESENTATION - MARCH 2017 - StockDeck.io
2017 GUIDANCE
Same-Community Portfolio Growth                                                                                 Other Considerations
Number of Communities: 231
   Income from Real Property: 5.6% - 5.8%                                                                             2017 Full-Year FFO/share: $4.16 - $4.24

   Real Estate Taxes: 6.0% - 6.3%                                                                                     Seasonality of FFO:
                                                                                                                        1Q17 2Q17 3Q17 4Q17
   Property Operating & Maintenance: 2.6% - 2.7%                                                                       25.5% 22.3% 28.3% 23.9%
   Property Operating Expenses: 3.4% - 3.6%                                                                           New Home Sales Volume: 470 - 485
   NOI: 6.4% - 6.8%                                                                                                   Pre-owned Home Sales Volume: 3,000 - 3,100
                                                                                                                       Increase in Revenue Producing Sites: 2,600 - 2,800
                                                                                                                       Total Portfolio WA Monthly Rent Increase: 3.6%
                                                        Wildwood Community
                                                                Sandwich, IL

                                                                                                                                                 Sherkston Shores Beach Resort & Campground
                                                                                                                                                                    Sherkston Shores, Ontario

           Source: Company Information. Refer to Sun Communities, Inc. Form 10-K and Supplemental for the year ended December 31, 2016 for additional information. Refer to information regarding non-GAAP
           financial measures in the attached Appendix.                                                                                                                                                      4
INVESTOR PRESENTATION - MARCH 2017 - StockDeck.io
BUILDING BLOCKS POSITION SUN FOR
SUSTAINABLE GROWTH
                                                                Premier owner and operator of manufactured home (MH) and recreational vehicle
Industry-Leading                                                 (RV) communities
                                                                Strong and cycle-tested record of operating, expanding and acquiring MH and RV
    Position                                                     communities dating back to 1975
                                                                Top customer service provided for our MH and RV residents

                                                                Weighted average monthly rent has historically increased 2-4% annually
                                                                Current MH occupancy of 95.2% with additional runway
Rent & Occupancy                                                ~10,000 transient RV sites available for conversion to annual/seasonal
                                                                Growth buoyed by favorable supply-demand dynamics for MH & RV communities

                                                                Low-risk way to add new sites in the highest demand communities in our portfolio
                                                                Long runway of approximately 10,600 sites available for expansion with expected
   Expansions                                                    delivery of 1,800 MH sites & 400 RV sites in 2017
                                                                ~300 expansion sites were filled in our same-community portfolio in 2016 and
                                                                 ~700 expected occupied expansion sites in 2017

                                                                Proven consolidator with $4.3 billion of acquisitions brought onto the Sun platform
                                                                 since 2011
                                                                Ability to leverage revenue opportunities while creating efficiencies for all
  Acquisitions                                                   on-boarded properties
                                                                High selectivity when analyzing new acquisition opportunities
                                                                Tried and true underwriting process lays groundwork for accretive acquisitions

       Source: Company Information. Refer to Sun Communities, Inc. Form 10-K and Supplemental for the year ended December 31, 2016 for additional information.   5
INVESTOR PRESENTATION - MARCH 2017 - StockDeck.io
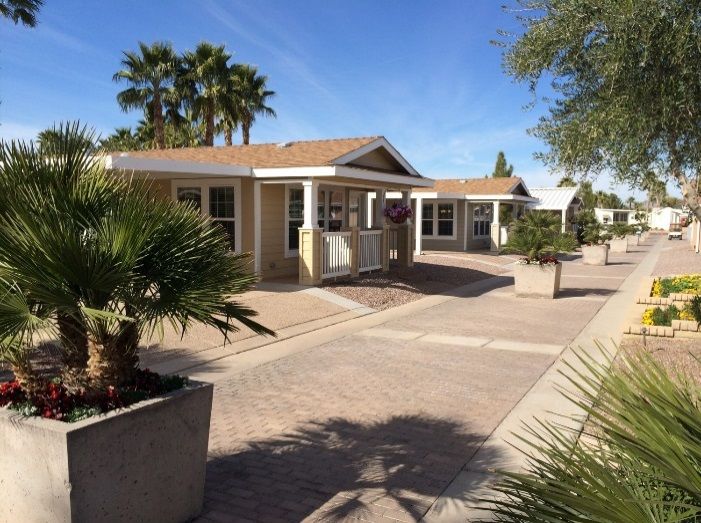
SUN’S FAVORABLE REVENUE DRIVERS
                                                                                               Sherkston Shores Beach Resort & Campground
   Cost to move a home ranges from $4K-10K,                                                                      Sherkston Shores, Ontario

    resulting in low move-out of homes
   Tenure of homes in our communities is ~43 years1
   Tenure of residents in our communities is ~13 years1

                                                                                                                         Jellystone Larkspur
    Sun’s Resident Move-out Trends                                                                                              Larkspur, CO

               Resident Resales                   Home Move-out

                                                                             5.9%     6.1%

    4.9%     5.1%                     4.9%                          5.0%
                        4.7%                        4.6%

      2.8%                                             2.6%           2.6%
               2.3%         2.3%          2.5%
                                                                               2.0%     2.0%

     2009     2010        2011          2012          2013           2014     2015     2016

               1 Source: Company information. Average since 2011.                                                                              6
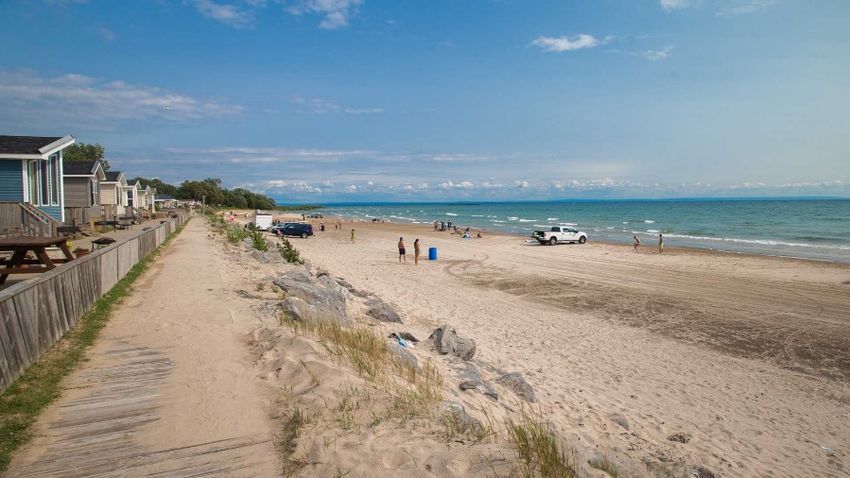
INVESTOR PRESENTATION - MARCH 2017 - StockDeck.io
STRONG SAME-
COMMUNITY GROWTH
   Low-annual resident turnover results in stability of income and occupancy
   Strong and consistent rental growth creates a stable revenue stream that is recession-resistant
   Positive NOI growth for 16 consecutive years
   Occupancy gains are a function of Sun’s integrated platform, which includes: leasing, sales, and financing

                 Same-Community NOI Growth (%)
                                                                                                                                                                               9.1%
                                                                                                                                                      7.7%
                                                                                                                                                                                                      7.1%
                                                                                                   5.5%                     5.9%
                   5.3% Average NOI Growth – 8 Years

                                                3.1%                      3.6%

                      0.7%

                       2009                     2010                      2011                     2012                      2013                     2014                      2015                  2016

             MH Weighted Average                                                                                                    Occupancy
             Monthly Rent per Site
                                                                                             $498
                                                                                  $481                                                                                                              95.9% 96.6%
                                                                      $461                                                                                                                  93.2%
                                                           $445
                                                $437
                                    $425                                                                                                                                       88.9%
                         $413                                                                                                                                       86.7%
              $404                                                                                                                                       85.8%
                                                                                                                                              84.3%
                                                                                                                                    83.4%

             2009        2010       2011       2012        2013       2014       2015       2016                                    2009       2010       2011       2012       2013        2014    2015     2016

             Source: Company Information. Refer to Sun Communities, Inc. Form 10-K and Supplemental for the respective periods ended set forth above for additional information. Refer to
             information regarding non-GAAP financial measures in the attached Appendix.
              Note: Same-community pool of assets changes annually.                                                                                                                                                 7
INVESTOR PRESENTATION - MARCH 2017 - StockDeck.io
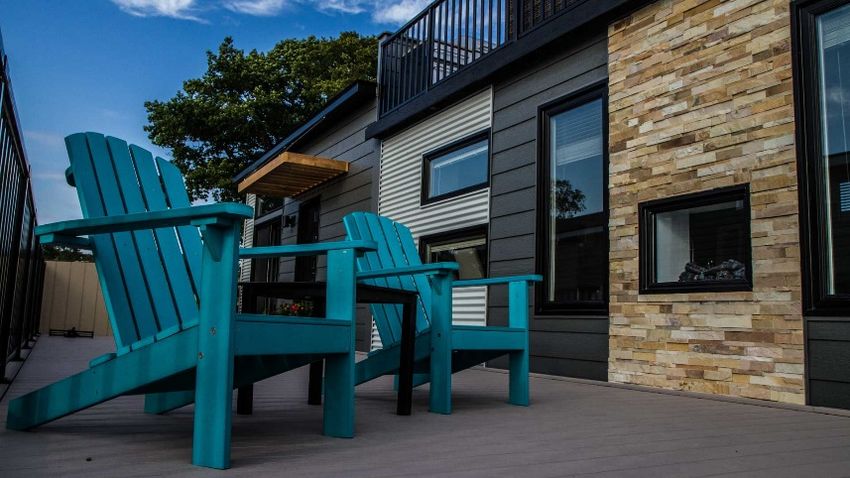
EXPANSIONS PROVIDE STRONG
GROWTH AND ATTRACTIVE RETURNS
 Inventory of approximately 10,600 zoned and entitled sites available for expansion at
  71 properties in 18 states and Ontario
 Approximately 2,200 sites are expected to be developed by the end of 2017
      1,800 MH sites & 400 RV sites
 A 100 site expansion at a $35,000 cost per site, that is leased up in a year (8
  sites/month), results in an unlevered return of 13% - 15%
 Building in communities with strong demand evidenced by occupancies >96%
 Expansion lease-up is driven by sales, rental and relocation programs
                                                                                                                                                           Palos Verdes Shores MH & Golf Community
                                                                                                                                                                                     San Pedro, CA

                                                                         Lakeside Crossing
                                                                               Conway, SC

          SSource: Company Information. Refer to Sun Communities, Inc. Form 10-K and Supplemental for the year ended December 31, 2016 for additional information. ed on most recent                 8
                                                                                                                                                                                                     7
INVESTOR PRESENTATION - MARCH 2017 - StockDeck.io
EXPANSION OPPORTUNITIES
SUPPORTED BY RENTAL PROGRAM
 Sun’s rental program is a key onboarding
  and conversion tool for our communities                                                                           Occupied Rentals as % of Total Available Sites
                                                                                                                              15.7%                      15.6%

Rental Program All-in 5 Year                                                                                                                                         13.5%
Unleveraged IRR:
                                                                                                                                                                                      10.6%
   $42,000 Initial investment in new home

   Weighted average monthly rental rate - $880 x 12
    = $10,560 (3% annual increases)
                                                                                                                             YE 2013                   YE 2014       YE 2015          YE 2016

   Monthly operating expenses1 + 5% vacancy
    factor $250 x 12 = $3,000 (2% annual increases)

   End of 5 year period sell the home and recoup
    >95% of original invoice price

   All-in 5 year unlevered IRR is 15 - 16%

                                                                                                                                                                             Sun-N-Fun RV Resort
                                                                                                                                                                                    Sarasota, FL

           Source: Company Information. Refer to Sun Communities, Inc. Form 10-K and Supplemental for the year ended December 31, 2016 for additional information.
           1 Operating expenses include repairs and refurbishment, taxes and insurance, marketing, and commissions.                                                                                9
EXTRACTING VALUE FROM
ACQUISITIONS
                      PROFESSIONAL                  SKILLED
                      OPERATIONAL                   EXPENSE
                      MANAGEMENT               MANAGEMENT

                                                                  REPOSITIONING
   CALL CENTER /                                                         WITH
      DIGITAL                                                      ADDITIONAL
    MARKETING                                                        CAPEX
    OUTREACH              STRATEGIC ACQUISITIONS

             INCREASING                                       ADDING VALUE
            MARKET RENT                                           WITH
                                                               EXPANSIONS
                                     HOME SALES /
                                       RENTAL
                                      PROGRAM

                                                                                  10
STRATEGIC ACQUISITIONS
 Since May 2011, Sun has acquired communities valued in excess of $4.3 billion, increasing
  its number of sites and communities by 146% and 151%, respectively

Year-end Communities and Sites

        2011                                 2012                                     2013                                    2014                                     2015                      2016
   159 communities                   173 communities                          188 communities                          217 communities                         231 communities              341 communities
     54,811 sites                      63,697 sites                             69,789 sites                             79,554 sites                            88,612 sites                 117,376 sites

    • 17 MH and 1 RV                   • Further                              •   Geographic and RV                    •    Closed 1st phase of               • Final closing of “ALL”     • Acquired Carefree
      community                          strengthened the                          diversification with                     “ALL” 32 of 59 high                 adding 26 communities        Communities, Inc. adding
      Kentland                           MH portfolio with                        10 RV resort Morgan                           quality, age-                                                103 MH and RV
                                                                                                                                                              • Acquired an additional 8
      acquisition growing                the 6 community                          acquisition entering                     restricted community                                              communities and
                                                                                                                                                                MH communities and 4
      the portfolio                      Rudgate acquisition                          5 new states                               acquisition,                                                deepening Sun’s
                                                                                                                                                                RV resorts
                                                                                                                             strengthening and                                               presence in key costal
                                       • Acquired Palm
                                                                                                                               diversifying the                                              markets
                                         Creek, an
                                                                                                                                  portfolio                                                • Also acquired an
                                         irreplaceable age-
                                                                                                                                                                                             additional MH community
                                         restricted asset
                                                                                                                                                                                             and 7 RV resorts

               Source: Company Information. Refer to Sun Communities, Inc. Form 10-K and Supplemental for the respective years ended set forth above for additional information.                                        11
STRATEGIC BALANCE SHEET
 Balance sheet supports growth strategy

 Reduced leverage through 2016 equity offerings

 Anticipates further delevering by mid-2017 through
  full-year EBITDA contribution from Carefree and
  earnings growth                                                                                                                                             Palm Creek Golf & RV Resort
                                                                                                                                                              Casa Grande, AZ

 As of December 31, 2016
                                                                                                                                                                                                        Ocean Breeze RV Resort
  Net Debt / Adj. EBITDA1                                                           Net Debt / TEV 3                                                                                                          Jensen Beach, FL
    9.7x
                                                                                     61.5%

           8.4x
                                                                                                50.4%
                                                           2
                                                    7.5x                                                   45.8%
                   7.2x       7.3x
                                         6.6x
                                                                                                                      34.8% 34.0% 33.8%

    2011   2012    2013       2014       2015       2016                               2011      2012       2013       2014       2015       2016

            Source: Company Information. Refer to Sun Communities, Inc. Form 10-K and Supplemental for the year ended December 31, 2016 for additional information.
            1 The debt ratios are calculated using trailing 12 months EBITDA for the period ended December 31, 2016.
            2 Only includes Carefree Communities EBITDA from date of acquisition of June 9, 2016 to December 31, 2016. Excludes significant forward EBITDA contribution from Carefree Communities.
            3 Total Enterprise Value includes common shares outstanding (per Supplemental Data Package), OP Units and Preferred OP Units, as converted, outstanding at the end of each respective period.                   12
MORTGAGE DEBT MATURITY PROFILE
   Sun’s annual mortgage maturities average 3.2% over the next 5 years
    ($ in thousands as of December 31, 2016)                                                                                 ($ in millions as of December 31, 2016)

                                                  PRINCIPAL             WEIGHTED AVERAGE                                          Commercial Mortgage-Backed Securities             Fannie Mae   Life Companies
                                                                  1
                                               OUTSTANDING                INTEREST RATE                                                                                                             $270.7

          CMBS                                       $492,294                      5.18%

       Fannie Mae                                 $1,046,803                       4.26%

       Freddie Mac                                   $391,765                      3.86%
                                                                                                                                                                        $64.3          $58.1
     Life Companies                                  $888,705                      3.87%                                          $32.7               $26.2

           Total                                $2,819,567                       4.24%
                                                                                                                               YE 2017             YE 2018             YE 2019       YE 2020      YE 2021

                                                                   Rancho Alipaz                                                                                                 Riptide RV Resort & Marina
                                                         San Juan Capistrano, CA                                                                                                              Key Largo, FL

             Source: Company Information. Refer to Sun Communities, Inc. Form 10-K and Supplemental for the year ended December 31, 2016 for additional information.
             1 Includes premium / discount on debt and financing costs                                                                                                                                            13
STRONG INTERNAL GROWTH
          SUN’s average same-community NOI growth has exceeded REIT industry average by
           ~170 bps and the apartment sector’s average by ~160 bps over a 15 year period

Same-Community NOI
Growth(%)
12%

10%

 8%

 6%

 4%

 2%

 0%

 -2%                                                                                                                                                                                               Sun Communities
                                                                                                                                                                                                   Apartments
 -4%
                                                                                                                                                                                                   Industry Average 2.6%

 -6%                                                                                                                                                                                               Sun Average 4.3%
                                                                                                                                                                                                   Apartment Average 2.7%
 -8%
       3Q01
       4Q01
       1Q02
       2Q02
       3Q02
       4Q02
       1Q03
       2Q03
       3Q03
       4Q03
       1Q04
       2Q04
       3Q04
       4Q04
       1Q05
       2Q05
       3Q05
       4Q05
       1Q06
       2Q06
       3Q06
       4Q06
       1Q07
       2Q07
       3Q07
       4Q07
       1Q08
       2Q08
       3Q08
       4Q08
       1Q09
       2Q09
       3Q09
       4Q09
       1Q10
       2Q10
       3Q10
       4Q10
       1Q11
       2Q11
       3Q11
       4Q11
       1Q12
       2Q12
       3Q12
       4Q12
       1Q13
       2Q13
       3Q13
       4Q13
       1Q14
       2Q14
       3Q14
       4Q14
       1Q15
       2Q15
       3Q15
       4Q15
       1Q16
       2Q16
       3Q16
           Source: Citi Investment research, September, 2016. “REITs”- includes an index of REITs across a variety of asset classes including self storage, mixed office, regional malls, shopping centers, multifamily, student housing,
           manufactured homes and specialty. Refer to information regarding non-GAAP financial measures of the attached Appendix.                                                                                                           14
STRATEGY-DRIVEN
OUTPERFORMANCE
    Sun has significantly outperformed major REIT and broader market indices over the last ten years

       1-Year Total Return Percentage                                       3-Year Total Return Percentage
            25                                                              120
            20                                                              100                                     +103.4%
                                                                  +15.7%
            15                                                               80
                                                                  +12.0%
            10                                                               60
             5                                                    +8.6%                                             +45.2%
                                                                             40
             0                                                                                                      +29.1%
                                                                             20
            -5
                                                                              0
           -10
           -15                                                              -20

                                  SUI             S&P 500   RMS                         SUI     S&P 500      RMS

       5-Year Total Return Percentage                                       10-Year Total Return Percentage
          200                                                                 500                                    +441.9%
                                                                  +166.2%
          150                                                                 400

                                                                  +98.2%      300
          100
                                                                              200
            50                                                    +75.2%
                                                                                                                     +95.7%
                                                                              100
             0                                                                                                       +62.3%
                                                                                  0
           -50                                                               -100

                                  SUI             S&P 500   RMS                           SUI    S&P 500      RMS

       Source: SNL Financial as of December 31, 2016.                                                                          15
Gulfstream Harbor
                                                                Orlando, FL

 Adirondack Gateway RV Resort & Campground
                             Gansevoort, NY

                              APPENDIX

Palm Creek Golf & RV Resort                   San Pedro RV Resort & Marina
           Casa Grande, AZ                                  Islamorada, FL
CONSISTENT NOI
GROWTH
   Manufactured housing is one of the most recession-resistant sectors of the
    housing and commercial real estate sectors and has consistently
    outperformed multi-family in same-community NOI growth since 2000
$210

                     SUI

$190                 Manufactured Housing
                     Apartment
                     Industrial
                     Mall
$170
                     Office
                     Strip Mall
                     Self-Storage
$150

$130

$110

 $90
       2000        2001          2002         2003          2004          2005          2006          2007         2008          2009          2010   2011   2012   2013   2014   2015   2016

              Source: SNL Financial as of December 31, 2016. Refer to information regarding non-GAAP financial measures in the attached Appendix.                                               16
MANUFACTURED HOUSING
VS. MULTI-FAMILY
  Sun’s manufactured homes provide nearly 15% more space at over 30% less cost
   per square foot
    Sun’s Manufactured                                                                                                                                    Multi-Family
               Homes                                                                          VS.                                                         Housing

                                                                                                   PRICE

   $0.69 per sq. ft.
                                                                                                                                                                  $1.00 per sq. ft.

                                                                                      SQUARE FOOTAGE

   ~1,2501 sq. ft.
                                                                                                                                                                  ~1,1002 sq. ft.

                                                                                                   RENT

  ~$8601 per month
                                                                                                                                                                ~$1,1002 per month

     1 Source: Company Information. Refer to Sun Communities, Inc. Form 10-K and supplemental for the year ended December 31, 2016 for additional information.
     2 Source: The RentPath Network. Represents average rent for a 2 bedroom apartment in major metropolitan areas Sun operates in as of February 2016.                                17
MANUFACTURED HOUSING
VS. SINGLE FAMILY
            Sun’s communities offer affordable options in attractive locations
                Manufactured Homes                       Single-family Homes

    Average cost of a new Manufactured Home is                                                                        Average cost of Single Family1 is $276,284 or
     $68,000 or roughly 1 years median income                                                                           roughly 5 years median income

                                                     Single-family                   Portion of purchase price attributable to land                         Manufactured

     $500,000
     $450,000
     $400,000
     $350,000
     $300,000
     $250,000                                                                                                                                                                 $276,284
                                                                                                                    $249,429                     $261,172
     $200,000                                                                          $223,085
                            $206,560                     $207,950
     $150,000
     $100,000
                                                                                                                                                                                                         Median
      $50,000                                                                                                                                                                                            Household
                                        $62,800                      $60,500                      $62,200                      $64,000                      $65,300                       $68,000
           $-                                                                                                                                                                                            Income2
                                  2010                          2011                         2012                          2013                          2014                         2015

     1 Source: Manufactured Housing Institute, Quick Facts: “Trends and Information About the Manufactured Housing Industry, 2016.” Represents average 2 bedroom household in major metropolitan areas
       Sun operates in as of December 2016.
     2 Source: US Census Bureau - 2010-2014 American Community Survey 5-Year Estimates. $54,900 represents the median household income in major metropolitan areas Sun operates in.                                  18
NON-GAAP TERMS DEFINED
Funds from operations (FFO) represents net (loss) income (computed in accordance with US Generally Accepted Accounting Principles (GAAP)) and
gain (loss) on sales of depreciable property, plus real estate related depreciation and amortization (excluding amortization of financing costs), and after
adjustments for unconsolidated partnerships and joint ventures, as defined by the National Association of Real Estate Investment Trusts (NAREIT). We
consider FFO an appropriate supplemental measure of the financial and operational performance of an equity REIT. Under the definition,
management also uses FFO excluding certain items, a non-GAAP financial measure, which excludes certain gain and loss items that management
considers unrelated to the operational and financial performance of our core business. We believe that this provides investors with another financial
measure of our operating performance that is more comparable when evaluating period over period results.

Net operating income (NOI) is derived from revenues minus property operating and maintenance expenses and real estate taxes. We use NOI as the
primary basis to evaluate the performance of our operations. We believe that NOI is helpful to investors and analysts as a measure of operating
performance because it is an indicator of the return on property investment and provides a method of comparing property performance over time. We
use NOI as a key management tool when evaluating performance and growth of particular properties and/or groups of properties. The principal
limitation of NOI is that it excludes depreciation, amortization, interest expense, and non-property specific expenses such as general and
administrative expenses, all of which are significant costs, and therefore, NOI is a measure of the operating performance of our properties rather than
of the Company overall. We believe that these costs included in net income often have no effect on the market value of our property and therefore
limit its use as a performance measure. In addition, such expenses are often incurred at a parent company level and therefore are not necessarily
linked to the performance of a real estate asset.

Recurring earnings before interest, tax, depreciation and amortization (Recurring EBITDA) is defined as NOI plus other income, plus (minus) equity
earnings (loss) from affiliates, minus general and administrative expenses. EBITDA includes EBITDA from discontinued operations. Recurring EBITDA
provides a further tool to evaluate ability to incur and service debt and to fund dividends and other cash needs.

FFO, NOI, and Recurring EBITDA do not represent cash generated from operating activities in accordance with GAAP and are not necessarily
indicative of cash available to fund cash needs, including the repayment of principal on debt and payment of dividends and distributions. FFO, NOI,
and Recurring EBITDA should not be considered as alternatives to net income (loss) (calculated in accordance with GAAP) for purposes of evaluating
our operating performance, or cash flows (calculated in accordance with GAAP) as a measure of liquidity. FFO, NOI, and Recurring EBITDA as
calculated by us may not be comparable to similarly titled, but differently calculated, measures of other REITs or to the definition of FFO published by
NAREIT.

                                                                                                                                                        19
NET INCOME TO FFO
RECONCILATION
   Reconciliation of Net (Loss) Income Attributable to Sun Communities, Inc. Common Stockholders to Funds from Operations
   (amounts in thousands except for per share data)

                                                                                  Three Months Ended                              Year Ended
                                                                                      December 31,                               December 31,
                                                                                   2016        2015                 2016           2015               2014
   Net (loss) income attributable to Sun Communities, Inc. common stockholders   $   (1,600) $ 89,399           $    17,369      $ 137,325    $          22,376
   Adjustments:
   Preferred return to preferred OP units                                                604             631           2,462             2,612                281
   Amounts attributable to noncontrolling interests                                     (296)          6,941              (41)           9,644              1,086
   Preferred distribution to Series A-4 preferred stock                                  -               -               -                 -                   76
   Depreciation and amortization                                                     62,351          47,801         221,576           178,048           134,252
   Asset impairment charge                                                               -               -               -                 -                  837
   Gain on disposition of properties, net                                                -          (98,430)             -           (125,376)           (17,654)
   Gain on disposition of assets, net                                                 (3,487)         (3,060)        (15,713)          (10,125)            (6,705)
   Funds from operations (FFO) attributable to Sun Communities, Inc. common
   stockholders and dilutive convertible securities                                  57,572         43,282          225,653          192,128            134,549

   Adjustments:
   Transaction costs                                                                  4,023          4,653           31,914           17,803             18,259
   Other acquisition related costs                                                    1,861            -              3,328               -                  -
   Income from affiliate transactions                                                   -              -               (500)           (7,500)               -
   Foreign currency exchange                                                          5,005            -              5,005               -                  -
   Contingent liability re-measurement                                                  181            -                181               -                  -
   Gain on acquisition of property                                                     (510)           -               (510)              -                  -
   Gain on settlement                                                                   -              -                -                 -               (4,452)
   Hurrincane related costs                                                           1,172            -              1,172               -                  -
   Preferred stock redemption costs                                                     -              -                -               4,328                -
   Extinguishment of debt                                                             1,127            -              1,127             2,800                -
   Debt premium write-off                                                              (839)           -               (839)              -                  -
   Deferred tax (benefit) expense                                                      (400)         1,000             (400)            1,000                -
   FFO attributable to Sun Communities, Inc. common stockholders and dilutive
   convertible securities excluding certain items                                    69,192         48,935          266,131          210,559            148,356

   Weighted average common shares outstanding - basic:                               72,277         56,181           65,856           53,686             41,337
   Weighted average common shares outstanding - fully diluted                        76,454         60,502           70,165           57,979             44,022

   FFO attributable to Sun Communities, Inc. common stockholders and dilutive
   convertible securities per share - fully diluted                              $     0.75     $      0.72     $       3.22     $       3.31     $         3.06
   FFO attributable to Sun Communities, Inc. common stockholders and dilutive
   convertible securities per share excluding certain items - fully diluted      $     0.91     $      0.81     $       3.79     $       3.63     $         3.37

                                                                                                                                                                     20
NOI TO NET INCOME
RECONCILIATION
   Reconciliation of Net Operating Income to Net (Loss) Income Attributable to Sun Communities, Inc. Common Stockholders
   (amounts in thousands)

                                                                                     Three Months Ended                          Year Ended
                                                                                         December 31,                           December 31,
                                                                                      2016        2015             2016             2015            2014
   Real Property NOI                                                                $ 107,256   $ 81,129         $ 403,337        $ 335,567       $ 232,478
   Rental Program NOI                                                                   20,863      20,427           85,086           83,232          70,232
   Home Sales NOI/Gross profit                                                           6,903       5,873           30,087           20,787          13,398
   Ancillary NOI/Gross profit (loss)                                                       254        (312)           9,999            7,013           5,217
   Site rent from Rental Program (included in Real Property NOI)                       (15,436)    (15,512)         (61,600)         (61,952)        (54,289)
       NOI/Gross profit                                                               119,840       91,605         466,909          384,647         267,036
   Adjustments to arrive at net (loss) income:
       Other revenues                                                                    5,691          4,565        21,150            18,157         15,498
       Home selling expenses                                                            (2,504)        (2,079)        (9,744)           (7,476)        (5,235)
       General and administrative                                                     (17,177)       (10,511)       (64,087)          (47,455)       (37,387)
       Transaction costs                                                                (4,023)        (4,653)      (31,914)          (17,803)       (18,259)
       Depreciation and amortization                                                  (62,205)       (47,530)     (221,770)         (177,637)      (133,726)
       Asset impairment charge                                                             -              -              -                 -             (837)
       Extinguishment of debt                                                           (1,127)           -           (1,127)           (2,800)           -
       Interest expense                                                               (31,430)       (28,856)     (122,315)         (110,878)        (76,981)
       Other expenses, net                                                              (5,848)           -           (5,848)              -              -
       Gain on disposition of properties, net                                              -          98,430             -           125,376          17,654
       Gain on settlement                                                                  -              -              -                 -            4,452
       Current tax (expense) / benefit                                                    (116)            71           (683)             (158)          (219)
       Deferred tax benefit / (expense)                                                    400         (1,000)           400            (1,000)           -
       Income from affiliate transactions                                                  -              -              500             7,500          1,200
   Net income                                                                            1,501      100,042          31,471          170,473          33,196
       Less: Preferred return to preferred OP units                                      1,213          1,281          5,006             4,973          2,935
       Less: Amounts attributable to noncontrolling interests                             (310)         6,922            150           10,054           1,752
   Net income attributable to Sun Communities, Inc.                                        598        91,839         26,315          155,446          28,509
       Less: Preferred stock distributions                                               2,198          2,440          8,946           13,793           6,133
       Less: Preferred stock redemption costs                                              -              -              -               4,328            -
   Net (loss) / income attributable to Sun Communities, Inc., common stockholders   $   (1,600)   $ 89,399       $ 17,369         $ 137,325       $ 22,376

                                                                                                                                                                 21
RECURRING EBITDA TO
NET INCOME RECONCILIATION
   Reconciliation of Recurring EBITDA to Net (Loss) Income Attributable to Sun Communities, Inc. Common Stockholders
   (amounts in thousands)

                                                                                    Three Months Ended                      Year Ended
                                                                                       December 31,                        December 31,
                                                                                     2016        2015           2016           2015           2014
   Recurring EBITDA                                                               $ 105,850    $ 83,580       $ 414,228      $ 347,873      $ 239,912
   Interest                                                                           30,641       28,066       119,163         107,659         73,771
   Interest on mandatorily redeemable preferred OP units                                 789          790         3,152            3,219          3,210
   Depreciation and amortization                                                      62,205       47,530       221,770         177,637       133,726
   Asset impairment charge                                                               -            -             -                -              837
   Extinguishment of debt                                                              1,127          -           1,127            2,800            -
   Transaction costs                                                                   4,023        4,653        31,914          17,803         18,259
   Gains on disposition of properties, net                                               -        (98,430)          -          (125,376)       (17,654)
   Other expenses, net                                                                 5,848          -           5,848              -              -
   Gain on settlement                                                                    -            -             -                -           (4,452)
   Current tax expense / (benefit)                                                       116           (71)         683              158            219
   Deferred tax (benefit) / expense                                                     (400)       1,000          (400)           1,000            -
   Income from affiliate transactions                                                    -            -            (500)          (7,500)        (1,200)
   Net income                                                                          1,501     100,042         31,471         170,473         33,196
       Less: Preferred return to preferred OP units                                    1,213        1,281         5,006            4,973          2,935
       Less: Amounts attributable to noncontrolling interests                           (310)       6,922           150          10,054           1,752
   Net income attributable to Sun Communities, Inc.                               $      598   $ 91,839       $ 26,315       $ 155,446      $ 28,509
       Less: Preferred stock distributions                                             2,198        2,440         8,946          13,793           6,133
       Less: Preferred stock redemption costs                                            -            -             -              4,328            -

   Net (loss) income attributable to Sun Communities, Inc., common stockholders   $   (1,600)   $   89,399    $   17,369     $ 137,325      $   22,376

                                                                                                                                                           22
You can also read