Investor Presentation - February 6, 2020 - Vista Outdoor

Page created by Floyd Thompson
 
CONTINUE READING
Investor Presentation - February 6, 2020 - Vista Outdoor
Investor Presentation
                                          February 6, 2020

                                                        © Vista Outdoor | Proprietary
© 2020 | Vista Outdoor Presentation
Investor Presentation - February 6, 2020 - Vista Outdoor
FORWARD LOOKING STATEMENTS
        Certain statements in this press release and other oral and written statements made by Vista Outdoor from time to time are forward-looking
        statements, including those that discuss, among other things: Vista Outdoor’s plans, objectives, expectations, intentions, strategies, goals, outlook
        or other non-historical matters; projections with respect to future revenues, income, earnings per share or other financial measures for Vista
        Outdoor; and the assumptions that underlie these matters. The words ‘believe’, ‘expect’, ‘anticipate’, ‘intend’, ‘aim’, ‘should’ and similar
        expressions are intended to identify such forward-looking statements. To the extent that any such information is forward-looking, it is intended to
        fit within the safe harbor for forward-looking information provided by the Private Securities Litigation Reform Act of 1995. Numerous risks,
        uncertainties and other factors could cause Vista Outdoor’s actual results to differ materially from expectations described in such forward-looking
        statements, including the following: general economic and business conditions in the United States and Vista Outdoor’s other markets outside the
        United States, including conditions affecting employment levels, consumer confidence and spending, conditions in the retail environment, and
        other economic conditions affecting demand for our products and the financial health of our customers; Vista Outdoor’s ability to attract and
        retain key personnel and maintain and grow its relationships with customers, suppliers and other business partners, including Vista Outdoor’s ability
        to obtain acceptable third party licenses; Vista Outdoor’s ability to adapt its products to changes in technology, the marketplace and customer
        preferences, including our ability to respond to shifting preferences of the end consumer from brick and mortar retail to online retail; Vista
        Outdoor’s ability to maintain and enhance brand recognition and reputation; others' use of social media to disseminate negative commentary
        about us and boycotts; reductions in or unexpected changes in or our inability to accurately forecast demand for ammunition, accessories or
        other outdoor sports and recreation products; risks associated with Vista Outdoor’s sales to significant retail customers, including unexpected
        cancellations, delays and other changes to purchase orders; supplier capacity constraints, production disruptions or quality or price issues
        affecting Vista Outdoor’s operating costs; Vista Outdoor’s competitive environment; risks associated with diversification into new international
        and commercial markets including regulatory compliance; changes in the current tariff structures; the supply, availability and costs of raw
        materials and components; increases in commodity, energy and production costs; changes in laws, rules and regulations relating to Vista
        Outdoor’s business, such as federal and state ammunition regulations; Vista Outdoor’s ability to realize expected benefits from acquisitions and
        integrate acquired businesses; Vista Outdoor's ability to execute our strategic transformation plan, including our ability to realize expected
        benefits from the successful divestiture of non-core brands and profitability improvement initiatives; Vista Outdoor’s ability to take advantage of
        growth opportunities in international and commercial markets; foreign currency exchange rates and fluctuations in those rates; the outcome of
        contingencies, including with respect to litigation and other proceedings relating to intellectual property, product liability, warranty liability,
        personal injury and environmental remediation; risks associated with cybersecurity and other industrial and physical security threats; capital
        market volatility and the availability of financing; changes to accounting standards or policies; and changes in tax rules or pronouncements. You
        are cautioned not to place undue reliance on any forward-looking statements we make. Vista Outdoor undertakes no obligation to update any
        forward-looking statements except as otherwise required by law. For further information on factors that could impact Vista Outdoor, and
        statements contained herein, please refer to Vista Outdoor’s filings with the Securities and Exchange Commission.

© 2020 | Vista Outdoor Presentation                                                                                                                             2
Investor Presentation - February 6, 2020 - Vista Outdoor
WHO WE ARE
              ~$2B leading global designer, manufacturer and marketer of
                         outdoor and shooting sports products

    Ammunition                        Hunting & Shooting Accessories                                                     Action Sports & Outdoor Recreation
   ~$0.9B in Sales                            ~$0.4B in Sales                                                                      ~$0.5B in Sales

#1 in Commercial              #1 in Hunt / Shoot                 #1 in Rangefinders                      #2 in Camp                    #1 in Bike / Hike     #1 in Helmets &
   Ammunition                    Accessories                                                                Stoves                     Hydration Packs        Accessories
   #1 in U.S. Law
                                        Notes:                                                                                         #1 in Tritan & Bike     #2 in Snow
   Enforcement                          Sources: Ammo: Southwick Associates consumer survey of equipment purchases, SSI Data,                                                  3
                                        POS Data, internal data, management estimates and calculation based on law                           Bottles            Goggles
    Ammunition                          enforcement agencies served relative to total U.S. agencies, adjusted for the size of larger
                                        agencies; Hunt / Shoot: 2018 Southwick Associates Hunting-Shooting Participation and
                                        Equipment Purchases Report and SEC filings; Bushnell Golf: Golf Datatech; Camp Chef:
                                        internal data and management estimates; CamelBak: NPD Group; Bell/Giro: NPD Group,
© 2020 | Vista Outdoor Presentation     retail channel checks, internal data and management estimates.
                                                                                                                                                                               3
Investor Presentation - February 6, 2020 - Vista Outdoor
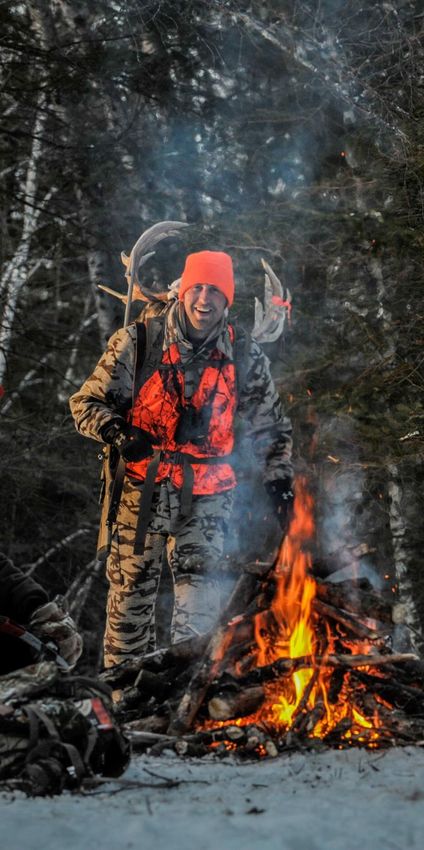
WHAT MAKES US UNIQUE
      Vista Outdoor’s market leading brands, in combination with corporate scale and Centers of
      Excellence, provide a unique investment opportunity in the outdoor industry

                                             Key Differentiators
                        Vista Outdoor’s Brands are Renowned and Market Leaders in Many of Their
                                                       Categories

                            Operational and Digital & E-Commerce Centers of Excellence Provide
                             Value Across Portfolio and Build a Platform for Tuck-in Acquisitions

                             People – Executive Team is Composed of Strong Operators that Drive
                                                Accountability and Discipline

                         Strong Knowledge of Core Consumer Combined with Established Channel
                            Relationships to Reach End Consumers Wherever They Prefer to Shop

                         Hyper-focus on Free Cash Flow Generation Through Cost Cutting, Working
                                Capital Management and Disciplined Capital Expenditures

© 2020 | Vista Outdoor Presentation                                                                 4
Investor Presentation - February 6, 2020 - Vista Outdoor
OUTDOOR INDUSTRY
       Vista Outdoor participates in a large, growing and profitable outdoor products
       industry that is highly fragmented, while holding share in the ammunition industry
       which is highly segmented

                                                Representative Market Share by Segment
($ in billions)
                          ~$2.0                      ~$1.5+                 ~$1.0+                                ~$3.0+                             ~$1.0+             ~$1.0+ ~$0.3 ~$0.2
 Total:
~$10B+

                                                                       Competitor 4
                                                                        Competitor 3
                      Competitor 2
                                                                        Competitor 2

                      Competitor 1

                                                                        Competitor 1
                                                                                                                                                                                         ~50%

                                                                                                                                                      ~30%                           ~30%
                          ~30%
                                                      ~20%
                                                                             ~10%                                  ~10%
                                                                                                                                                                         ~5%
                        Domestic                Global LE / Mil &           Outdoor                         Hunting & Shooting                      Helmets &            Water Hydration Golf
                       Commercial               Int’l Commercial            Cooking                            Accessories                         Accessories           Bottles Packs EMDs
                       Ammunition                  Ammunition

              Vista Share
                                      Notes:
                                      Numbers are approximate based on the following sources: NPD, Third Party Consulting Firm, Southwick Associates Retail Market Size Report, Excise
                                      Tax Data per the U.S. Treasury, SEC filings, Golf Datatech, internal data and management estimates, Helmets & Accessories data may understate
                                      market share of some competitors (combined top-line market size data with share data that excludes breakout for mass channel); assumed retail
© 2020 | Vista Outdoor Presentation   margins where applicable; Hydration data represents sporting goods, specialty chains (including REI), grocery and e-tail.
                                                                                                                                                                                                5
Investor Presentation - February 6, 2020 - Vista Outdoor
DOMESTIC COMMERCIAL
                                      AMMO TRENDS
                                           U.S. Commercial Wholesale Ammo Sales
                                       $3.5                                                                                    ($ in billions)

                                       $3.0

                                       $2.5

                                       $2.0

                                       $1.5

                                       $1.0

                                       $0.5

                                       $0.0

                                                                                                                                             LTM Sep-19
                                                  1992
                                                         1994
                                                                1996
                                                                       1998
                                                                              2000
                                                                                     2002
                                                                                            2004
                                                                                                   2006
                                                                                                          2008
                                                                                                                 2010
                                                                                                                        2012
                                                                                                                               2014
                                                                                                                                      2016
                                                                                                                                                   2018
                                      Notes:
                                      Source: Industry wholesale dollar sales ($B) via Excise Taxes per the
                                      U.S. Department of the Treasury.                                                                                    6
© 2020 | Vista Outdoor Presentation
Investor Presentation - February 6, 2020 - Vista Outdoor
VISTA OUTDOOR’S
 ACCELERATED
 TRANSFORMATION PLAN
      Transformation Plan has been established to set
      the foundation for improved long-term financial
      performance

     Optimize Organizational Structure

     Develop Leading Centers of Excellence

     Reduce Leverage

     Return to Organic Growth

     Explore Tuck-in Acquisitions

© 2020 | Vista Outdoor Presentation                     7
Investor Presentation - February 6, 2020 - Vista Outdoor
CENTERS OF EXCELLENCE

                       LEADING-EDGE VISTA OUTDOOR TEAM PROVIDES
               LEADERSHIP, BEST PRACTICES, RESEARCH, SUPPORT AND
                         TRAINING TO OUR BRANDS AND BUSINESS UNITS

© 2020 | Vista Outdoor Presentation                                  8
Investor Presentation - February 6, 2020 - Vista Outdoor
CENTER OF EXCELLENCE #1:
 DIGITAL & E-COMMERCE
      Plan globally… Execute locally

     Connecting with End-Consumers on Their
     Terms… Digitally

     Leveraging Leadership Thinking

     Utilizing Scalable Systems and a Common
     Technology Platform

     Sharing Consumer Insights

     Developing More Connected Products that Drive
     Affinity

© 2020 | Vista Outdoor Presentation                  9
Investor Presentation - February 6, 2020 - Vista Outdoor
EXECUTING DIGITAL STRATEGIES CASE
   STUDY: CAMELBAK PRIME DAY RECAP
       Objective: expose 100M+ Amazon Prime customers to CamelBak products

                      Spotlight Deal Placement
                                                     ~50k               ~$750k
                                                    Units Sold        Total Revenue

                       High Impact Promotions
  Strategy

                      Collaborative Planning to
                      Optimize the Promotions

                                                     5.7M+               105%
                                                                     Week-over-Week
                                                  Ad Impressions
                     Increase Marketing Spend                        Revenue Growth

© 2020 | Vista Outdoor Presentation                                                   10
CENTER OF EXCELLENCE #2:
 OPERATIONAL EXCELLENCE
      Continuously evaluating and optimizing
      operations across the business

            1
         Rigorous and On-going Financial Review Process of
         All Brands and Functions… Inspect What You Expect

            2
         Continuous Improvement Mindset to Drive $15-$20M
         Gross Profit and $1-$5M G&A Improvement Annually

            3
         Periodic Audit of Businesses to Drive Out Waste, and
         Improve Execution and Corporate Processes

© 2020 | Vista Outdoor Presentation                             11
EXECUTING OPERATIONAL EXCELLENCE
 STRATEGY CASE STUDY
      Vista Outdoor is leveraging its Center of Operational Excellence to simplify the business
      and optimize spending

                                                        Spans and Layers

                                                         Review all Headcount
                                                       Using External Benchmark
                                                         and Assessment Tools

                                                            Simplification
                                                             and Savings
                                               Spend                              SKU

                                      Zero-Based Budget Tool to        Detailed Assessment to
                                       Justify Every Dollar Spent     Understand Profitability by
                                                                         Product, Part and
                                                                              Customer

© 2020 | Vista Outdoor Presentation                                                                 12
CURRENT VISTA OUTDOOR BUSINESS UNIT
 EXAMPLE
      Findings and goals of a Vista Outdoor Business Unit’s execution in conjunction with the
      Center of Operational Excellence

             Current # of SKUs                    FY20 Exit # of SKUs                FY21 # of SKUs

                   ~24,000                              ~18,000                        ~13,000

                          Current # of Profit Centers             FY20 Exit # of Profit Centers

                                      12                                       7

                          Current # of Cost Centers               FY20 Exit # of Cost Centers

                                      114                                     86

© 2020 | Vista Outdoor Presentation                                                                   13
KEYS TO ORGANIC
 GROWTH
       Vista Outdoor’s Accelerated Transformation Plan
       provides all of the ingredients for organic growth

                          Innovative New Products

                            Powerhouse Marketing

                        Channel Flexibility – Digital

                                      Talent

© 2020 | Vista Outdoor Presentation                         14
TUCK-IN ACQUISITION APPROACH
         We are looking for businesses that, through the help of our Centers of Excellence, we can take
         to the next level in terms of sales and profitability

                          Acquire in Adjacent Spaces
    Criteria

                                                             Acquire Businesses to Which Vista
                                                                Outdoor Can Add Value
                   Acquire Great Brands that Resonate
                           with Our Consumer

                    Vigorously Execute Integration and
                                                            Integrate Using Repeatable Model
                            Investment Thesis
    Post-Closing

                   Drive Synergies Through Cost-Sharing      Drive Revenue Synergies Through
                               Opportunities                  Cross-Selling with Other Brands

                    Drive Value Through Our Centers of      Maintain “Founder’s Mentality” and
                                Excellence                 Culture that Made the Business Great

© 2020 | Vista Outdoor Presentation                                                                 15
TUCK-IN ACQUISITION CASE STUDY
      Our acquisition of Camp Chef is an example of how we can leverage the Vista
      Outdoor platform for tuck-in acquisitions

               Marketing, Social Media,         E-Commerce

                                                                    15%+ Sales CAGR
                  Partnerships, etc.

   Key Influencer                         B2B
    Relationships,
  such as Guy Fieri
                                                                    Since Acquisition
                                                                       Adjacent Market Expansion

Strong Social Media                                                         Pellet Grills
    Engagement                                  DTC

                                                                   Grow Market
                                                                      Share

                                                             Existing Category Growth
© 2020 | Vista Outdoor Presentation                                                                16
FY2020 OUTLOOK

                                                                                 Current FY2020               Prior FY2020
                                                                                   Guidance                    Guidance

                                Sales                                            $1.75B – $1.80B             $1.75B – $1.85B

                                Adj. Interest
                                                                                           ≤$35M                 ≤$37M
                                expense(1)
                                Adj. earnings per
                                                                                    $0.15 – $0.20             $0.10 – $0.25
                                share(2)
                                Capital
                                                                                           ~$35M                 ~$40M
                                expenditures

                                Free cash flow(2)                                  $40M – $50M                $30M – $40M

                                      Notes:
                                      1. Includes amortization of financing costs.
© 2020 | Vista Outdoor Presentation   2. Non-GAAP financial measure. See reconciliation table for details.                     17
BETTER TOGETHER: LEVERAGING VISTA’S
   KEY STRENGTHS
       Vista Outdoor’s market leading brands, in combination with corporate scale and
       Centers of Excellence, provide a unique investment opportunity in the outdoor industry
                         Key Differentiators                                                                          Market Leading Brands

      Vista Outdoor’s Brands are Renowned and Market                                                                                                  in Commercial
                                                                                                                                            #1        Ammunition
             Leaders in Many of Their Categories

      Operational and Digital & E-Commerce Centers of                                                                                       #1        in Hunt / Shoot
       Excellence Provide Value Across Portfolio and                                                                                                  Accessories
          Build a Platform for Tuck-in Acquisitions
                                                                                                                                            #1        in Bike / Hike
                                                                                                                                                      Hydration Packs
       People – Executive Team is Composed of Strong
      Operators that Drive Accountability and Discipline
                                                                                                                   /                        #1        in Helmets &
                                                                                                                                                      Accessories
        Strong Knowledge of Core Consumer Combined
        with Established Channel Relationships to Reach
          End Consumers Wherever They Prefer to Shop
                                                                                                                                            #2        in Snow Goggles

         Hyper-focus on Free Cash Flow Generation
           Through Cost Cutting, Working Capital
                                                                                                                                            #2        in Camp Stoves
      Management and Disciplined Capital Expenditures
                                      Notes:
                                      Sources: Ammo: Southwick Associates consumer survey of equipment purchases, SSI Data, POS Data, internal data & management estimates; Hunt/Shoot:
© 2020 | Vista Outdoor Presentation
                                      2018 Southwick Associates Hunting-Shooting Participation and Equipment Purchases Report and SEC filings; Camp Chef: internal data and management    18
                                      estimates; CamelBak: NPD Group; Bell/Giro: NPD Group, retail channel checks, internal data and management estimates.
INVESTMENT
       THESIS
 Vista Outdoor presents a unique           Leading Brands
opportunity to invest in a company
 with significant upside potential

                                        Large, Growing Market

                                          Profitability Upside

                                        Proven Management

                                                 =
                                      Compelling Investment
                                          Opportunity

© 2020 | Vista Outdoor Presentation                              19
Financial Overview

© 2020 | Vista Outdoor Presentation
                                      20
VISTA OUTDOOR FINANCIAL HISTORY
     Vista Outdoor’s financial performance has been mostly impacted by the ammunition
     market decline since 2016, and the recent divestitures of Firearms and Eyewear

       3
           $3.5

                                                                   FY16A – FY20E Net Sales Summary                                                                          22.0%
                                                                                                                                                                            25%
       ($ in billions)
           $3.0

                                                               $2.5
    2.5                                                                                                                                                                     17.0%
                          $2.3                                  $0.3
                                                                                                     $2.3                                                                   20%
                                                                                                                                          $2.1
           $2.5

                           $0.3                                                                      $0.3
       2                                                                                                                                               ~$1.75B - $1.80B
                                  15%
                                  15%                                                                                                      $0.2                             12.0%
           $2.0

                                                                $1.2                                                                                                        15%

    1.5                                                                12%                           $1.0
                           $1.2                                                                                                            $0.9                 $0.9
                           $1.2                                  $1.2                                $1.0                                                        $0.9
           $1.5

                                                                                                                                           $0.9                              7.0%
                                                                                                                                                                            10%
       1   $1.0

                                                                                                            7%                                 7%                      6%
                                                                                                                                                                            5%
                                                                                                                                                                             2.0%
    0.5                                                         $1.0                                 $1.0                                  $0.9                 $0.9
                           $0.8
           $0.5

       0   $0.0

                                                                                                                                                                            0%
                                                                                                                                                                             -3.0%
                         FY2016A                             FY2017A                              FY2018A                               FY2019A                FY2020E

                                      Divestitures(1)                 Ammunition                         Outdoor Products                           EBITDA Margin(2)

Notes:
1. Divestitures include sale of Eyewear and Firearms brands.
2. EBITDA figure used in EBITDA margin calculated as adjusted operating profit plus deprecation and amortization – see appendix for details.

© 2020 | Vista Outdoor Presentation                                                                                                                                           21
OPERATIONAL EFFICIENCY: SG&A AND CAPEX
        Major reductions in SG&A and CapEx have been executed to align cash
        expenditures with revenue model

                               $2.5B
                                                                           $2.3B
                                                                                                                      $2.1B
                                                                                                                               ~$1.75B - $1.80B

                            $91M / 4%                                   $67M / 3%
                                                                                                                   $42M / 2%       ~$35M / 2%
                          $455M / 18%                                 $444M / 19%                                $371M / 18%         ~18%

                              FY2017A                                                                                FY2019A        FY2020
                                                                         FY2018A
                                                                                                                                   Guidance
                                                                                                                                                (1)
                                                             Revenue                            Capital Expenditures            Adjusted SG&A
Notes:
1. Adjusted SG&A defined as reported SG&A, adjusted for items listed in non-GAAP reconciliation. See appendix for details.

© 2020 | Vista Outdoor Presentation                                                                                                                   22
CAPITAL DEPLOYMENT PRIORITIES
     Vista Outdoor’s first priority is debt paydown occurring alongside profitability-focused
     initiatives that will result in reduced leverage and increased shareholder value

                                                                                                                             Net Debt Paydown Scenario

   1          Paydown Debt                                                                                   ($ in millions)

                                                                                                               $893

   2          Reinvest in Brands “Profit Pools”

   3          Build E-Commerce Platforms
                                                                                                                            $498 ~$300+

                          ~3x Leverage

   4          Tuck-in Acquisitions
                                                                                                                                                     $150
Appendix

© 2020 | Vista Outdoor Presentation   24
NON-GAAP FINANCIAL MEASURES
        Non-GAAP financial measures such as earnings before interest, tax, depreciation and amortization (“EBITDA”), Adjusted EBITDA, EBITDA Margin,
        Adjusted EBITDA Margin, Free Cash Flow and Net Debt as included in this Presentation are supplemental measures that are not calculated in
        accordance with Generally Accepted Accounting Principles (“GAAP”). Please see the Appendix to this presentation for reconciliations of these
        Non-GAAP financial measures to their comparable GAAP financial measures.
        We define Adjusted EBITDA as EBITDA adjusted for the impact of costs incurred for contingent consideration, current and potential transaction
        costs, debt issuance costs, CEO/CFO transition costs, goodwill and intangibles impairment, impairment of held-for-sale assets, loss on Firearms sale,
        business transformation activities, and restructuring. We believe that the presentation of EBITDA and Adjusted EBITDA helps investors analyze
        underlying trends in our business, evaluate the performance of our business both on an absolute basis and relative to our peers and the broader
        market, provides useful information to both management and investors by excluding certain items that may not be indicative of the core
        operating results and operational strength of our business and helps investors evaluate our ability to service our debt.
        We define EBITDA margin as EBITDA divided by net sales. We believe EBITDA margin provides investors with an important perspective on the
        company's core profitability and helps investors analyze underlying trends in the company's business and evaluate its performance on an absolute
        basis and relative to its peers. EBITDA margin should be considered in addition to, and not as a substitute for, GAAP net profit margin. Our definition
        may differ from that used by other companies. Vista Outdoor has not reconciled EBITDA margin guidance to GAAP net profit margin guidance
        because Vista Outdoor does not provide guidance for net income, which is a reconciling item between GAAP net profit margin and non-GAAP
        EBITDA margin. Accordingly, a reconciliation to net profit margin is not available without unreasonable effort.
        We define Adjusted EBITDA Margin as Adjusted EBITDA divided by net sales. We believe that the presentation of Adjusted EBITDA Margin helps
        investors analyze underlying trends in our business, evaluate the performance of our business both on an absolute basis and relative to our peers
        and the broader market, provides useful information to both management and investors by excluding certain items that may not be indicative of
        the core operating results and operational strength of our business and helps investors evaluate profitability relative to our sales.
        We define Free cash flow as cash provided by (used for) operating activities less capital expenditures, and excluding the following costs which
        have been adjusted for applicable tax amounts: contingent consideration, transaction costs paid to date, debt issuance costs, CEO/CFO
        transition costs paid to date, loss on Eyewear sale, business transformation costs paid to date and reorganization costs paid to date. Vista Outdoor
        management believes free cash flow provides investors with an important perspective on the cash available for debt repayment, share
        repurchases and acquisitions after making the capital investments required to support ongoing business operations. Vista Outdoor management
        uses free cash flow internally to assess both business performance and overall liquidity.
        These non-GAAP financial measures have limitations as analytical and comparative tools and you should consider EBITDA, Adjusted EBITDA, EBITDA
        Margin and Free Cash Flow in addition to, and not as a substitute for, operating income, cash from operating activities or any other measure of
        financial performance or liquidity reported in accordance with GAAP. Throughout the presentation, certain numbers will not sum to the total due
        to rounding.

© 2020 | Vista Outdoor Presentation                                                                                                                               25
HISTORICAL FINANCIAL HIGHLIGHTS

                                                                                                Net Sales
                               ($ in millions)
                                $3,000                                 $2,271               $2,547                $2,308                                Guidance =
                                                 $2,083                                                                                 $2,059
                                $2,000                                                                                                                $1,750 – $1,800(1)
                                $1,000
                                    $0
                                                 FY2015                FY2016               FY2017                FY2018               FY2019               FY2020E

                                                                                              Net Income
                               ($ in millions)
                                                       $80                      $147
                                      $0
                                 ($500)                                                                                            ($60)
                                                                                                        ($274)
                               ($1,000)                                                                                                                     ($648)
                                                    FY2015                    FY2016                    FY2017                    FY2018                    FY2019
                 Net Income
                     Margin:                          3.8%                      6.5%                    (10.8%)                   (2.6%)                    (31.5%)

                                                                                Adjusted EBITDA (Non-GAAP)(2)

                               ($ in millions)
                               $450               $320                       $349                      $309
                               $300                                                                                               $170                       $138
                               $150
                                 $0
                   Adjusted                      FY2015                    FY2016                     FY2017                    FY2018                     FY2019
             EBITDA Margin:                      15.3%                      15.4%                      12.1%                      7.4%                       6.7%
                                    Notes:
                                    1. Guidance as of February 6, 2020. Guidance updated to reflect expected results for Full FY2020, which included Firearms business unit in the first quarter.
© 2020 | Vista Outdoor Presentation 2. See appendix for non-GAAP reconciliation.                                                                                                                    26
HISTORICAL CASH FLOW & CAPITAL
    SPENDING

                                Free Cash Flow Generation(1)                                                                         Disciplined Capital Expenditures

      ($ in millions)                                                                                         ($ in millions)

        $225                                                                                                 $100
                                                              $206                                                                                  $91
        $200                                                                                                   $90
                                                                                                                          Increase driven by
                                                                                                               $80          acquisitions and
        $175                       $163                                                                                            capacity
                     $160
                                                                                                                         expansion initiatives
                                                                                                               $70                                           $67
        $150
                                                                                                               $60
        $125
                                                                                                               $50
                                                                                                                           $43           $42                          $42
        $100                                                                                                                                                                  Guidance =
                                                                             $79                               $40                                                              ~$35(2)
          $75
                                                                                     Guidance =                $30
                                                                                     $40 – $50(2)
          $50                                    $41
                                                                                                               $20

          $25                                                                                                  $10

            $0                                                                                                   $0
                    FY2015       FY2016        FY2017        FY2018        FY2019      FY2020E                           FY2015       FY2016       FY2017   FY2018   FY2019    FY2020E
   % of Sales:       8.5%          7.2%          1.5%         9.1%          3.9%      2.2% – 2.9%                          2.1%         1.8%        3.6%     2.9%    2.1%     1.9% – 2.0%

Notes:
1. See appendix for non-GAAP reconciliation.
2. Guidance as of February 6, 2020. Guidance updated to reflect expected results for the Full Fiscal Year 2020, which included Firearms business
   unit in the first quarter.

© 2020 | Vista Outdoor Presentation                                                                                                                                                         27
HISTORICAL FINANCIAL SUMMARY

                                                                                 Years Ended March 31,
            ($ in millions)                                             FY2016       FY2017              FY2018     FY2019

            Net Sales                                                   $2,271       $2,547              $2,308     $2,059

            Gross Profit                                                  619           669                 521        416

               % Margin                                                  27.3%        26.3%               22.6%      20.2%

            Operating Income                                              263        (207)(1)             (85)(2)   (617)(3)

               % Margin                                                  11.6%       (8.1%)              (3.7%)     (30.0%)

            D&A                                                            73             94                  90         78

            EBITDA (Non-GAAP)(4)                                          335          (113)                   5      (540)

               % Margin                                                  14.8%       (4.4%)                0.2%     (26.2%)

            Adjusted EBITDA (Non-GAAP)(4)                                $349          $309                $170       $138

               % Margin                                                  15.4%        12.1%                7.4%       6.7%
 Notes:
 1. Includes $449M goodwill/trade name impairment.
 2. Includes $152M goodwill/trade name impairment.
 3. Includes $537M goodwill/trade name impairment.
 4. Non-GAAP financial measure. See reconciliation table for details.

© 2020 | Vista Outdoor Presentation                                                                                            28
NON-GAAP RECONCILIATION: ADJUSTED EBITDA
                   ($ in 000’s)                                                                             FY2016                   FY2017                  FY2018                   FY2019
                   Net income                                                                             $147,037              ($274,454)                ($60,232)              ($648,443)
                   Interest expense (income), net                                                            24,351                   43,670                  49,214                   57,191
                   Income tax provision (benefit)                                                            91,370                   23,760                (73,557)                 (25,829)
                   Depreciation and amortization                                                             72,614                   93,779                  89,759                   77,503
                   EBITDA                                                                                 $335,372              ($113,245)                    $5,184             ($539,578)
                   Goodwill and intangibles impairment (1)                                                           -              449,199                  152,320                 536,627
                   Transaction and transition costs(2)                                                         9,009                   4,575                    1,893                   9,824
                   Acquisition claim settlement(3)                                                                   -             (30,027)                           -                        -
                   Contingent consideration(4)                                                                       -               (2,171)                  (1,515)                   3,371
                   Inventory step-up(5)                                                                        1,043                      817                         -                        -
                   Restructuring and facility rationalization (6)                                              3,258                          -                 8,211                          -
                   CEO/CFO transition(7)                                                                             -                        -                 9,747                          -
                   Pension curtailment(8)                                                                            -                        -               (5,782)                          -
                   Loss on Eyewear sale(9)                                                                           -                        -                       -                 4,925
                   Impairment of held-for-sale             assets(10)                                                -                        -                       -                84,555
                   Transformation(11)                                                                                -                        -                       -                38,551
                   Adjusted EBITDA                                                                        $348,682                $309,148                 $170,058                $138,275

 Notes:
 1. In FY19, FY18 and FY17, the Company recorded a non-cash goodwill impairment related to the Hunting / Shooting Accessories, Outdoor Recreation, and Action Sports reporting units; Sport Protection
     and Hunting / Shooting Accessories reporting units; and Hunting / Shooting Accessories reporting unit, respectively.
 2. Represents transaction costs, including accounting, legal and advisor fees, and transition costs, in each case incurred in connection with possible and completed transactions.
 3. In FY17, the Company finalized a settlement of claims that it brought against the previous owner of Bushnell Holdings and third-party insurance providers relating to certain disputes arising under the
     purchase agreement with respect to the acquisition.
 4. Revaluation and recorded portion of contingent consideration related to Jimmy Styks, Bell Powersports product line and Camp Chef.
 5. Represents inventory step-up recorded in connection with the acquisitions of CamelBak, Action Sports and Camp Chef as part of their respective purchase price allocations.
 6. Represents costs associated with business unit reorganization that occurred in FY18 and closure of the Meridian, Idaho and Norfolk, Virginia facilities in FY16.
 7. Represents costs associated with the replacement of the CEO and CFO.
 8. Curtailment gain a result of eliminating future pay credits under our pension plan.
 9. In FY19, the Company completed the sale of its Bollé, Serengeti, and Cébé brands (the "Eyewear Brands"). The Company recorded a pretax loss of approximately $5 million.
 10. In FY19, Vista Outdoor recognized a loss of $40 million related to the impairment of the Firearms held-for-sale assets and $45 million related to the impairment of the Eyewear brand held-for-sale assets.
 11. Related to the sublease of the former corporate headquarters, operational realignments, and the implementation of a new ERP system. The Company also incurred costs related to consulting
     services associated with a strategic supply chain efficiency initiative.

© 2020 | Vista Outdoor Presentation                                                                                                                                                                                29
NON-GAAP RECONCILIATION: QUARTERLY
   ADJUSTED EBITDA

     Quarterly Adjusted EBITDA reflects Vista Outdoor’s adjusted earnings before interest and tax, per the Company’s quarterly
     disclosures, plus depreciation and amortization for the trailing four quarters.

                      ($ in 000’s)                                                                 Q4 FY2019           Q1 FY2020          Q2 FY2020         Q3 FY2020          LTM Q3 FY2020

                      Net income                                                                     ($48,635)           ($16,615)          ($11,898)            $14,648               ($62,500)

                      Interest expense (income), net                                                     10,851              11,124             12,314              8,373                  42,662
                      Income tax provision (benefit)                                                       1,401                 737                891           (4,352)                  (1,323)
                      Depreciation and amortization                                                      18,107              16,387             19,645            15,171                   69,310
                      EBITDA                                                                         ($18,276)             $11,633            $20,952            $33,840                 $48,149
                      Transaction and transition costs(1)                                                      14                401                  82                  -                    497
                      Contingent consideration(2)                                                            843                 843                843                   -                  2,529
                      Restructuring and asset impairment costs(3)                                                -                   -            7,292               479                    7,771
                      Loss on divestiture (Firearms)(4)                                                          -                   -              433                   -                    433
                      Impairment of held-for-sale assets(5)                                              36,384               9,429                     -                 -                45,813
                      Transformation(6)                                                                    9,818                     -                  -                 -                  9,818
                      Adjusted EBITDA                                                                  $28,783             $22,306            $29,602            $34,319                $115,010
 Notes:
 1. Represents transaction costs, including accounting, legal and advisor fees, and transition costs, in each case incurred in connection with possible and completed transactions.
 2. Revaluation and recorded portion of contingent consideration related to Camp Chef.
 3. In FY20, the Company incurred restructuring and asset impairment costs related to impairment on leased properties, impairment of internally developed software and operational realignments costs
     which were incurred to generate longer-term benefits.
 4. During the quarter ended September 29, 2019, the Company completed the sale of its Firearms business for a total purchase price of $170,000,000. As a result, the Company recorded a pretax loss of
     $0.4 million which is included in other income (expense), net.
 5. In FY19, Vista Outdoor recognized a loss of $36 million related to the impairment of the Firearms held-for-sale assets. In FY20, Vista Outdoor recognized a loss of $9 million related to the impairment of
     Firearms held-for-sale assets.
 6. Related to operational realignments and the implementation of a new ERP system. The Company also incurred costs related to consulting services associated with a strategic supply chain efficiency
     initiative.
© 2020 | Vista Outdoor Presentation                                                                                                                                                                               30
NON-GAAP RECONCILIATION: FREE CASH
   FLOW
    Free cash flow is defined as cash (used for) provided by operating activities less capital expenditures, and excluding the following
    costs which have been adjusted for applicable tax amounts: contingent consideration costs, transaction costs, debt issuances
    costs, restructuring and asset impairment costs, business transformation costs and loss on divestiture (Eyewear Brands). Vista
    Outdoor management believes free cash flow provides investors with an important perspective on the cash available for debt
    repayment and acquisitions after making the capital investments required to support ongoing business operations. Vista Outdoor
    management uses free cash flow internally to assess both business performance and overall liquidity.

                                                                                                                               Years Ended March 31,

    ($ in 000’s)                                                                                  FY2016             FY2017             FY2018              FY2019        FY2020 Guidance(1)
    Cash from Operating Activities                                                             $198,002           $158,401            $252,355             $97,475             $69,748 – 79,748
    Capital Expenditures                                                                        (41,526)            (90,665)           (66,627)           (42,242)                       ~(35,000)
    Debt Issuance Costs                                                                                   -                   -                  -          (1,411)                          (1,015)
    Transaction Costs Paid to Date, Net of Tax                                                      6,485              3,720               1,239              7,466                              367
    Acquisition Claim Settlement                                                                          -         (30,027)                     -                   -                               -
    CEO/CFO Transition Costs Paid to Date, Net of Tax                                                     -                   -          12,388                      -                               -
    Restructuring and Asset Impairment Costs                                                              -                   -            3,515                     -                         2,529
    Contingent Consideration                                                                              -                   -            3,371              3,371                            3,371
    Loss on Eyewear Sale                                                                                  -                   -                  -            1,379                                  -
    Business Transformation                                                                               -                   -                  -          13,339                                   -
    Free Cash Flow                                                                             $162,961             $41,429           $206,241             $79,377           $40,000 -     50,000(2)

 Notes:
 1. As of February 6, 2020. Adjustments are not included in Free Cash Flow guidance until such adjustments, if any, are incurred. Guidance updated to reflect expected results for the Full Fiscal Year
    2020, which included Firearms business unit in the first quarter.
 2. Free Cash Flow guidance calculated as low-end of Cash from Operating Activities minus low-end of Capital Expenditures to high-end minus high-end of the respective items.
© 2020 | Vista Outdoor Presentation                                                                                                                                                                       31
You can also read