Study loading capacties of air pollutant emissions for developing countries: a case of Ho chi Minh city, Vietnam - Nature
←
→
Page content transcription
If your browser does not render page correctly, please read the page content below
www.nature.com/scientificreports

            OPEN           Study loading capacties of air
                           pollutant emissions for developing
                           countries: a case of Ho Chi Minh
                           City, Vietnam
                           Bang Quoc Ho*, Khue Hoang Ngoc Vu, Tam Thoai Nguyen, Hang Thi Thuy Nguyen,
                           Dung Minh Ho, Hien Nhu Nguyen & Thuy Thi Thu Nguyen*
                           Ho Chi Minh City (HCMC) is one of the cities in developing countries where many concentrations of air
                           pollutants exceeded the Vietnam national technical regulation in ambient air quality including TSP,
                           NOx, Ozone and CO. These high pollutant concentrations have destroyed the human health of people
                           in HCMC. Many zones in HCMC can’t receive more air pollutants. The objectives of this research are:
                           (i) Air quality modeling over HCMC by using the TAPM-CTM system model by using a bottom up air
                           emission inventory; and (ii) Study loading capactities of air pollutant emissions over Ho Chi Minh City.
                           Simulations of air pollution were conducted in Ho Chi Minh City (HCMC), the largest city of Vietnam by
                           using the TAPM-CTM model. The model performance was evaluated using observed meteorological
                           data at Tan Son Hoa station and air quality data at the Ho Chi Minh City University of Science. The
                           model is then applied to simulate a retire 1-year period to determine the levels of air pollutants in
                           HCMC in 2017, 2025 and 2030. The results show that the highest concentrations of CO, NO2, and O3 in
                           2017 exceeded the National technical regulation in ambient air quality (QCVN 05:2013) 1.5, 1.5, and
                           1.1 times, respectively. These values also will increase in 2025 and 2030 if the local government does
                           not have any plan for the reduction of emissions, especially, SO2 in 2030 also will be 1.02 times higher
                           than that in QCVN 05:2013. The emission zoning was initially studied by calculating and simulating
                           the loading capacities of each pollutant based on the highest concentration and the National technical
                           regulation in ambient air quality. The results show that the center of HCMC could not receive anymore
                           the emission, even needs to reduce half of the emission. Under the easterly prevailing wind in the dry
                           season, the high pollution was more likely to be experienced in the west of Ho Chi Minh. In contrast, the
                           eastern regions were the upwind areas and the pollutants could transport to the downwind sectors. It
                           was recommended that the best strategy for emission control in HCMC is avoiding industrial and urban
                           development in the upwind areas to achieve better air quality for both areas. In the case of necessity
                           to choose one area for development, the downwind sector is preferred. The results show that TAPM-
                           CTM performed well as applied to simulate the air quality in HCMC and is a promising tool to study the
                           emission zoning.

                           Ho Chi Minh City (HCMC), the largest city in Vietnam with its position as the political, economic, scientific and
                           cultural center of the country, is located at 10o45′N and 106o45′E in the south-eastern region of Vietnam. HCMC’s
                           economic growth rate has been skyrocketing in recent years. The population of HCMC is 8.6 million people, the
                           number of private vehicles is about 9 million units. Currently, there are 19 manufacturing and industrial zones, 30
                           industrial clusters on an area of 1,900 ha, and numerous factories and enterprises located separately in HCMC1,2.
                           All those activities could release a huge amount of air pollutants into the atmosphere.
                               Urbanization and economic development during the recent period in HCMC have caused numerous environ-
                           mental and social issues3. Many air pollutants in HCMC exceeded the National technical regulation in ambient
                           air quality (QCVN 05:2013, namely QCVN from now) including TSP, NOx, and CO1,4. These high pollutant con-
                           centrations were associated with an increase in the risk of human health in HCMC5–8. It is urgent to determine the

                           Institute For Environment and Resources, Vietnam National University in Ho Chi Minh City, Ho Chi Minh City,
                           Vietnam. *email: bangquoc@yahoo.com; thuynguyenktmt@gmail.com

Scientific Reports |   (2020) 10:5827 | https://doi.org/10.1038/s41598-020-62053-4                                                          1
www.nature.com/scientificreports/                                                              www.nature.com/scientificreports

                                   Emission (tons/year)
                            Year   NOx      CO            SO2      NMVOC     TSP      CH4
                            2017   50,386   3,533,982     12,919   602,625   8,545    15,957
                            2025   73,191   5,192,753     18,746   880,869   11,090   21,873
                            2030   81,824   5,863,397     21,071   993,562   12,175   24,068

                           Table 1. Total emissions in HCMC (tons/year) in HCMC in 2017, 2025 and 20301.

                           needed amount of emission reduction and the most polluted areas in the city to build the best abatement strate-
                           gies for the reduction of emission. This status has raised the concern of scientific communities and policymakers.
                           The combination of scientists and the city’s government is essential to make appropriate planning policies. The
                           environment-responsive strategies for developing economics require a comprehensive understanding of the local
                           environmental conditions. Studies of overall status and forecast of air pollution are very important to implement
                           these strategies. However, these studies in HCMC have still been patchy, quite dated9,10 and need to be updated.
                           In addition, the current emission in HCMC has not taken into account the pollutant loading capacities of the
                           atmosphere with the specific condition of the city. Only when determining this capacity for each region, can
                           policymakers be able to localize reasonable emission areas (defined as the emission zoning by us). Therefore, this
                           study aims at (i) Air quality modeling over HCMC by using the TAPM-CTM system model by using a bottom
                           up air emission inventory; and (ii) Study loading capactities of air pollutant emissions over Ho Chi Minh City.

                           Materials and Methods
                           Meteorological and air quality modelling.                The Air Pollution Model (TAPM), an easy-to-use and
                           fast-to-run model which is a feasible tool for meteorological and air pollution simulations, was developed by
                           Commonwealth Scientific and Industrial Research Organization - Commonwealth Scientific and Industrial
                           Research Organization (CRISO) of Australia11. TAPM has meteorological and air pollution module, in which the
                           consists of the former are parameterizations for cloud/rain microphysical processes, turbulence closure, urban/
                           vegetative canopy, and soil, and radiative fluxes and those of the later are various sub-modules including the
                           Eulerian Grid Module (EGM), the Lagrangian Particle Module (LPM), the Plume Rise Module (PRM) and the
                           Building Wake Module (BWM). Detail descriptions of the model were described by Hurley et al. (2005 and
                           2008)11,12. For simulations that require complex chemical transformation, CRISO developed an enhanced version
                           of TAPM referred to TAPM-CTM13. The advances of TAPM-CTM compared to TAPM analyzed thoroughly in
                           the study of Bang et al.14 in which the prognostic model provides the meteorological fields that drive dispersion of
                           emissions and pollutant concentrations in the chemical transport model CTM. The first version of TAPM model,
                           developed by Peter Hurley et al., has been developing since 1999. This model was continuously improved to ver-
                           sion 4 in 2008 to fix the problems of the previous version. The validation of TAPM model has been performed
                           through several comparative studies. For example, the comparison between the simulation of air quality for the
                           Port Phillip and the observed values at mornitoring stations of EPA Victotira, Australia15, between the silmulation
                           of PM10 and the observed values at mornitoring station Christchurch, New Zealand16. In recent years, TAPM-
                           CTM has been widey applied for simulating NO, NO2, and O3 in the Greater Metropolitan Region in New South
                           Wales, Australia17–21. This model was applied in HCMC to simulate the photochemical smog in HCMC in 201814.

                           Input data.      Input data of TAPM-CTM modeling system include two components: (i) the global meteorolog-
                           ical data from The Australian Community Climate and Earth-System Simulator (ACCESS) which are available
                           online and can be downloaded via CSIRO’s website, and (ii) air emission inventory data within the region under
                           consideration.
                               Emission data that have been completed and published were used as input to the air quality model1. A com-
                           prehensive of Emission Inventory (EI) in 2017 and emission forecast in 2025 and 2030 over HCMC including
                           point, line, area, and biogenic sources were conducted in that study. For line sources, the EMISENS (EMIssion
                           SENSitivity) model, a model combining the top-down and bottom-up approaches, was applied. For the other
                           sources (point, area and biogenic sources), a emission factor approach and survey data, was used to calculate
                           air emission. The air emission forecast until 2030 was calculated by using the data of strategies and plans for
                           the socio-economic development of HCMC in the period until 2030. The EI was calculated for NOx, SO2, CO,
                           NMVOC, TSP, and CH4 with a temporal resolution of one hour and a spatial resolution of 2,5 km × 2,5 km. The
                           total emission from four main sources of air pollutants in HCMC in 2017 and 2030 is presented in Table 1 1. In
                           general, emission in 2030 are expected to be significantly higher compared to 2017.

                           Modelling domains. Four domains were configured in this study (Fig. 1) including (i) the outer most
                           domain D1 characterizing the south of Vietnam (800 km × 800 km), (ii) the wider domain D2 characterizing
                           Mekong Delta (400 km × 400 km), (iii) the domain D3 characterizing HCMC and some neighboring provinces
                           (200 km × 200 km), and (iv) the subdomain D4 characterizing the main part of HCMC (100 km × 100 km). Each
                           domain was 40 by 40 grid with the resolution was 20, 10, 5, and 2.5 km for D1, D2, D3, and D4, respectively. The
                           three outer domains (D1, D2, D3) only simulated meteorology, the interior domain (D4) simulated both mete-
                           orology and chemical processes. The simulation results of the coarser revolution were the input data for the next
                           inner domain. For instance, the simulation results of D1 were the meteorological boundary conditions for the
                           D2. The size of the inner-most domain (D4) was set to be the same as the HCMC emission inventory domain. The
                           meteorological grids must be greater or equal to the emission grids; therefore, the emission inventory domain was
                           set 90 km by 90 km with 35 grids and the grid resolution was 2.5 km.

Scientific Reports |   (2020) 10:5827 | https://doi.org/10.1038/s41598-020-62053-4                                                           2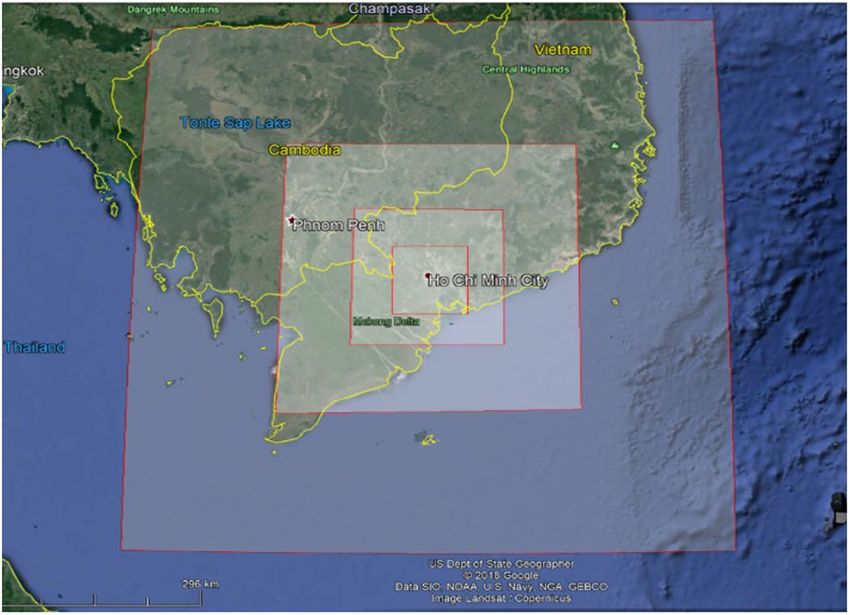
www.nature.com/scientificreports/                                                                    www.nature.com/scientificreports

                           Figure 1. TAPM-CTM modelling domains (D1, D2, D3 and D4).

                                                 February 2017      June 2017     February 2017       June 2017
                                                 Temperature (oC)                 Wind speed (m/s)
                                                 P      O           P      O      P   O               P   O
                            Mean                 27.1   28.1        31.6   30.2   2.2 1.8             2.4 1.7
                            Standard deviation    3.9    2.8         3.7    2.7   1.0 1.0             1.1 0.9
                            Min                  18.9   22.2        23.7   24.1   0.2 0.0             0.5 0.0
                            Max                  34.0   34.5        37.3   36.6   5.1 7               5.5 7.0

                           Table 2. Statistical parameters for hourly of modeling (P) and monitoring (O) temperature and wind speed at
                           Tan Son Hoa station.

                           Model evaluation. Statistical measures for model evaluation were proposed by several researchers in order
                           to evaluate the TAPM model’s performance12 and this approach also was used in our study by comparing the
                           modeled data with observations from the field. In which meteorological data at Tan Son Hoa station and air qual-
                           ity data at Nguyen Van Cu station were used to assess the TAPM and CTM model, respectively. More specifically,
                           statistical parameters including Pearson correlation coefficient (R) between observed (O) and predicted (P) val-
                           ues, mean value, standard deviation, minimum value (min), and maximum value (max) were used in this study.

                           Loading capacties. A technical approach, modeling tool, was utilize to calculate and simulate the loading
                           capacities of each pollutant in HCMC. Based on emission inventories and optimization of maximum total emis-
                           sion, under the criterion that target pollutant concentrations at monitoring sites meet national standards, the
                           loading capacities of each pollutant were determined. This approach was also applied to calculate atmospheric
                           environmental capacities in several studies22.

                           Results and Discusion
                           Model calibration and validation. Performance of Meteorological model - TAPM. Meteorological obser-
                           vation data from Tan Son Hoa station (10.7969oN, 106.6668oE) were used to calibrate and validate the perfor-
                           mance of the TAPM-CTM prediction. Surface temperature and wind speed were parameters that were evaluated
                           with observed data in this study. Statistical parameters for hourly of predicted (P) and observed (O) temperature
                           and wind speed at Tan Son Hoa station are presented in Table 2.
                               The predicted temperature for January to December 2017 correlated well with observed temperature as shown
                           in the time series plots and the regression analysis in Fig. 2, in which February and June represent for the dry
                           (Fig. 2a,b) and the rainy season (Fig. 2c,d), respectively.
                               Figure 2 and Table 2 shows that the model predicted well the surface temperature with 1.0 and 1.4 oC differ-
                           ence in February and June, respectively. Figure 2 shows that the value R between simulation and monitoring for

Scientific Reports |   (2020) 10:5827 | https://doi.org/10.1038/s41598-020-62053-4                                                        3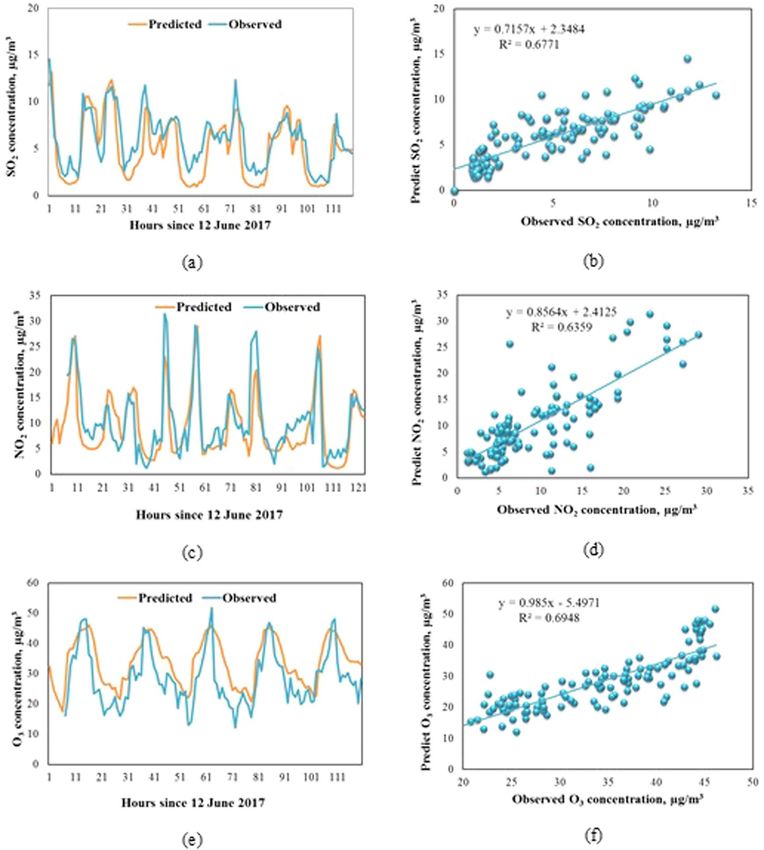
www.nature.com/scientificreports/                                                              www.nature.com/scientificreports

                           Figure 2. Predicted and observed surface temperature at Tan Son Hoa station: (a) Time series of observed and
                           predicted surface temperature in February 2017; (b) Regression analysis of observed (x-axis) and predicted
                           (y-axis) surface temperature in February 2017; (c) Time series of observed and predicted temperature in June
                           2017; (d)) Regression analysis of observed (x-axis) and predicted (y-axis) surface temperature in Jun 2017.

                           temperature 0.77 in February 2017 and 0.74 in June 2017 which is a good performance for temperature modeling.
                           However, TAPM slightly underestimated the temperatures during the dry season but a little overestimated during
                           the rainy season. This result also agreeded with the findings in Matthaios’s study in 2018 about the evaluation of
                           TAPMP model over a mountainous complex terrain industrial area23.
                              TAPM also simulated well the surface wind speed in the study area, with the mean values of both predicted
                           and observed wind speed were approximate 2 m/s during the study period. However, it slightly overestimated the
                           wind speed comparing with observed value and with 0.4 and 0.7 m/s difference in February and June, respectively,
                           which were the same ranges as those in Matthaios’s study23.

                           Performance of Air Quality model - CTM. The simulation results of air quality from the CTM model were vali-
                           dated with observed values at 03 locations: the University of Natural Science located at 227 Nguyen Van Cu street
                           (10.762549oN, 106.682428oE) in HCMC, the Tan Binh industrial Zone (10.804863oN, 106.637664oE) and Linh
                           Trung Exporting Zone (10.855993oN, 106.799454oE). Figure 3 and Table 3 present the performance of SO2, NO2,
                           and O3 from 12th to 17th June 172017.
                               Figure 3 and Table 3 show that the model predicted quite well the air quality with the correlations (R2) between
                           hourly concentrations of predicted and those of observed values were always nearly 0.7 for the fist location at the
                           University of Natural Science, for the second and third locations have the correlations (R2) between hourly con-
                           centrations of predicted and those of observed values were higher than 0.7. When considering the time series of
                           observed and predicted pollutant concentration, simulation results tend to be similar to actual monitoring results
                           with maximum and minimum values. The model predicted well the concentration of SO2 and NO2 with 1.0 and
                           1.1 µg/m3 difference, respectively. However, CTM slightly overestimated the concentration of O3. This result was
                           different from that of Bang’s study about the simulation of O3 in HCMC in 2015 (the research in 2015, air emis-
                           sion inventory results were used from top-down approach, therefore the results of modeling in 2015 have more
                           uncertainty than the current research using detail air emission inventory), in which the authors found that the
                           model overall underpredicted the ozone prediction at Nguyen Van Cu site1. This difference could be understood
                           because the period when Bang et al. compared the observed and predicted ozone concentrations was the dry sea-
                           son when high pollution usually happens in HCMC1; whereas the comparison of those in this study was the wet
                           season when the lower concentrations of pollutants are found. This indicated that the TAPM-CTM model tends
                           to underestimate the concentrations in the highly polluted periods and overestimate in the little polluted ones.
                               In addition, The monitoring site that we used for validation models for the metrological condition was differ-
                           ent from that for the air pollutants. However it doesn’t affect the research because the TAPM-CTM could provide
                           the simulation results for each point. We can select any point in our domain for meteorological and air quality
                           validation.

Scientific Reports |   (2020) 10:5827 | https://doi.org/10.1038/s41598-020-62053-4                                                           4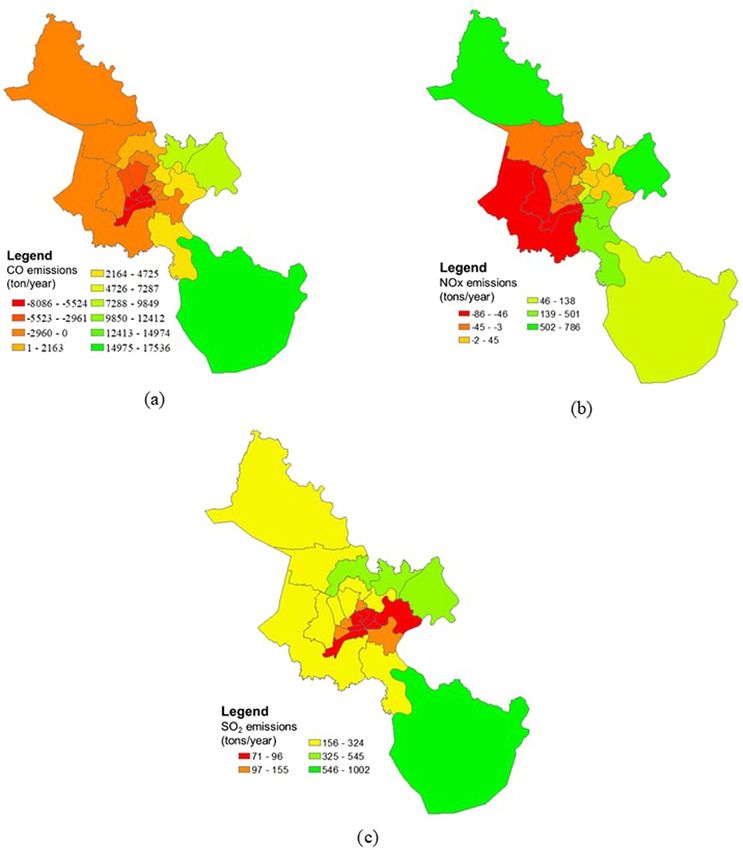
www.nature.com/scientificreports/                                                             www.nature.com/scientificreports

                           Figure 3. Predicted and observed air quality at Nguyen Van Cu station from 12 to 17 June 2017: (a) Time series
                           of observed and predicted SO2 concentration; (b) Regression analysis of observed (x-axis) and predicted (y-axis)
                           SO2 concentration; (c) Time series of observed and predicted NO2 concentration; (d)) Regression analysis
                           of observed (x-axis) and predicted (y-axis) NO2 concentration; (e) Time series of observed and predicted O3
                           concentration; (b) Regression analysis of observed (x-axis) and predicted (y-axis) O3 concentration.

                                                 SO2            NO2            O3
                                                 P       O      P       O      P       O
                            R2                   0.677          0.636          0.695
                            Mean                 4.9     5.9    9.4     10.5   34.0    28.5
                            Standard deviation   3.3     2.8    6.4     6.9    7.9     9.0
                            Min                  0.9     1.4    1.2     1.2    17.5    12.2
                            Max                  13.2    14.5   29.0    31.4   46.2    51.8

                           Table 3. Statistical parameters for hourly of predicted (P) and observed (O) SO2, NO2, and O3 at Nguyen Van
                           Cu station.

                           Simulation of air quality in HCMC. Simulation of air quality in HCMC in 2017. After evaluating the
                           model, simulation the air quality for each month in 2017 was conducted to determine the areas and period

Scientific Reports |   (2020) 10:5827 | https://doi.org/10.1038/s41598-020-62053-4                                                       5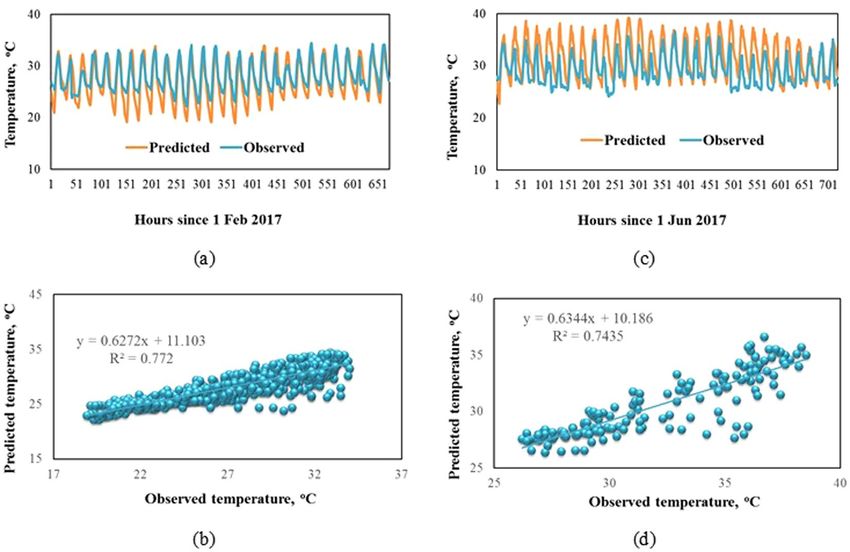
www.nature.com/scientificreports/                                                            www.nature.com/scientificreports

                           Figure 4. The high concentrations of CO: (a) eight-hour average concentration in Jan 2017; (b) eight-hour
                           average concentration in Oct 2017, (c) eight-hour average concentration in Nov 2017; (d) eight-hour average
                           concentration in Dec 2017.

                           having a high concentration of pollutants. The simulation results included all of one-hour, eight-hour, and twenty
                           four-hour average concentration of each pollutant, in which CO, NO2, and SO2 were the primary pollutant group
                           and O3 was the secondary pollutant group.
                               The primary pollutants. The high concentrations of CO are presented in Fig. 4, in which, Fig. 4a is the
                           eight-hour average concentration in Jan 2017, Fig. 4b is the eight-hour average concentration in Oct 2017, Fig. 4c
                           is the eight-hour average concentration in Nov 2017 and Fig. 4d is the eight-hour average concentration in Dec
                           2017.
                               Generally, the one-hour average concentration of CO did not exceed the standard of QCVN, in which the
                           concentrations of CO from February to August were relatively lower than those in remaining months. However,
                           the eight-hour average concentrations in October, November, December, and January reached from 12,000 ppb
                           to 14,000 ppb (about 13,560–15,820 µg/m3) exceeding QCVN (10,000 µg/m3) from 1.3 to 1.5 times. The highest
                           one-hour average concentration of CO was 26,000 ppb (29,380 µg/m3) in November 2017 that was approximate
                           the standard of QCVN (30,000 µg/m3). In this day, the eight-hour average concentration of CO reached 14,000
                           ppb (15,820 µg/m3) that was 1,5 times higher than the standard of QCVN. The highest concentration of CO also
                           was about 2 time higher than that previous studies10,11 that could be due to their usage of different model and
                           different EI method. The more comprehensive calculation of EI including line, area, point, and biogenic sources
                           were conducted in our study. In which, the traffic sources consisted both on-road and non-road source having
                           the airport, seaport, and bus and railway station, the area source included households, restaurants, gas stations,
                           constructions sites, photocopy stores, construction material stores, pagodas, and garages1. The plume of CO was
                           located in the center of HCMC where CO was mainly emitted1.

Scientific Reports |   (2020) 10:5827 | https://doi.org/10.1038/s41598-020-62053-4                                                         6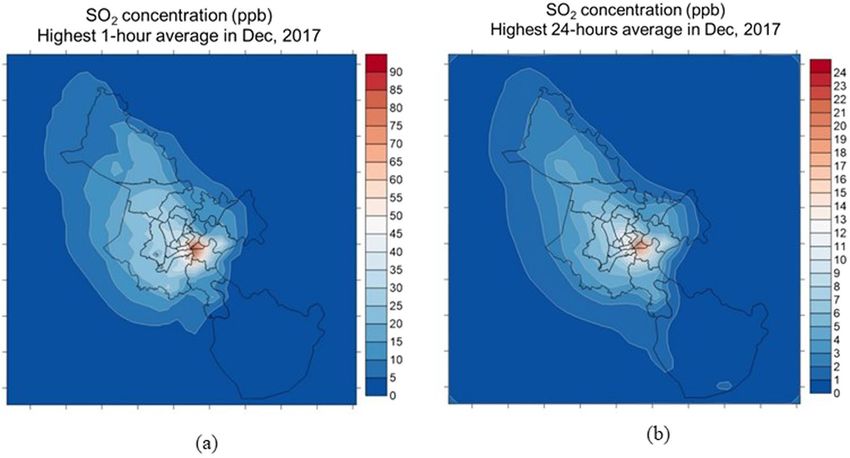
www.nature.com/scientificreports/                                                              www.nature.com/scientificreports

                           Figure 5. The high concentrations of NO2: (a) eight-hour average concentration in Jan 2017; (b) eight-hour
                           average concentration in Oct 2017, (c) eight-hour average concentration in Nov 2017; (d) eight-hour average
                           concentration in Dec 2017.

                               The high concentrations of NO2 are presented in Fig. 5, in which, Fig. 5a is the one-hour average concentration
                           in Jan 2017, Fig. 5b is the one-hour average concentration in Oct 2017, Fig. 5c is the one-hour average concentra-
                           tion in Nov 2017 and Fig. 5d is the one-hour average concentration in Dec 2017.
                               Similar with CO, the high one-hour average concentration of NO2 occurred in January, October, November,
                           and December that were 135; 110; 170; and 120 ppb, respectively. The hourly concentrations of other months
                           were from 42 to 65 ppb. The highest hourly concentration of NO2 was recorded in 17th November 2017 with the
                           value of 170 ppb (equivalent 200 µg/m3) exceeding QCVN (10,000 µg/m3) 1.5 times. The highest concentration of
                           NO2 also was from 1.3 to 1.9 time higher than that previous studies6,8 that could be explained by using a different
                           model and different EI method mentioned above. The plume of NO2 also located in the center of HCMC having
                           the dense transportation system and seaport1.
                               The highest concentrations of SO2 are presented in Fig. 6a, in which, Fig. 6a is the one-hour average concen-
                           tration in Dec 2017, Fig. 6b is the one24-hour average concentration in Dec 2017.
                               Generally, the all highest concentrations of SO2 was lower than the standard in QCVN, in which the high-
                           est one-hour average concentration and 24-hour average concentration was 90 and 24 ppb (equivalent 232 and
                           61.9 µg/m3), respectively. The highest concentration of SO2 in this study also was about 1.5 times higher than that
                           in Dung’s study7 that was similar to other primary pollutants above. The plume of SO2 located at district 2 and dis-
                           trict 4 having many seaports, other urban and the suburban area was lower than 40 ppb and 25 ppb, respectively.
                               The secondary pollutant. The highest concentrations of ozone are presented in Fig. 7, in which, Fig. 7a is the
                           one-hour average concentration and Fig. 7b is the eight-hour average concentration.

Scientific Reports |   (2020) 10:5827 | https://doi.org/10.1038/s41598-020-62053-4                                                           7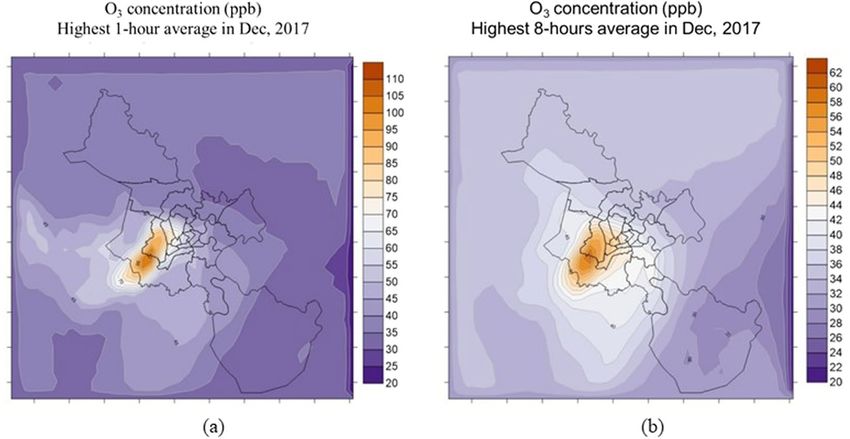
www.nature.com/scientificreports/                                                            www.nature.com/scientificreports

                           Figure 6. The high concentrations of NO: (a) one-hour average concentration in Dec 2017; (b) 24-hour average
                           concentration in Dec 2017.

                           Figure 7. The highest concentrations of ozone: (a) one-hour average concentration; (b) eight-hour average
                           concentration.

                               The high hourly ozone concentrations were from 53 to 110 ppb, in which the concentrations in the last months
                           of the year were higher than those of the first months. The highest concentrations were recorded in 13th December
                           2017 that was the beginning of the dry season. The one-hour average concentration of ozone reached 110 ppb
                           (equivalent to 220 µg/m3) exceeding about 1.1 times of the National technical regulation in ambient air quality
                           standard (QCVN). The eight-hour average concentration of ozone also was recorded in this day with the value
                           of 62 ppb (equivalent to 124 µg/m3) that was higher than that in QCVN (120 µg/m3). The ozone plume tended
                           to move southwestward of the city, only a few times in May and August, the plume pushed to the northwest or
                           northeast of HCMC. The results of ozone simulation in this study were compared with those in other studies
                           presented in Table 4.
                               Table 4 shows that the dominant plume pattern of ozone in this study was similar to that in other studies;
                           however, there was a difference in the maximum concentration of ozone in these studies. The maximum con-
                           centration in this study was about 2 times higher than that in other studies except for Bang’s study in 2011. This
                           difference could be explained by using different models and input data explained above.

Scientific Reports |   (2020) 10:5827 | https://doi.org/10.1038/s41598-020-62053-4                                                         8
www.nature.com/scientificreports/ www.nature.com/scientificreports
Prevailing wind Plume Maximum
Studies Conducted period EI method Model direction direction concentration
Top-down approach, data were collected from
(Nghiem, 2009)24 Three days in Jan 2005 CMAQ-MM5 Northerly Southwest 50 ppb
satellite image (MODIS) in 2005
Top-down and bottom-up approach, data were
(Dung, 2009)10 Two days in Jan 2006 calculated for on-road, industrial, and domestic FVM-TAPOM Northerly Southwest 75 ppb
sources
Top-down and bottom-up approach, data were
Northern and
(Bang, 2011)11 Three days in Feb 2006 calculated for on-road, industrial, and domestic FVM-TAPOM Easterly 150 ppb
Northwestern
sources
Top-down and bottom-up approach, data were
Entire one-month period in
(Bang, 2018)15 calculated for traffic, industrial, household, and TAPM-CTM Northerly Southwest 65 ppb
Jan 2015
biogenic sources
Top-down and bottom-up approach, data were
Entire 1-year period in 2017, calculated for line source (including on-road and
This study the maximum concentration non-road such as airport, seaport, and bus station; TAPM-CTM Northerly Southwest 110 ppb
occurred in Dec 2017 area sources including household, restaurants, gas
station, etc.; point sources and biogenic sources
Table 4. Comparison results of ozone simulations in HCMC with other studies.
Air pollution forecast for Ho Chi Minh City in 2025 and 2030. Based on the data of strategies and plans for
socio-economic development of HCMC in the period 2025 and 2030, the simulations of air quality for 2025 and
2030 were conducted in order to forecast how the future growth impact to the air quality.
For the year of 2025, if HCMC continues to develop the socio-economic plan, the air quality will become
worse. The one-hour and eight -hour average concentration of ozone will be 230 µg/m3 and 144 µg/m3 exceeding
the standard of QCVN 1.15 and 1.20 times, respectively. The one-hour and eight -hour average concentration of
CO will reach 31,640 µg/m3 and 18,080 µg/m3 exceeding the standard of QCVN 1.05 and 1.80 times, respectively.
The one-hour average concentration of NO2 also will be 297 µg/m3 exceeding the standard of QCVN 1.50 times.
Only SO2 concentration will meet the QCVN standard.
According to the development plan of HCMC by 2030, the air pollution situation will become more serious.
The one-hour and eight-hour average concentration of CO and O3 will be 1.7 and 1.15 times higher than the
standard of QCVN, respectively. The highest hourly concentration of NO2 will reach 180 ppb (equivalent 334 µg/
m3) exceeding the QCVN 1.57 times. Especially, the highest hourly concentration of SO2 also will be 1.02 times
higher QCVN.
Loading capacities of air emissions in HCMC. It is obvious that if HCMC does not have a good plan
to develop the social and economics, the air pollution situation in this city will become worse. Determining the
pollutant loading capacities for each small area could help policy-makers to improve efficiency in building the
abatement strategies. Therefore, in this study, we initially studied the emission zoning (or loading capactities) for
HCMC. From the simulation results of air quality above, areas were zoned by comparing with the QCVN. For
areas with lower concentrations than QCVN, we increased the emission for each grid until to meet the standard.
For areas with higher than QCVN, we reduced the emission for each grid until to meet the standard. In the calcu-
lation process, we also took into account the long-range transport based on the meteorological simulation results.
For example, if the polluted area (A) was caused by emissions from the neighboring area (B), the B area would be
diminished the emissions to reduce pollutant concentration at A area. We also considered the ability to increase
emissions at A to determine whether the pollutant concentration in this area to increase or not.
After calculating and simulating, we found that in order to control the air quality to meet the standard of
QCVN, HCMC needs to reduce emissions for NO2 and CO 1.58 times, equivalent to 58%. Beside, HCMC also
has the ability to receive 1.51 times of additional SO2 emissions, equivalent 51% in the future to ensure that the
SO2 concentration will meet the standards.
The emission zoning of each pollutant are presented in Fig. 8, in which, Fig. 8a is the emission zoning of CO,
Fig. 8b is the emission zoning of NO2, and Fig. 8c is the emission zoning of SO2.
For CO, it is necessary to reduce emissions in the central districts and the northern, the western suburban
districts. Specifically, the areas that need to reduce the most CO emission are District 10, District 11, District 5,
District 6 and District 8, which require a reduction of 5,500–8,000 tons/year.km−2; Tan Binh and Tan Phu districts
need to reduce 3,000 to 5,500 tons/year.km−2; District 7, District 4, District 1, District 3, Phu Nhuan District Cu
Chi, Hoc Mon, Binh Chanh and Binh Tan, and Go Vap are necessary to reduce emissions by 3,000 tons/year.
km−2. The districts could receive additional CO emissions as follows: District 12 might increase 2,100 tons/year.
km−2, Binh Thanh, District 2, Nha Be could increase to 7,200 tons/year.km−2, Thu Duc and District 9 might
increase by 9,800 tons/year.km−2, and Can Gio area could increase to 17,500 tons CO/year.km−2. However, Can
Gio is the city’s biological reserve area; therefore, the emission addition should be considered.
For NOx, the western areas of the city including District 8, Binh Tan and Binh Chanh need to be reduced
from 46–86 tons/year.km−2; District 10, District 3, District 5, District 6, District 11, Tan Phu, Tan Binh, Go Vap,
District 12, and Hoocmon need to reduce from 3 to 45 tons/year.km−2. The remaining areas can receive NOx
additional emissions with the amount of 45–500 tons/year.km−2, in which Cu Chi and District 9 are the two areas
that can receive more NOx emission. The maximum possible level of these areas could be reached about 500–786
tons/year.km−2.
Scientific Reports | (2020) 10:5827 | https://doi.org/10.1038/s41598-020-62053-4 9www.nature.com/scientificreports/ www.nature.com/scientificreports
Figure 8. The emission zoning: (a) the emission zoning of CO; (b) the emission zoning of NO2; (c) the emission
zoning of SO2.
Generally, SO2 concentration is lower than the standard of QCVN; therefore, SO2 could be added to the
atmosphere as follows: areas of downtown districts such as Districts 1, District 3, District 4, District 10, District
5, District 8, District 2 could be increased about 71–96 tons/year.km−2; District 7, Phu Nhuan, District 11, and
District 6 might add 97–155 tons/year.km−2; the suburban districts could receive from 156 to 545 tons/year.km−2;
Can Gio might receive the largest amount of SO2 being from 546–1,002 tons/year.km−2.
For VOCs, the current emission was maintained because VOCs relate to O3 generation reactions. With the
current scenario, the highest O3 concentration already exceeded QCVN. After simulating the NOx reduction sce-
nario by keeping the VOCs emission, the O3 concentration also reduced to meet the standard. Therefore, it is not
advisable to add VOC’s emission to the central districts and the western districts of HCMC because these areas
had eight-hour average concentration that approximates the QCVN.
In general, the central areas of HCMC need to reduce half emissions. The city’s government need to consider
reducing the number of private vehicles in the city because this is the main source of air1. The areas of Binh Chanh
and Binh Tan districts have lower emissions than the central areas. However, these areas are influenced by the pol-
lutant plumes from the center due to the wind from the East Sea. In November and December, this area often has
higher concentrations of pollutants exceeding the QCVN. In contrast, the air polluatants in Thu Duc and District
9 could transport to the downwind sector because of wind from the East Sea could blow pollutant plumes from
these areas to the west and northwest of the city. Therefore, HCMC city should restricted industrial and urban
development in the these areas in term of emission control. If it is necessary to choose one area for development,
Scientific Reports | (2020) 10:5827 | https://doi.org/10.1038/s41598-020-62053-4 10www.nature.com/scientificreports/ www.nature.com/scientificreports
the downwind sector is preferred. Can Gio area is the place with the lowest pollutant concentration and has the
ability to receive the highest emissions. However, this area is the biosphere reserve of the city. Therefore, this
area should be kept the status without developing the urbanization and industry. This research did not take into
account the transboundary transportation of air pollutants. The further studies including both the local and
long-range sources need to be considered to get the more realistic simulation results of air quality in HCMC.
Conclusions
An air quality simulation for CO, NO2, SO2, and O3 over HCMC was conducted in this paper by using the
TAPM-CTM model. Overall, the simulation for air quality performed reasonably well in predicting the pollutant
levels in 2017. Based on the simulation results of the current status of air quality, it is obvious that the period of
high pollution usually is in the last months of the year. This time is the late of the rainy season with low rainfall
and the weather is unfavorable to diffuse pollutants, resulting in the highest one-hour average concentration for
NO2 and O3, the highest eight-hour average concentration for CO exceeding the standard of QCVN 1.5, 1.1, and
1.5 times, respectively. Only the concentration of SO2 was lower than the standard.
The air quality forecasts for HCMC by 2025 and 2030 also were simulated based on the data of strategies
and plans for socio-economic development of the city. The results showed that both the highest one-hour and
eight-hour average concentration of O3, CO, and NO2 were higher than QCVN by the year 2025 and 2030.
Especially, if HCMC continues to develop the socio-economic plan, the highest hourly concentration of SO2 also
will be 1.02 times higher QCVN by the year of 2030.
The emission zoning were initially studied by calculating and simulating the loading capacities of each pollutant.
Generally, the downtown HCMC need to reduce about half of emission; therefore, city authorities should consider
stopping the development of industry and urbanization of this area. In addition, it is necessary to reduce the number
of private vehicles in this area because this is the main source of pollution. The eastern areas of the city also need to
limit the development of industry and urbanization due to the wind from the East Sea blows the pollutants to the
west and the north. In the case of necessity to choose one area for development, the downwind sector is preferred.
We also proposed keeping the status of Can Gio area although this area could receive more additional emission
because Can Gio is the biosphere reserve of the city in particular and of the country in general.
Received: 7 October 2019; Accepted: 24 February 2020;
Published: xx xx xxxx
References
1. Bang, H. Q., Khue, V. H. N., Tam, N. T., Thuy, N. T. T. & Hang, N. T. T. A combination of bottom-up and top-down approaches for
calculating of air emission for developing countries: A case of ho chi minh city, vietnam. Air Quality, Atmosphere & Health. https://
doi.org/10.1007/s11869-019-00722-8 (2019).
2. HCMC’s Committee. Hcmc’s socio-economic situation report in 2017, tasks, and solutions for 2018 (2017).
3. Fan, P. et al. Urbanization, economic development, environmental and social changes in transitional economies: Vietnam after
Doimoi. Landscape and Urban Planning 187, 145–155 (2019).
4. Luong, L. T. M. et al. Particulate air pollution in Ho Chi Minh city and risk of hospital admission for acute lower respiratory
infection (ALRI) among young children. Environmental Pollution Inpress (2019).
5. MONRE. National state of environment report 2016 on air quality vietnam environment administration (2017).
6. HEI. Effects of short-term exposure to air pollution on hospital admissions of young children for acute lower respiratory infections
in ho chi minh city, vietnam. Health Effects Institute, Boston, MA (2012).
7. Mehta, S. et al. Air pollution and admissions for acute lower respiratory infections in young children of ho chi minh city. air Quality,
Atmosphere & Health 6(1), 167–179 (2013).
8. Bang, H. Q. Modeling pm10 in ho chi minh city, vietnam and evaluation of its impact on human health. Sustainable Environment
Research 27(2), 95–102 (2017).
9. Luong, L. T. M. et al. Particulate air pollution in Ho Chi Minh city and risk of hospital admission for acute lower respiratory
infection (ALRI) among young children. Environmental Pollution (2018).
10. Dung, H. M. & Thang, D. X. Modeling air quality in hochiminh city and scenarios for reduction air pollution levels. VNU journal of
science Earth Science 25(01), 179–191 (2009).
11. Bang, H. Q., Clappier, A. & François, G. Air pollution forecast for ho chi minh city, vietnam in 2015 and 2020. Air Quality,
Atmosphere & Health 04(02), 145–158 (2011).
12. Hurley, P. The air pollution model (tapm) version 4. Part 1: Technical description. CSIRO Marine and Atmospheric Research report
Paper No. 25 (2008).
13. Hurley, P. J., Physick, W. L. & Luhar, A. K. Tapm: A practical approach to prognostic meteorological and air pollution modelling.
Environmental Modelling & Software 20, 737–752 (2005).
14. Cope, M. & Lee, S. Chemical transport model – user manual CAWCR Technical Report No. 016 (2009).
15. Bang, H. Q., Hiep, N. D., Khue, V. & Hien, T. T. Photochemical smog modelling using the air pollution chemical transport model
(tapm-ctm) in ho chi minh city, vietnam. Environmental Modeling & Assessment Springer International Publishing: 1–16 (2018).
16. Hurley, P. et al. Year-long, high-resolution, urban airshed modelling: verification of TAPM predictions of smog and particles in
Melbourne, Australia. Atmospheric Environment 37, 1899–1910 (2003).
17. Zawar-Reza, P., Kingham, S. & Pearce, J. Evaluation of a year-long dispersion modelling of PM10 using the mesoscale model TAPM
for Christchurch, New Zealand. Science of The Total Environment 349(1–3), 249–259 (2005).
18. Metia, S. Using TAPM-CTM for air quality monitoring in in the New South Wales using TAM-CTM for simulating NO, NO2, and
O3 in the Greater Metropolitan Region in New South Wales, Australia (2020).
19. Metia, S. Using TAM-CTM for simulating NO, NO2, and O3 in the Greater Metropolitan Region in New South Wales, Australia (2016).
20. Metia, S. Using TAMP-CTM for simualting NO2 in the Greater Metropolitan Region in New South Wales, Australia (2018).
21. Wahid, H. Using TAMP-CTM for simualting NOx and O3 in the Greater Metropolitan Region in New South Wales, Australia (2013).
22. Xu, D. H., Wang, Y. & Zhu, R. Atmospheric environmental capacity and urban atmospheric load in mainland China. Science China
Earth Sciences 61(1), 33–46 (2018).
23. Matthaios, V. N., Triantafyllou, A. G., Albanis, T. A., Sakkas, V. & Garas, S. Performance and evaluation of a coupled prognostic
model tapm over a mountainous complex terrain industrial area. Theoretical and Applied Climatology 132(3–4), 885–903 (2018).
24. Nghiem, L. H. & Oanh, N. T. K. Regional-scale modeling ozone air quality over the continental south east asia. Development of
Science and Technology Journal 12(02), 111–120 (2009).
Scientific Reports | (2020) 10:5827 | https://doi.org/10.1038/s41598-020-62053-4 11www.nature.com/scientificreports/ www.nature.com/scientificreports
Acknowledgements
This researchis funded by Vietnam National University Ho Chi Minh City (VNU-HCM) under grant number
B2019-24-01.
Author contributions
Prof. Bang Quoc Ho contributes as coordinator for whole research. MSc. Khue Hoang Ngoc Vu contributes to
simulate air quality in 2017. MSc. Tam Thoai Nguyen contributes to simulate air quality in 2025. MSc. Hang Thi
Thuy Nguyen contributes to simulate air quality in 2030. Dr. Thuy Thi Thu Nguyen contributes to coordinator
the air quality group to prepare this manuscript and Dr. Nguyen Nhu Hien and Dr. Dung Minh Ho contributes to
prepare the air emission input files for air quality simulations.
Competing interests
The authors declare no competing interests.
Additional information
Correspondence and requests for materials should be addressed to B.Q.H. or T.T.T.N.
Reprints and permissions information is available at www.nature.com/reprints.
Publisher’s note Springer Nature remains neutral with regard to jurisdictional claims in published maps and
institutional affiliations.
Open Access This article is licensed under a Creative Commons Attribution 4.0 International
License, which permits use, sharing, adaptation, distribution and reproduction in any medium or
format, as long as you give appropriate credit to the original author(s) and the source, provide a link to the Cre-
ative Commons license, and indicate if changes were made. The images or other third party material in this
article are included in the article’s Creative Commons license, unless indicated otherwise in a credit line to the
material. If material is not included in the article’s Creative Commons license and your intended use is not per-
mitted by statutory regulation or exceeds the permitted use, you will need to obtain permission directly from the
copyright holder. To view a copy of this license, visit http://creativecommons.org/licenses/by/4.0/.
© The Author(s) 2020
Scientific Reports | (2020) 10:5827 | https://doi.org/10.1038/s41598-020-62053-4 12You can also read