Guía de densidad para el manejo de rodales naturales de
←
→
Page content transcription
If your browser does not render page correctly, please read the page content below
Revista Mexicana de Ciencias Forestales Vol. 12 (64)
                                               Marzo – Abril (2021)

                                                         DOI: https://doi.org/10.29298/rmcf.v12i64.822
                                                                                                      Article
                Guía de densidad para el manejo de rodales naturales de
                              Pinus rudis Endl. en Oaxaca
                  Density management guide for natural stands of Pinus
                                rudis Endl. in Oaxaca
               Daniel Martínez Santiago1*, Prudencia Caballero Cruz2, Eduardo Filio Hernández1,
               Alejandro Garzón Trinidad1, Rosalino Ortiz Barrios1, Octavio Lemuel Cruz Santiago1,
               Ithaiz Aparicio Cuevas1 y Carmela Sandoval García1
Resumen
La densidad forestal asociada con la calidad de sitio determina la productividad del bosque, y su medición
permite predecir tasas de crecimiento y mortalidad. El manejo a través de aclareos mejora las características
del bosque, ya que reduce la competencia entre individuos. El propósito del presente estudio, fue construir
una guía de densidad para el manejo de rodales naturales de Pinus rudis en la región Mixteca de Oaxaca,
México. El índice de densidad de Reineke (IDR) se calculó a partir de los diámetros cuadráticos y número
de árboles por hectárea de 81 sitios de muestreo de dimensiones variables, ubicados en masas puras, de
ocupación completa y diferentes etapas de crecimiento. El factor de competencia de copas (FCC) se estimó
mediante el ajuste del modelo de regresión lineal simple, con datos del diámetro normal-diámetro de copa
de 54 árboles sin presencia de plagas o enfermedades, defectos físico-mecánicos y que estaban creciendo
libres de competencia. El ajuste del modelo de Reineke y el de regresión lineal simple se realizó con la
técnica de Mínimos Cuadrados Ordinarios. A partir del IDR y el FCC se construyó una guía de densidad, con
la cual se determinó que los rodales objeto de estudio presentan niveles de densidad por arriba de 90 % de
IDR, con un diámetro cuadrático de 15 cm.
Palabras clave: Aclareos, competencia, factor de competencia de copas, índice de densidad de Reineke,
manejo forestal, silvicultura.

Abstract
Forest density associated with site quality determines forest productivity and its measurement allows
prediction of growth and mortality rates. Management through thinning improves forest characteristics by
reducing competition between trees. The aim of the present study was to construct a density guide for the
management of natural stands of Pinus rudis, in the Mixteca region of Oaxaca, Mexico. The Reineke's Stand
Density Index (SDI) was estimated from the quadratic diameters and number of trees per hectare of 81
variable size sampling sites, located in pure forest, with full occupation and different development stages of
forest stands. The Crown Competition Factor (CCF) was estimated by fitting the simple linear regression
model with normal diameter-crown diameter data from 54 healthy trees, without physical-mechanical
defects and that grown without competition. The adjustment of the Reineke model and that of simple linear
regression was carried out using the ordinary least squares technique. The density guide was developed
through SDI and CCF, these measurements allowed to know that the stands under study have density levels
higher than 90 % of the SDI, with a quadratic diameter of 15 cm.
Key words: Thinning, competition, crown competition, Reineke’s density index, forest management, forestry.

Fecha de recepción/Reception date: 22 de agosto de 2020
Fecha de aceptación/Acceptance date: 10 de diciembre de 2020
_______________________________
1Tecnológico Nacional de México/Instituto Tecnológico Superior de San Miguel el Grande. México.
2Centro de Investigación, Divulgación, Asesoría Técnica Forestal y
                                                       Agropecuaria S. C. México.
*Autor por correspondencia; correo-e: masd8510@gmail.com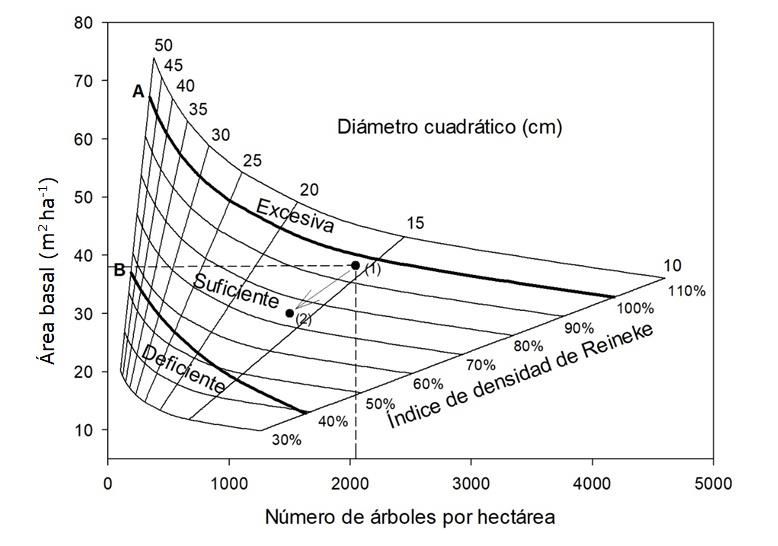
Martínez et al., Density management guide for natural...

                                  Introduction
Density management guides or diagrams are an important forest management tool
which serves as an instrument for determining the optimum number of individuals
that grow in a stand at different stages of development (Navarro et al., 2011). In
addition, they can increase timber productivity through good planning and monitoring
of forestry interventions (Gezan et al., 2007; Hernández et al., 2013).

There are absolute and relative methods to assess the density of a stand or
plantation; the former refer to the number of trees and basimetric area per hectare
and provide an estimate of the number of individuals present in a population but do
not provide information about competition on the site (Torres and Velázquez, 2000).
Relative indexes, such as Reineke's Stand Density Index (SDI) (Reineke, 1933),
Yoda's Density Index (YDI) (Yoda et al., 1963), tree-area ratio (TAR) (Chisman and
Schumacher, 1940), crown competition factor (CCF) (Krajicek et al., 1961), and
relative density (Curtis, 1970) describe the level of stand density and serve as
indicators of the need for silvicultural treatments in the forest (Torres and Velázquez
2000; Torres and Magaña, 2001).

The SDI is one of the most widely used measures of relative density in the
construction of density guides or diagrams (Tamarit et al., 2020); it is based on the
functional relationship between the number of trees per hectare of a stand and its
quadratic diameter (Quiñonez et al., 2017; Tamarit et al., 2020). Based on this, self-
thinning lines have been generated for conifer, broadleaf and mixed-species forests
(Gezan et al., 2007; Navarro et al., 2011; Santiago et al., 2013; Quiñonez et al., 2017;
Tamarit et al., 2018).

The first density guide was developed by Gingrich (1967) for leafy taxa in the central
states of the United States of America. In Mexico, such a guide was first generated in
the 1980s, with authors such as Zepeda and Villareal (1987), who developed one
such guide for Pinus hartwegii Lindl. in the center of the country. Márquez and Álvarez
(1995) constructed a guide for the management of Pinus cooperi var. ornelasi
(Martínez) Blanco stands in Durango, and García et al. (1996), one for the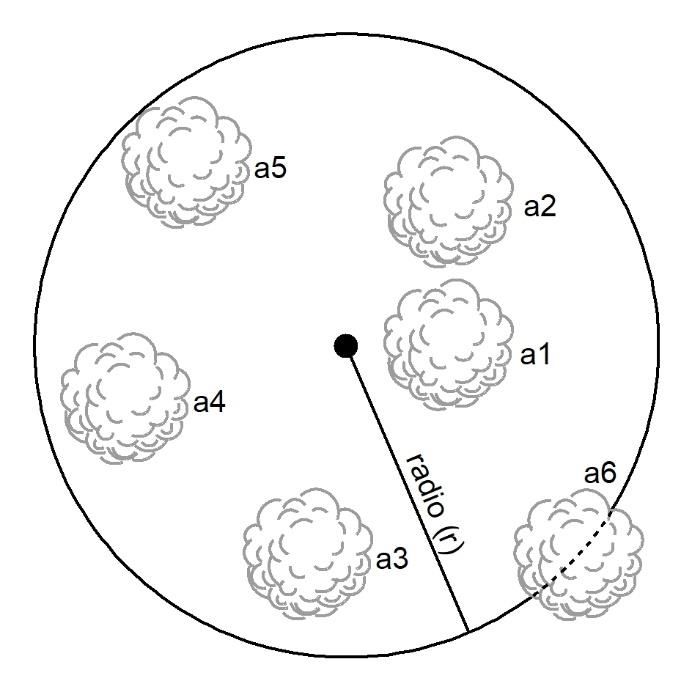
Revista Mexicana de Ciencias Forestales Vol. 12 (64)
Marzo – Abril (2021)
management of Swietenia macrophylla King plantations in the state of Quintana Roo.
In the former cases, the density indices used were TAR, CCF, and SDI.
Santiago et al. (2013) and Tamarit et al. (2018) constructed density plots for Pinus patula
Schiede ex Schltdl. & Cham. in the states of Hidalgo and Puebla, respectively; Quiñonez et
al. (2017) did the same for the mixed forests of northern Mexico. The development of these
tools has been mainly for prescribing thinning for timber production purposes.
Pinus rudis Endl. is a species widely distributed in the Mexico, in an altitudinal range
of 2 200 to 3 300 m, although it is possible to find it above 3 300 masl. The height of
its individuals varies between 20 and 30 m, and their diameter, between 40 and 70
cm. It is associated with Pinus ayacahuite Ehrenb. ex Schltdl., P. montezumae Lamb.
and P. hartwegii. Its timber is used mainly for construction purposes (Perry, 1991).
Between 1998 and 2005, several populations of P. rudis were affected by forest fires in
the agrarian community of San Miguel El Grande, in the Mixteca region of Oaxaca
(Martínez, 2009). Consequently, these areas have a high density of post-fire natural
regeneration (Caballero et al., 2018). In this context, the objective of this study was to
construct a density guide for the management of natural stands of Pinus rudis in the
Mixteca region of Oaxaca, Mexico.
Materials and Methods
Study area
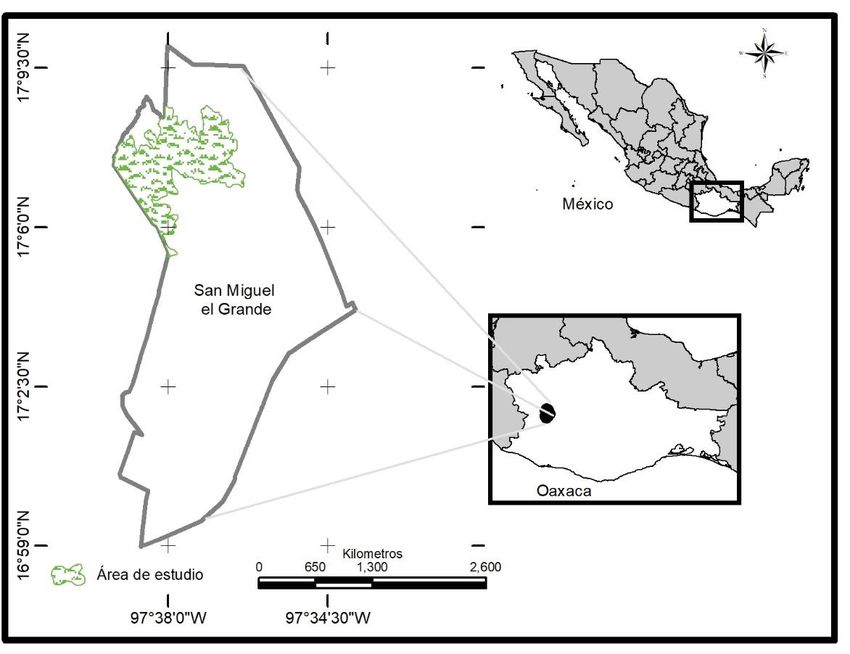
The agrarian community of San Miguel El Grande is located in western Oaxaca, at an
altitude ranging from 2 200 to 3 330 m, between 16°58'29" and 17°10'27" N, and
97°33'23" and 97°40'21" W. The study was conducted in the natural distribution area
of P. rudis, in an area of approximately 1 242 ha (Figure 1). The predominant types
of climates in the community are Cb’(w2) and C(c2), with summer rains (García,
1998). The soil types are regosols, lithosols, and vertisols (INEGI, 2014). The
vegetation is represented by pine and pine-oak forests (INEGI, 2016), where the main
species of conifers are Pinus oaxacana Mirov, P. pseudostrobus Lindl., P. douglasiana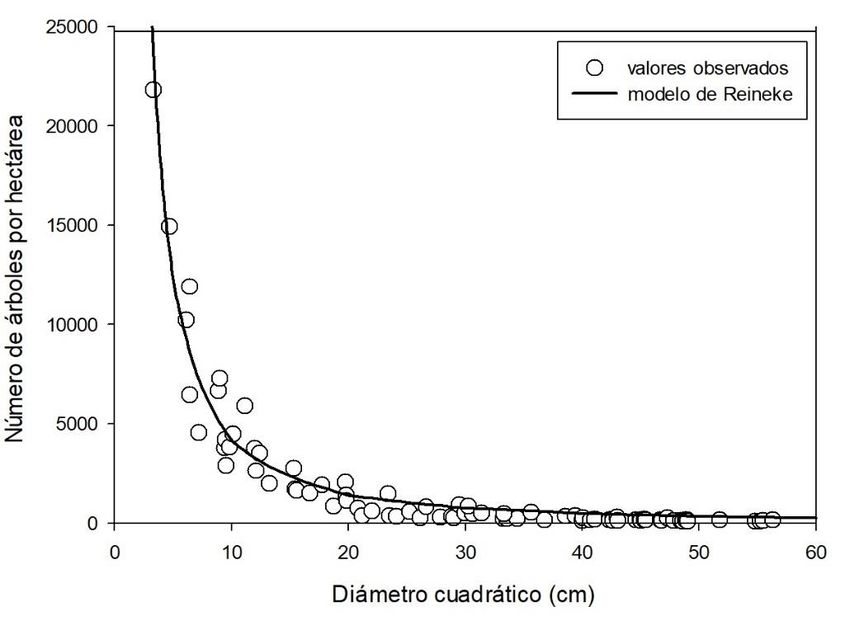
Martínez et al., Density management guide for natural...

Martínez, P. rudis, P. oocarpa Schiede and P. leiophylla Schltdl. et Cham. and Abies
hickelii Flous & Gaussen; taxa of the Quercus genera and Arbutus grow in lesser
proportions (Martínez, 2009).

                   Figure 1. Geographic location of the study area.

              Estimation of Reineke’s Stand Density Index

For the estimation of this index, 81 sites of different dimensions were selectively located in
the following areas, using the sampling method proposed by Prodan (1968), which
considers the measurement of six trees and defines the sampling unit as a circular area
whose radius extends from the center of the site to the center of the sixth tree (Figure 2).
The site was selected considering areas of forest between scrubland and woodland (Müller
et al., 2013; Aguilar, 2018), stands of which more than 90 % consisted of trees of the same
species, homogeneous areas of full occupancy, and sites with healthy trees, free of physical
damage (Lee and Choi, 2019).
Revista Mexicana de Ciencias Forestales Vol. 12 (64)
Marzo – Abril (2021)
Figure 2. Six-tree sampling site.
The normal diameter (D) of all individuals at the sampling site was measured with a
diameter tape (Forestry Suppliers, model 283d/160 cm), at a height of 1.3 m; this variable
was used to estimate the basal area of the individuals present within the sampling site.
π D 2
g= 4 (100) (1)
Where:
g = Individual basimetric area (m2)
D = Normal diameter (cm)
π/4 = Constant (0.7854)
Two measures of absolute density ―basimetric area per hectare (G) and number of trees per
hectare (N)― were estimated using the equations described by Ramos et al. (2017).Martínez et al., Density management guide for natural...
Sh
N = Ni ( Se ) (2)
Sh
G = Gi ( ) (3)
Se
Where:
N = Number of individuals per hectare
Ni = Number of individuals per site
G = Basimetric area per hectare (m2)
Gi = Basimetric area per site (m2)
Sh = Area of one hectare (m2)
Se = Area evaluated at sampling site (m2)
Once these two indicators (G and N) were estimated, the quadratic diameter
(Qd) of each sample plot was calculated, with the following expression
(Santiago et al., 2013):
40000 Ba
Qd =√ × Na (4)
π
Where:
Qd = Quadratic diameter (cm)
Ba = Basimetric area per hectare (m2)
Na = Number of trees per hectare
π = Constant (3.1416)Revista Mexicana de Ciencias Forestales Vol. 12 (64)
Marzo – Abril (2021)
The Qd and Na values per site were used to fit Reineke’s model (5), which defined
the maximum average density line of the guide (line A). For stand density comparison
purposes, a Qd of 25 cm or 10 inches is considered in this index (Reineke, 1933;
Santiago et al., 2013; Hernández et al., 2013).
β1
Na = β0 Qd (5)
Where:
Na = Number of trees per hectare
Qd = Quadratic diameter (cm)
β0 = Intercept to the ordinate axis
β1 = Slope
Ba was the product of the individual basimetric area at a given diameter, times the
number of trees estimated with equation 5 (Rodríguez et al., 2009):
π D 2
Ba= ×( ) × Na (6)
4 100
Where:
Ba = Basimetric area per hectare (m2)
D = Normal diameter (cm)
Na = Number of trees per hectare
π/4 = Constant (0.7854)Martínez et al., Density management guide for natural...
Estimation of the crown competition factor
This measure of density was estimated through a targeted sampling of 54 trees that grew
free of competition, healthy and without physical-mechanical defects. The variables
evaluated for each individual were diameter (D) and crown diameter (Cd), which were
measured with a Pretul model Pro-30me longimeter, in a north-south and east-west
direction, in order to obtain the average per individual (Rodríguez et al., 2009).
The 54 pairs of data (D-Cd) were used to estimate the Cd as a function of D (7), after
which the crown areas (Ca) (8) corresponding to trees free of competition at a given
diameter were calculated (Rodríguez et al., 2009; Hernández et al., 2013).
Cd = β0+β1 D (7)
π 2
Ca = ×Cd (8)
4
Where:
Cd = Crown diameter (m)
D = Normal diameter (cm)
β0 = Intercept to the ordinate axis
β1 = Slope
Ca = Crown area (m2)
π/4 = Constant (0.7854)
The maximum crown area (Mca) of an individual, expressed as a percentage of the surface
unit (ha) was determined with equation 9 (Rodríguez et al., 2009; Hernández et al., 2013):
Ca
Mca = (9)
100Revista Mexicana de Ciencias Forestales Vol. 12 (64)
Marzo – Abril (2021)
Where:
Mca = Maximum crown area
Ca = Crown area (m2)
Finally, the number of trees and basimetric area per hectare were estimated with
equations 10 and 11, respectively; based on these values, the sufficient density line of
the guide (line B) was calculated (Rodríguez et al., 2009; Hernández et al., 2013):
100
Na= Mca (10)
π D 2
Ba = 4 × (100) × Na (11)
Where:
Na = Number of trees per hectare
Mca = Maximum crown area
Ba = Basal area per hectare (m2)
D = Normal diameter (cm)
π/4 = Constant (0.7854)
Model fit
The adjustment of equations 5 and 7 was performed by the Ordinary Least Squares
(OLS) method in STATISTICA 10 software (StatSoft Inc., 2011), through nonlinear
and linear regression, respectively. The quality of fit of the models was evaluated by the
value of the coefficient of determination (r2), the root mean squared error (RMSE), as
well as the value of their likelihood (Vargas, 1999; Hernández et al., 2013).Martínez et al., Density management guide for natural...
Density guide construction
In order to construct the density guide, line A or 100 % (average maximum density)
was determined with the Na ha-1 and Ba ha-1 estimated from the Reineke model;
based on these values, different density levels (30 to 110 %) were calculated at
intervals of 10 %. The B line (sufficient density) was determined by the Na ha-1 and
Ba ha-1 resulting from the CCF (Vargas, 1999).
Results and Discussion
Reineke’s density index
The Qd explained 94 % (r2 = 0.94) of the variation in the number of trees per hectare,
with a mean error (RMSE) of 831 and significant parameters at 95 % confidence
(αRevista Mexicana de Ciencias Forestales Vol. 12 (64)
Marzo – Abril (2021)
Diámetro cuadrático = Quadratic diameter; Número de árboles por hectárea =
Number of trees per hectare; Valores observados = Observed values; Modelo de
Reineke = Reineke's model.
Figure 3. Relationship between the quadratic diameter and the number of trees per hectare.
The values of the average maximum densities, estimated from Reineke's model, were
the basis for constructing the rest of the isolines of the density guide (Table 1).Martínez et al., Density management guide for natural...
Table 1. Average maximum densities estimated with Reineke’s model.
Qd Na.ha-1 Ba.ha-1
10 4179 32.82
15 2225 39.32
20 1423 44.70
25 1006 49.37
30 758 53.55
35 596 57.35
40 484 60.87
45 403 64.15
50 342 67.23
Qd = Quadratic diameter (cm) ; Na ha - 1 = Number of trees per hectare ;
Ba ha-1 = Basimetric area per hectare.
Based on the reference Qd value (25 cm), an SDI of 1 006 was estimated. In this
regard, Rodríguez et al. (2009) obtained a value of 1 663 for P. montezumae Lamb;
while Hernández et al. (2013) recorded a value of 775 for Pinus teocote Schiede ex
Schltdl. & Cham. Both studies were conducted in the state of Hidalgo, Mexico.
Approximate SDI values can be calculated only in pure stands with full density
consisting of trees of the same species and with the same average stand diameter
(Reineke, 1933).
Several values of the slope (β1) have been estimated for the Reineke´s model, most varying
between -1.0151 (Rodríguez et al., 2009) and -2.18937 (Tamarit et al., 2018). Likewise,
studies have been developed to determine if the value of β1 postulated by Reineke (1993) is
statistically equal to -1.605; one of them is by Pretzsch and Biber (2005), who adjusted the
equation for forests of Fagus sylvatica L., Picea abies (L.) Karst., Pinus sylvestris L. and Quercus
petraea (Mattuschka) Liebl. in Germany; for these taxa, P. sylvestris L. excepted, the slope
value was significantly different.Revista Mexicana de Ciencias Forestales Vol. 12 (64)
Marzo – Abril (2021)
Guezan et al. (2007) developed density diagrams for Nothofagus obliqua (Mirb.)
Oerst, N. alpina (Poepp. & Endl.) Oerst., N. dombeyi (Mirb.) Oerst. in Chile, and
concluded that the value of the parameter β1 is species-specific.
Santiago et al. (2013) constructed density guides for Pinus patula in the state of
Hidalgo, Mexico. The estimated slopes were -1.565±0.208 for Reineke’s model and
1.199±0.048 for Yoda’s model. In the first case, it includes the value postulated by
Reineke (1933). Likewise, Quiñonez et al., (2017), in their density plot work in mixed
forests of Durango, Mexico, obtained an interval from -1.541 to -1.778, which
includes the value of -1.605.
Santiago et al. (2013), Quiñonez et al. (2017) and Tamarit et al. (2018) compared
adjustment methods for defining the self-thinning line and used Ordinary Least
Squares (OLS) and stochastic border regression (SBR), and they agree that SBR
efficiently estimates the upper boundary of self-thinning. According to VanderSchaaf
and Burkhart (2007) and Comeau et al. (2010), the OLS method is also appropriate
for characterizing the maximum density line.
In general terms, the SDI has been widely used in the construction of density
diagrams or guides (Vargas, 1999; Gezan et al., 2007; Navarro et al., 2011; Santiago
et al., 2013; Hernández et al., 2013; Quiñonez et al., 2017; Tamarit et al., 2018;
Tamarit et al., 2020). These diagrams offer greater precision compared to those
constructed with the Yoda index and the Relative Space index, since Reineke’s model
uses the Qd calculated from the normal diameter, which is a direct measurement
variable; the other two use the volume and total height, respectively, which are
generally estimated using some mathematical model (Tamarit et al., 2020).Martínez et al., Density management guide for natural...
Crown competition factor
Diameter (D) accounted for 83 % (r2=0.83) of the variation in Cd, with a mean error
(RMSE) of 1.05 and significant parameters at 95 % confidence (αRevista Mexicana de Ciencias Forestales Vol. 12 (64)
Marzo – Abril (2021)
The trees in any stand below the CCF (line B) have sufficient resources to develop
their full growth potential, since they do not compete with other individuals (Krajicek
et al., 1961; Álvarez et al., 2004). However, if the density is kept below the CCF until
the trees reach their maturity, these will be of poor quality if pruning is not applied
(Krajicek et al., 1961). Within this context, the individuals are resistant to mechanical
forces (wind and snow), but with disadvantages in sawing performance, since they
have a low slenderness value and a high crown percentage (Arias, 2005).
When the stand is above line B, crown closure occurs. At this time, competition
between individuals begins; however, there is no immediate mortality (Gezan et al.,
2007). Philbrook et al. (1973) point out that the effect of competition starts when the
stock is halfway between A and B, i.e., for this study, above 70 % of the SDI.
Santiago et al. (2013) estimated that natural mortality in Pinus patula occurs from
55 % of the SDI up. According to Quiñonez et al. (2017), in stands with a mixture of
species, the effect of competition occurs when the value of the SDI is 70 %.
Density guide construction
Line A was determined based upon the average maximum densities estimated with
Reineke’s model; stands above this line are considered overpopulated areas, which
require immediate cutting to improve the quality of the residual tree stock (Hernández
et al., 2013; Santiago et al., 2013; Quiñonez et al., 2017; Tamarit et al., 2018).
Line B is represented by the CCF; any stand below this line is considered underpopulated
or with poor density (Vargas, 1999; Rodríguez et al., 2009; Hernández et al., 2013). The
density of the stand of the present study must be increased so that decisions can be made
regarding its management, or if necessary, another intermediate treatment ―such as
fertilization, if the main objective is timber production― must be applied in order to achieve
site improvement (Daniel et al., 1982).Martínez et al., Density management guide for natural...
In order to exemplify the application of the guide, three sampling sites of 100 m2 (10
× 10 m) were erected in an area of natural regeneration of Pinus rudis. The normal
diameter of each individual was measured, and the number of trees per site was
counted; based on these variables, the Ba ha-1 and Na ha-1 were calculated. The
average values calculated were 38.27 m2 of Ba ha-1 and 2 045 m2 of Na ha-1. By
placing these values in the guide (1), an SDI of 96 % and an approximate Qd of 15.5
cm were graphically estimated.
If the stand is taken from condition 1 to condition 2, its density level will rise to 75 %, and
8.26 m2 of Ba ha-1 and approximately 545 Na ha-1 will be removed. The purpose is to
maintain the stand between lines A and B in a desired condition according to
management objectives (Figure 4).
Diámetro cuadrático = Quadratic diameter ; Área basal = Basimetric
área; Número de árboles por hectárea = Number of trees per hectare; Índice
de densidad de Reineke = Reineke's density index; Deficiente = Deficient;
Suficiente = Sufficient; Excesiva = Excessive.
Figure 4. Density guide for Pinus rudis Endl.Revista Mexicana de Ciencias Forestales Vol. 12 (64)
Marzo – Abril (2021)
Conclusions
The models adjusted for the estimation of the SDI and CCF show a good quality of fit
using the Ordinary Least Squares technique, with coefficients of determination (r2) of 0.94
and 0.83, respectively. The density guide described in this study is a support tool for
foresters, as it will allow them to know the absolute and relative density levels of the
forest, as well as the thinning needs and the thinning intensities required. The
methodology presented is simple and easy to apply in the field, and it is a reliable
foundation for the construction of density guides in natural stands and forest plantations.
Acknowledgments
The authors wish to thank the National Technological Institute of Mexico (Tecnológico
Nacional de México) for the funding granted for this project under Code No. 7801.20-
PD, and to the agrarian authorities of San Miguel El Grande for the facilities provided
for the field data collection.
Conflict of interest
The authors declare no conflict of interests.
Contribution by author
Daniel Martínez Santiago: planning of activities, collection of field data, data analysis
and drafting of the manuscript; Prudencia Caballero Cruz and Eduardo Filio
Hernández: field data collection and review of the manuscript; Alejandro Garzón
Trinidad, Rosalino Ortiz Barrios, Octavio Lemuel Cruz Santiago, Ithaiz Aparicio Cuevas
and Carmela Sandoval García: field data collection.Martínez et al., Density management guide for natural... References Aguilar L., J. M. E. 2018. Estructura y diversidad de la vegetación arbórea de un bosque de galería en el estado de Puebla. Revista Mexicana de Ciencias Forestales 9(47): 230-252. Doi: 10.29298/rmcf.v9i47.154. Álvarez T., M. F., R. Marqués G., A. Fernández M. y F. Castedo V. 2004. Influencia de la competencia en el crecimiento en sección de Pinus radiata D. Don en el bierzo (León). Sociedad Española de Ciencias Forestales 18: 129.133. https://www.researchgate.net/publication/40836564 (1 de octubre de 2020). Arias A., D. 2005. Morfometría del árbol en plantaciones forestales tropicales. Kurú 2(5): 19-32. https://dialnet.unirioja.es/servlet/articulo?codigo=5123399 (30 de septiembre de 2020). Caballero C., P., W. Santiago J., D. Martínez S., O. L. Cruz S., E. R. Pérez S. y O. A. Aguirre C. 2018. Combustibles forestales y susceptibilidad a incendios de un bosque templado en la Mixteca Alta, Oaxaca, México. Foresta Veracruzana 20 (1): 1-9. http://www.redalyc.org/articulo.oa?id=49757295003 (30 de septiembre de 2020). Chisman, H. H. and F. X. Schumacher. 1940. On the tree-area ratio certain of its aplications. Journal of Forestry 38 (4): 311-317. Doi: 10.1093/jof/38.4.311. Comeau, P. G., M. While, G. Kerr and S. Hale. 2010. Maximum density–size relationships for Sitka spruce and coastal Douglas-fir in Britain and Canada. Forestry 83: 461-468. Doi: 10.1093/forestry/cpq028. Curtis, R. O. 1970. Stand density measures: an interpretation. Forest Science 16 (4):403–414. Doi: 10.1093/forestscience/16.4.403. Daniel, T. W., J. A. Helms y F. S Baker. 1982. Principios de Silvicultura. Segunda edición. (Traducción de Ramón Elizondo Mata, UNAM). Editorial McGraw-Hill. México, D. F., México. 482 p.
Revista Mexicana de Ciencias Forestales Vol. 12 (64)
                                    Marzo – Abril (2021)

García, E. 1998. Climas, escala 1:1000000. Comisión Nacional para el Conocimiento
y Uso de la Biodiversidad. México. http://www.conabio.gob.mx/informacion/gis/
(26 de julio del 2020).

García C., X., C. Parraguirre L. y H. Ramírez M. 1996. Guía de densidad para
manejo de plantaciones de Swietenia macrophylla King. (Caoba). Ciencia Forestal
en México 21(80): 79–95.

Gezan, S. A., A. Ortega y E. Andenmatten. 2007. Diagramas de manejo de densidad
para renovales de roble, raulí y coigüe en Chile. Bosque 28(2): 97-105.
Doi:10.4067/S0717-92002007000200002.

Gingrich, S. F. 1967. Measuring and evaluating stocking and stand density in upland
hardwood forests in the Central States. Forest Science 13(1):38-53.
Doi:10.1093/forestscience/13.1.38.

Hernández R., J., J. J. García M., H. J. Muñoz F., X. García C., T. Sáenz R., C. Flores
L. y A. Hernández R. 2013. Guía de densidad para manejo de bosques naturales de
Pinus teocote Schlecht. et Cham. en Hidalgo. Revista Mexicana de Ciencias
Forestales 4(19): 62-77. Doi: 10.29298/rmcf.v4i19.379.

Instituto Nacional de Estadística Geografía (INEGI). 2014. Conjunto de datos
vectoriales edafológico. Escala 1:1000000. Serie II. México, D.F., México. s/p.
http://www.conabio.gob.mx/informacion/gis/ (26 de julio del 2020).

Instituto Nacional de Estadística Geografía (INEGI). 2016. Conjunto de datos
vectoriales de la carta de Uso del suelo y vegetación. Escala 1:250000. Serie VI.
México. http://www.conabio.gob.mx/informacion/gis/ (26 de julio del 2020).

Krajicek, J. E., K. A. Brinkman and S. F. Gingrich. 1961. Crown competition, a
measure of density. Forest Science 7(1):35-42. Doi: 10.1093/forestscience/7.1.35.
Martínez et al., Density management guide for natural... Lee, D. and J. Choi. 2019. Evaluating maximum stand density and size–density relationships based on the Competition Density Rule in Korean pines and Japanese larch. Forest Ecology and Management 446 (2019): 204–213. Doi:10.1016/j.foreco.2019.05.017. Márquez L., M. A. y R. Álvarez Z. 1995. Construcción de una guía de densidad para Pinus cooperi var. ornelasi con base en la clase de copa en Durango, México. Madera y Bosques 1(2): 23-36. Doi: 10.21829/myb.1995.121396. Martínez L., O. 2009. Programa de Manejo Forestal Nivel Avanzado para el predio de San Miguel el Grande (2009-2018). Secretaría de Medio Ambiente y Recursos Naturales. Oaxaca, Oax., México. 101 p. Müller U., B., R. Rodríguez y P. Gajardo. 2013. Desarrollo de una guía de manejo de la densidad en bosques de segundo crecimiento de roble (Nothofagus obliqua) en la región del Biobío. Bosque 34(2): 201-209. Doi:10.4067/S0717- 92002013000200009. Navarro C., C., M. A. Herrera, F. Drake A. y P. J. Donoso. 2011. Diagrama de manejo de densidad y su aplicación a raleo en bosques de segundo crecimiento de Drimys winteri en el sur de Chile. 32 (2): 175-186. Doi: 10.4067/S0717- 92002011000200008. Perry, J. P. Jr. 1991. The pines of Mexico and Central America. Timber Press Inc. Portland, OR, USA. 231 p. Philbrook, J. S., J. P. Barrett and W. B. Leak. 1973. A stocking guide for eastern white pine. Research Note NE-168. Department of Agriculture, Forest Service, Northeastern. Upper Darby, PA, USA. 3 p. Pretzsch, H. and P. Biber. 2005. A Re-Evaluation of Reineke’s Rule and Stand Density Index. Forest Science 51(4): 304-320. Doi:10.1093/forestscience/51.4.304. Prodan, M. 1968. Forest Biometric. Pergamon Press. Oxford, UK. 447 p.
Revista Mexicana de Ciencias Forestales Vol. 12 (64)
                                       Marzo – Abril (2021)

Quiñonez B., G., J. C. Tamarit U., M. Martínez S., X. García C., H. M. De Los Santos. P. and
W. Santiago G. 2017. Maximum density and density management diagram for mixed-
species forests in Durango, Mexico. Revista Chapingo Serie Ciencias Forestales y del
Ambiente. 24(1): 74-90. Doi: 10.5154/r.rchscfa.2017.09.056.

Ramos R., J. C., E. J. Treviño G., E. Buendía R., O. A. Aguirre C. y J. I. López M. 2017.
Productividad y estructura vertical de un bosque templado con incidencia de incendios forestales.
Revista Mexicana de Ciencias Forestales 8(43): 64-88. Doi: 10.29298/rmcf.v8i43.66.

Reineke, L. H. 1933. Perfecting a stand-density index for even-aged forests. Journal
of Agricultural Research 46(7): 627-638.
https://naldc.nal.usda.gov/download/IND43968212/PDF (25 de marzo de 2020).

Rodríguez L., R., R. Razo Z., D. Díaz H. y J. Meza R. 2009. Guía de densidad para
Pinus montezumae en su área de distribución natural en el estado de Hidalgo.
Universidad Autónoma del Estado De Hidalgo. Instituto de Ciencias Agropecuarias.
Pachuca, Hgo., México. 33 p.

Santiago G., W., H. M. De Los Santos P., J. R. Ángeles P., D. H. Del Valle P. y J. J.
Corral R. 2013. Auto-aclareo y guías de densidad para Pinus patula mediante el
enfoque de regresión de frontera estocástica. Agrociencia. 47(1) 75-89.
http://www.scielo.org.mx/pdf/agro/v47n1/v47n1a7.pdf (16 de marzo de 2020).

Statsoft Inc., 2011. Statistica (data analysis software system). Version 10.
www.statsoft.com (29 de enero de 2020).

Tamarit U., J. C., G. Quiñonez B., H. M. De Los Santos P., A. Castañeda M. y W.
Santiago G. 2018. Diagrama para manejo de la densidad en rodales de Pinus patula
Schiede ex Schltdl. & Cham. en Puebla, México. Revista Mexicana de Ciencias
Forestales 10(51): 157-181. Doi: 10.29298/rmcf.v10i51.223.
Martínez et al., Density management guide for natural... Tamarit U., J. C., G. Quiñonez B. y J. Hernández R. 2020. Aspectos metodológicos para generar diagramas de manejo de la densidad de rodales con base en el índice de Reineke. Revista Mexicana de Ciencias Forestales 11(61): 4-26. Doi:10.29298/rmcf.v11i61.728. Torres R., J. M. y A. Velázquez M. 2000. Índice de densidad relativa para rodales coetáneos mezclados. Agrociencia 34(4): 497-507. https://www.redalyc.org/pdf/302/30234413.pdf (25 de abril de 2020). Torres R., J. M. y O. S. Magaña T. 2001. Evaluación de Plantaciones Forestales. Limusa. México, D. F., México. 472 p. VanderSchaaf, C. L. and H. E. Burkhart. 2007. Comparison of methods to estimate Reineke’s maximum size-density relationship species boundary line slope. Forest Science 53(3): 435-442. Doi: 10.1093/forestscience/53.3.435. Vargas L., B. 1999. Caracterización de la productividad y estructura de Pinus hartwegii Lind. en tres gradientes altitudinales en el cerro Potosí, Galeana, Nuevo León. Tesis de maestría. Facultad de Ciencias Forestales. Universidad Autónoma de Nuevo León. Linares, N. L., México. 93 p. http://cdigital.dgb.uanl.mx/te/1020125428.pdf (30 de septiembre de 2020). Yoda, K., T. Kira, H. Ogawa and K. Hozumi. 1963. Self-thinning in overcrowded pure stands under cultivated and natural conditions. Journal of Biology 14: 107–129. Zepeda B., E. M. y M. E. Villareal D. 1987. Guía de densidad para Pinus hardwegii Lind., Zoquiapan, México. Universidad Autónoma de Chapingo, División de Ciencias Forestales. Texcoco, Edo. de Méx., México. 52 p. All the texts published by Revista Mexicana de Ciencias Forestales –with no exception– are distributed under a Creative Commons License Attribution-NonCommercial 4.0 International (CC BY- NC 4.0), which allows third parties to use the publication as long as the work’s authorship and its first publication in this journal are mentioned.
You can also read