CO Emissions Modeling and Prediction using ANN and GIS - Pollution
←
→
Page content transcription
If your browser does not render page correctly, please read the page content below
Pollution 2021, 7(3): 739-747 DOI: 10.22059/poll.2021.323244.1077 RESEARCH PAPER CO Emissions Modeling and Prediction using ANN and GIS Hossein Etemadfard1, Vahid Sadeghi2, Faleh Hassan Ali1 and Rouzbeh Shad1 1. Civil department, Engineering Faculty, Ferdowsi University of Mashhad, Mashhad, Iran 2. Department of Geomatics Engineering, Faculty of Civil Engineering, University of Tabriz, Tabriz, Iran Received: 05 April 2021, Revised: 28 June 2021, Accepted: 01 July 2021 © University of Tehran ABSTRACT Air pollution is considered a global concern due to its impacts on human life and the urban environment. Therefore, precise modeling techniques are necessary to predict air quality in congested areas such as megacities. Recently, machine learning algorithms such as Neural Networks show significant possibilities in air quality studies. This paper proposes a model to estimate air quality in a congested urban area in Baghdad city using Artificial Neural Network (ANN) algorithm and Geospatial Information System (GIS) techniques. Carbon Monoxide (CO) gas is selected as the main air pollutant. The model parameters involve; CO samples, traffic flow, weather data, and land use information collected in the field. The proposed model is implemented in Matlab environment and the results are processed after entering ArcGIS software. Using its spatial analysis tools, the outputs are presented as a map. The final findings indicate the highest value of CO emissions that reached 34 ppm during the daytime. The most polluted areas are located near congested roads and industrial locations in comparison with residential areas. The proposed model is validated by using actual values that are collected from the field, where the model's accuracy is 79%. The proposed model showed feasibility and applicability in a congested urban area due to the integration between the machine learning algorithm and GIS modeling. Therefore, the proposed model in this research can be used as a supportive model for decision making of city managers. KEYWORDS: Air pollution maps, CO emissions, ANN, GIS. INTRODUCTION The urban environment with different facilities such as roads network, industrial and commercial facilities, has a significant impact on the development of countries’ economies (Guzman et al. 2016). In other words, due to the emission of pollutants from traffic, industrial and construction activities, air quality in urban areas is lower than in rural areas. Many pollutants are located in the ambient air such as Carbon Dioxide (CO2), Nitrogen dioxide (NO2), Sulfur dioxide (SO2), and Carbon Monoxide (CO). CO is the most poisonous gas, which mainly resulted from the incomplete combustion of fuels in the traffic emissions (Atimtay et al. 2000). It is a toxic, odorless, and colorless gas (Prockop and Chichkova 2007). As a result, many agencies and governments need the measuring and evaluating tools to model and assess the air pollutants and their impacts on the air quality to prepare valid plans to reduce air pollutants. Several methods are applied for air pollution assessment, which are categorized from direct measurement, mathematical simulations, prediction models, and spatial simulations (Sportisse, 2007). Although these methods make satisfactory results, there Corresponding Author, Email: v.sadeghi@tabrizu.ac.ir
740 Etemadfard et al.

are still drawbacks to their performance. Direct measurements are an extremely expensive
method and the mathematical simulation is unable to connect results with real locations.
Machine learning algorithms such as Artificial Neural Network (ANN) algorithms show
feasibility in air pollution studies due to their accurate results and their compatibility with
other techniques such as spatial models (Jiang et al. 2004). In several recent studies, studies
on modeling and evaluating air quality in the city and busy areas of Tehran and Baghdad, the
use of neural networks has been suggested. In one of them, Farhadi et al. (2019) showed that
the use of artificial neural networks with inappropriate inputs is not efficient for modeling
PM10. However, the results of Azeez et al. (2019) that study in Iraq, showed that an accuracy
of about 80% can be achieved. Then Jasim et al. (2020) resulted that the integration between
air pollution models and Geospatial Information System (GIS) techniques could be a useful
tool for urban air quality assessment and urban planning. In this study, we propose a hybrid
model which integrates the ANN algorithm and GIS techniques (spatial analysis) to produce
CO maps and prediction model in the study area.
 In general, several methods have been utilized to predict air pollutants in urban and rural
areas such as the following; (1) Direct measurements such as field surveying, (2)
Mathematical simulations, (3) Prediction models, and (4) Spatial models such as dispersion
and GIS models. Recently, hybrid models that integrate artificial intelligence algorithms and
spatial techniques showed good feasibility in the air quality modeling as well as their high
performance in the spatial representation of air pollutants at a certain time and location
(Azeez et al., 2019). Traditional interpolation is considered the basic technique used in the
spatial modeling of air quality. Potoglou and Kanaroglou (2005) proposed a method by
integrating field data and the kriging interpolation method to represent the spatial variation of
CO emissions. It was concluded that traffic areas were the most polluted locations in urban
areas. In a separate study, Arain et al. (2007) developed a model using land use regression
algorithm (LUR) and data obtained from the governmental sector such as traffic flow, weather
data, and land use maps. That study aimed to estimate Nitrogen dioxide (NO2) emissions in
Canada. The final findings showed a significant spatial pattern of NO2 at the local scale.
After that, the experts developed a special model to estimate the dispersion of air pollutants;
(Kho et al. 2007). They predicted CO emissions within a congested area in Malaysia by
dispersion software (CAL3QHC), which uses traffic flow data and weather information. They
concluded that CO values on roads were highest than CO values near residential areas. In
another study, Behera et al. (2015) proposed a new framework using data obtained from
monitoring stations and GIS techniques to generate prediction maps of NO2 concentrations in
India. The results of that study showed high concentrations of NO2 in the center of the city
near commercial facilities. Due to the increase of the governmental data, Kim and Guldmann
(2015) developed a LUR model depending on monitoring stations and a new proposed
parameter vehicle-kilometers-traveled to estimate NO2 values in Seoul, South Korea. As a
result of that research, it was found that Land use and vehicle-kilometers-traveled had a
significant impact on the NO2 levels. Recently, Machine learning methods become the most
popular methods for air quality modeling, due to their ability to overcome complicated
computation issues and optimize modeling performance. For instance; Moazami et al. (2016)
developed a prediction model using a support vector machine algorithm to predict daily CO
concentrations with a small dataset. Most recent studies aimed to model and represent air
pollutants at a micro-scale by using machine learning methods and GIS tools. Azeez et al.
(2018) developed an integrated model based on the Support Vector Regression Model and
GIS spatial analysis with grid analysis to produce prediction maps on near highways in Kuala
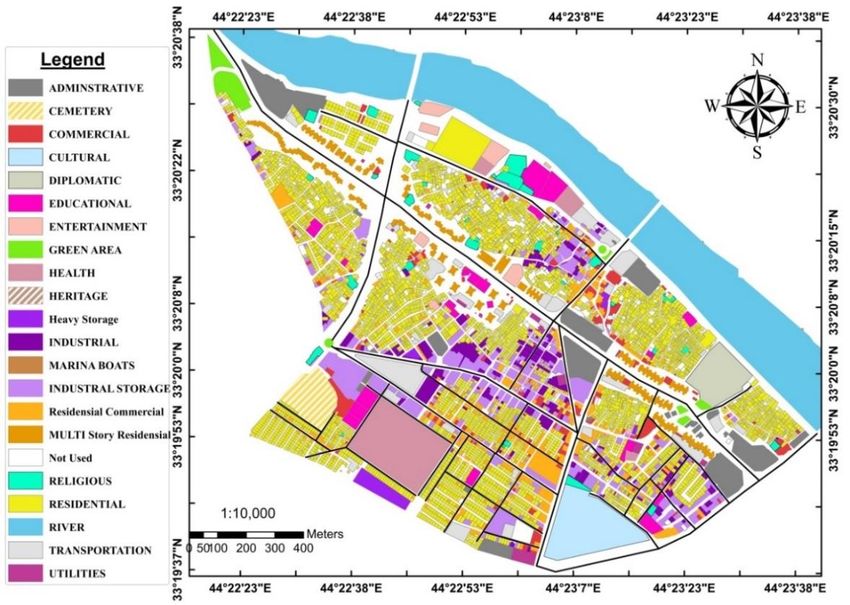
Pollution 2021, 7(3): 739-747 741

Lumpur, Malaysia. The final findings indicated that the highest CO levels were observed
during daily peak hours.
 The main drawback of interpolation results is that the results lack reasoning due to their
negligence of barriers like buildings and the topography which may affect the interpolation
process. On the other hand, dispersion models required extensive information, the
mismatching between data. While the main drawback of Land use regression models are the
area specificity, the robustness of the model depends on the area of study. Finally, machine
learning algorithms required Big data and expert users (Zhou et al., 2017). Thus, in this study,
we tried to solve these problems by combining ANN algorithm and GIS tools to model CO
emissions in urban areas in the center of Baghdad, Iraq.

MATERIALS AND METHOD

The study area is selected in a small urban area located in Baghdad city called "Al karkh".
The main reason for selecting this area is the availability of air quality data. Al-karkh is
generally a congested area in Baghdad city. The two sides of Baghdad city (Karkh and
Resafa) are connected through an important road network. On the other hand, this area
contains several land-use types (Figure 1). The center of Baghdad is geographically bounded
by (33º 20’ 0” N, 44º23’30” E) and (33º 20’ 30” N, 44º 22’30” E). In Baghdad, the weather is
hot-dry in summer and mild in winter. Baghdad is characterized by a flat topography.
According to governmental statistics, the population in Baghdad reached approximately 7
million (Iraq National Population Commission, 2012). This area is called (Old Alkarkh) due
to the variation of activities including commercial, industrial, transportation, and residential
ones. This area is also unique by the heavy traffic congestions during rush hours that can daily
influence the quality of ambient air. Furthermore, this area also includes many heritage
buildings which makes it suitable for tourism activities and environmental studies.

 Fig. 1. The Study area (Alkarkh area)
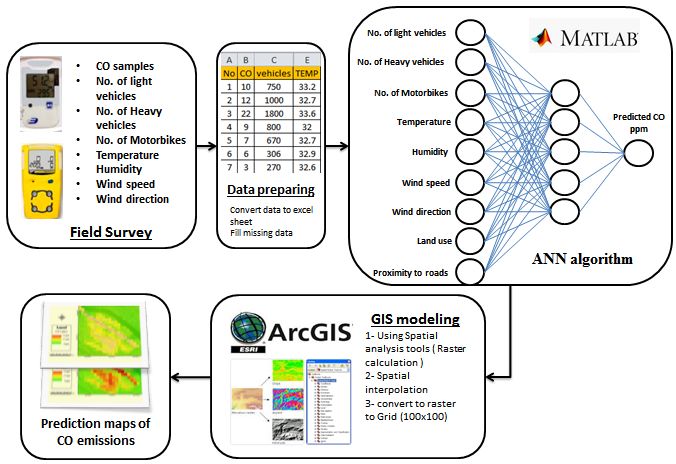
742 Etemadfard et al.

 The proposed methodology includes several steps; the first step is the field data collection
including a number of light vehicles, heavy vehicles, motorbikes, temperature, humidity, wind
speed, wind direction, and CO emissions, then the collected data are converted to excel files
to facilitate the integration with the modeling process. The modeling process is applied
depending on the input parameters (a number of light vehicles, heavy vehicles, motorbikes,
temperature, humidity, wind speed, wind direction, land use, proximity to roads ) and the
ANN algorithm. After that spatial modeling is applied depending on ANN results and spatial
analysis techniques (i.e. IDW interpolation, conversion analysis) to produce CO emission
maps in the study area. Figure 2 shows the overall methodology.

 Fig. 2. Proposed method

 The field survey was conducted by the Iraqi Ministry of Environment and continued for one
month, the survey had contained the collection of CO emissions at certain times and locations. CO
emissions were frequently measured by using mobile equipment. On the other hand, traffic flow
and weather data were simultaneously recorded with CO emissions. Sample locations were
randomly selected depending on spatial analysis techniques, which created an optimal number of
samples in the study area (Ragettli et al. 2016). The data were gathered in April 2019 by a group
of surveyors. These data included CO samples that were collected using portable equipment,
model CO tracker with an accuracy of one part per million (ppm). The traffic flow and weather
data were collected simultaneously per hour. Where the traffic flow information included a
number of light vehicles, heavy vehicles, and motorbikes, which counted manually. On the other
hand, weather data including temperature, humidity, wind speed, and wind direction were
collected by using a data logger. The measurements were conducted twice per day; daytime (6.30
am to 3.30 pm) and nighttime (5 pm to 12 pm) according to the instructions of World Health
Organization (WHO) (2006). The field survey results showed that the average temperature,
humidity, the wind speed were equal to 34°, 43%, 7.3 mph, respectively. In addition, the wind
direction was 41 North. In terms of the number of vehicles, light and heavy vehicles were equal to
2600 and 740. The number of motorbikes was 87.
Pollution 2021, 7(3): 739-747 743 ANN is one of the biological mathematical learning algorithms that belong to machine learning models. As it is shown in Figure 3, ANN consists of a simple framework that connects nodes and neurons. The ANN algorithm can represent a non-linear mapping among inputs and outputs. Neurons are organized into several layers with random or full connections between successive layers (Mokhtarzade and Zoej, 2007). Generally, in the ANN architecture, there are three types of layers which are input layer, hidden layers, and output layer. These layers are responsible for processing the input data and present final outputs (Mokhtarzadeh and Zoej, 2007). While, nodes are connected by numerical weights and output signals that considered as a function of the sum of the inputs to the node modified by an activation function (Gardner and Dorling 1998). Back-Propagation (BP) algorithm is a famous algorithm for ANN. Furthermore, the BP algorithm is considered an iterative algorithm that is developed to decrease function errors (Eq. 1). 1 L 2 E d j o Mj (1) 2 i 1 where, and refers to desired outputs, current response of the node in the output layer, and refers to the number of nodes within output layer. In an iterative method, the correction of weight parameters is calculated as (Eq. 2). E w i , j μ w i , j (2) w t 1 w α w t i,j i,j i,j where, , refers to the weight parameter between node and , ∆ a positive constant, which controls the amount of adjustment and is named as learning rate and also is a momentum factor that can classified between 0 and 1. The parameter represents the iteration number. In the other word, the parameter can be named as stabilizing or smoothing factor as it smoothest the fast changes between weights (Yang 1995). Figure 3 shows a simple example of the structure of a neural network. Fig. 3. ANN structure (Ahmed and Pradhan 2019) In this study, we applied a backpropagation algorithm with an architecture that included 9 input layers with 5 neurons for each layer by using MATLAB software. The input layers include several parameters like the number of light vehicles, heavy vehicles, motorbikes, temperature, humidity, wind speed, wind direction, land use, and proximity to roads. The
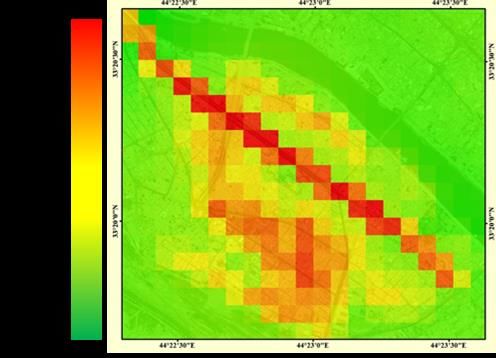
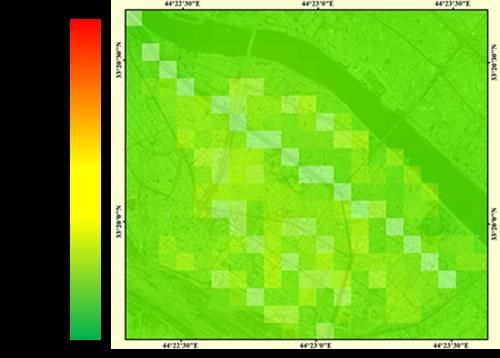
744 Etemadfard et al.

modeling process is implemented depending on collected samples, the total number of
samples is 88, the modeling samples were 62 which represents 70% of the total number of
samples, while the validation samples were 26 represent 30% of total samples. The model's
validation is implemented by using Root Mean Square Error (RMSE), Mean Absolute Error
(MAE), and correlation coefficient methods.
 In this study, GIS modeling is implemented depending on spatial analysis techniques by
using ArcGIS software. The main goal of using GIS modeling in the study is to produce maps
that represent the spatial and quantitative variation of CO emissions in the study area. GIS
modeling typically includes several steps, the first step is data transformation from the vector
to the raster format. The main reason for the data transformation is to facilitate the integration
between spatial analysis tools and the input data due to the applicability of raster layers in the
GIS environment. In this regard, spatial interpolation is applied by using the Kriging
algorithm. Kriging is a geostatistical interpolation that generates a predicted surface from a
distributed set of points with a specific value. The kriging interpolation assumes that distances
or directions between sample points reflect a spatial correlation that can be used to explain
variation in the values. The kriging interpolation process includes several exploratory
statistical calculations, generating the surface, variogram modeling, and exploring the
variance of surfaces (Dai et al. 2003). Furthermore, the proximity to roads parameter is
calculated by using the Euclidean distance tool. The final result shows the spatial distribution
and quantitative variation of CO emissions with cell-size (100 × 100) m.

RESULTS AND DISCUSSION

The proposed model (ANN) is tested and validated depending on 9 parameters; ( the number
of light vehicles, heavy vehicles, and motorbikes, Temperature, Humidity, Wind speed, wind
direction, land-use, and proximity to roads) to model CO emissions. According to the result of
modeling, the accuracy of ANN algorithm achieved 79%, the correlation coefficient is
0.9734, Mean absolute error is 1.3172 and Root mean square error is 2.156. Table 1 shows the
accuracy assessment of CO prediction based on ANN algorithm.

 Table 1. The accuracy assessment results depending on ANN algorithm
 correlation coefficient 0.9776
 MEA 1.321
 RMSE 2.023
 accuracy 79 %
 number of parameters 9

 The result of GIS modeling is presented depending on the prediction maps. According to
these maps, the highest levels of CO are detected through the daytime because of the heavy
traffic jam and traffic activities including industrial, and commercial activities. In contrast, the
lowest values of CO emissions are detected during nighttime due to the decrease of traffic
activities and other manmade activities. Workdays have recorded the highest value of CO
emission reached 34 ppm through daytime compared to their values at nighttime that reached
19 ppm. On the other hand, holidays recorded the lowest values of CO emissions 9 ppm at
nighttime while CO emissions reached 12 ppm in the daytime. According to the spatial
variation of the CO emissions, we find that the highest values are concentrated near road
network, industrial locations and commercial areas due to the traffic congestions, exhausts of
small generators that used in industrial workshops and commercial areas. In contrast, the
lowest values located far from roads, near residential and green areas. Therefore, traffic
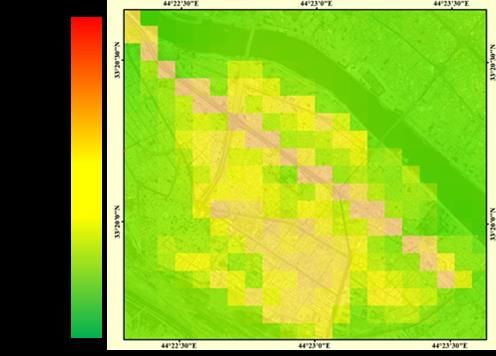
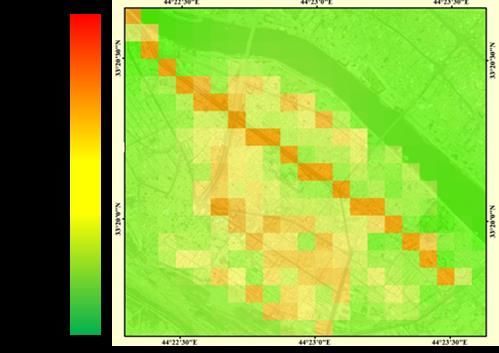
Pollution 2021, 7(3): 739-747 745

activities, industrial, and commercial locations showed a high correlation with CO emissions
within the study area.
 The first map is showing the CO values at Holiday during the daytime, where the
emissions are relatively low, where the CO values ranged from 0 ppm to nearly 19 ppm, the
highest values were concentrated on roads because of the traffic flow. Contrary, the second
map is representing CO values at Holiday during nighttime, where the CO values decreased
due to the decrease of traffic activities, the CO values were between 0 ppm and 14 ppm.
Figure (4 (a), (b)). On the other hand, the third map is presenting the CO values at Work-day
during the daytime, CO values have significantly increased, CO values ranged from 0 ppm to
34 ppm, the highest CO values concentrated near roads and industrial workshops. While some
residential areas located near workshops and main roads are affected by CO emissions, which
reached 28 ppm near these areas. The fourth map is showing a slight decrease in the CO
values during nighttime at work-day, due to the normal decrease of traffic activities in this
area. Figure (4 (c), (d)). According to maps, we concluded that the study area is subjected to
air pollution during workdays more than holidays.

 (a) (b)

 (c) (d)
Fig. 4. CO emissions at holiday –Daytime (a), holiday –Nighttime (b), Workday –Daytime (c) and
Workday –Nighttime (d)

 In general, by comparing CO emissions recorded per 1 hour, the highest values of CO
emissions have exceeded the standards that adopted WHO and United States Environmental
Protection Agency (USEPA), where the highest value of CO should not be increased by 26
746 Etemadfard et al.

ppm (WHO) and 35 ppm (USEPA standards). As a result, the people living near roads or
industrial areas are daily exposed to several harmful emissions that may affect their health.
Therefore, a proper strategy should be applied to reduce air pollution in this area.

CONCLUSION

CO emissions are one of the main air pollutants in urban areas. The modeling and mapping
techniques are usually applied to assess the impacts of air pollution on the environment and
human health. In this study, we propose a model which is based on ANN and GIS tools to
model CO emissions in a small urban area. The proposed methodology is trained depending
on 9 parameters, ANN model accuracy is 79%. The spatial modeling is applied depending on
spatial analysis techniques and the Kriging interpolation algorithm to represent the
distribution of CO emissions at different times a day. The highest value of CO emissions
which is 34 ppm, is found near roads. On the other hand, the lowest value of CO emissions
which is 0 ppm is found near residential areas. Road networks, industrial, and commercial
land use have shown significant impacts on CO emissions while residential land use shows
the lowest impacts with CO emissions. The proposed model shows the feasibility and
applicability in a congested urban area. As the conclusion, the proposed model in this research
can be used as a supportive model for decision making of city managers.

GRANT SUPPORT DETAILS

The present research did not receive any financial support.

CONFLICT OF INTEREST

The authors declare that there is not any conflict of interests regarding the publication of this
manuscript. In addition, the ethical issues, including plagiarism, informed consent,
misconduct, data fabrication and/ or falsification, double publication and/or submission, and
redundancy has been completely observed by the authors.

LIFE SCIENCE REPORTING

No life science threat was practiced in this research

REFERENCES

Ahmed, A. A. and Pradhan, B. (2019). Vehicular traffic noise prediction and propagation modelling
 using neural networks and geospatial information system. Environmental monitoring and
 assessment, 191(3), 190.
Arain, M. A., Blair, R., Finkelstein, N., Brook, J. R., Sahsuvaroglu, T., Beckerman, B. & Jerrett, M.
 (2007). The use of wind fields in a land use regression model to predict air pollution
 concentrations for health exposure studies. Atmospheric Environment, 41(16), 3453-3464.
Atimtay, A. T., Emri, S., Bagci, T. and Demir, A. U. (2000). Urban CO exposure and its health effects
 on traffic policemen in Ankara. Environmental research, 82(3), 222-230.
Azeez, O. S., Pradhan, B., Shafri, H. Z., Shukla, N., Lee, C. W. and Rizeei, H. M. (2019). Modeling of
 CO emissions from traffic vehicles using artificial neural networks. Applied Sciences, 9(2), 313.
Azeez, O., Pradhan, B. and Shafri, H. (2018). Vehicular CO emission prediction using support vector
 regression model and GIS. Sustainability, 10(10), 3434.
Pollution 2021, 7(3): 739-747 747

Behera, S. N., Sharma, M., Mishra, P. K., Nayak, P., Damez-Fontaine, B. and Tahon, R. (2015).
 Passive measurement of NO2 and application of GIS to generate spatially-distributed air
 monitoring network in urban environment. Urban Climate, 14, 396-413.
Dai, K. Y., Liu, G. R., Lim, K. M. and Gu, Y. T. (2003). Comparison between the radial point
 interpolation and the Kriging interpolation used in meshfree methods. Computational
 Mechanics, 32(1-2), 60-70.
Gardner, M. W. and Dorling, S. R. (1998). Artificial neural networks (the multilayer perceptron)—a
 review of applications in the atmospheric sciences. Atmospheric environment, 32(14), 2627-2636.
Guzman, A. F., Vassallo, J. M. and Hortelano, A. O. (2016). A Methodology for assessing the regional
 economy and transportation impact of introducing longer and heavier vehicles: Application to
 the road network of Spain. Networks and Spatial Economics, 16(3), 957-979.
Farhadi, R., Hadavifar, M., Moeinaddini, M. and Amintoosi, M. (2019). Prediction of the Air Quality
 by Artificial Neural Network Using Instability Indices in the City of Tehran-Iran. AUT Journal
 of Civil Engineering.
Iraq National Population Commission. (2012). Iraq Population Situation Analysis Report.
Jasim, O. Z., Hamed, N. H. and Abid, M. A. (2020). Urban air quality assessment using integrated
 artificial intelligence algorithms and geographic information system modeling in a highly
 congested area, Iraq. Journal of Southwest Jiaotong University, 55(1).
Jiang, D., Zhang, Y., Hu, X., Zeng, Y., Tan, J. and Shao, D. (2004). Progress in developing an ANN
 model for air pollution index forecast. Atmospheric Environment, 38(40), 7055-7064.
Kho, F. W. L., Law, P. L., Ibrahim, S. H. and Sentian, J. (2007). Carbon monoxide levels along
 roadway. International Journal of Environmental Science & Technology, 4(1), 27-34.
Kim, Y. and Guldmann, J. M. (2015). Land-use regression panel models of NO2 concentrations in
 Seoul, Korea. Atmospheric Environment, 107, 364-373.
Moazami, S., et al. (2016). Reliable prediction of carbon monoxide using developed support vector
 machine. Atmospheric Pollution Research, 7(3), 412-418.
Mokhtarzade, M. and Zoej, M. V. (2007). Road detection from high-resolution satellite images using
 artificial neural networks. International journal of applied earth observation and geoinformation,
 9(1), 32-40.
Potoglou, D. and Kanaroglou, P. S. (2005). Carbon monoxide emissions from passenger vehicles:
 predictive mapping with an application to Hamilton, Canada. Transportation Research Part D:
 Transport and Environment, 10(2), 97-109.
Prockop, L. D. and Chichkova, R. I. (2007). Carbon monoxide intoxication: an updated
 review. Journal of the neurological sciences, 262(1-2), 122-130.
Ragettli, M. S., Goudreau, S., Plante, C., Fournier, M., Hatzopoulou, M., Perron, S. and Smargiassi, A.
 (2016). Statistical modeling of the spatial variability of environmental noise levels in Montreal,
 Canada, using noise measurements and land use characteristics. Journal of Exposure Science
 and Environmental Epidemiology, 26(6), 597.
Sportisse, B. (2007). A review of current issues in air pollution modeling and simulation.
 Computational Geosciences, 11(2), 159-181.
World Health Organization, & UNAIDS. (2006). Air quality guidelines: global update 2005. World
 Health Organization.
Yang, G. Y. C. (1995). Geological mapping from multi-source data using neural networks. Geomatics
 Engineering, University of Calgary.
Zhou, L., Pan, S., Wang, J. and Vasilakos, A. V. (2017). Machine learning on big data: Opportunities
 and challenges. Neurocomputing, 237, 350-361.

 Pollution is licensed under a "Creative Commons Attribution 4.0 International (CC-BY 4.0)"
You can also read