Odour emission from primary settling tanks after air-tightening - Sciendo
←
→
Page content transcription
If your browser does not render page correctly, please read the page content below
Pol. J. Chem. Tech., Vol. 22, No. 4, 2020            Polish Journal of Chemical Technology, 22, 4, 10.2478/pjct-2020-0034

Odour emission from primary settling tanks after air-tightening
      Małgorzata Friedrich1*, Paulina Mizerna-Nowotna2, Filip Latzke3
      1
        West Pomeranian University of Technology Szczecin, Faculty of Chemical Technology and Engineering, Department of
      Chemical and Process Engineering, Piastów Avenue 42, 71-065 Szczecin, Poland
      2
        AQUANET S.A., ul. Dolna Wilda 126, 61-492 Poznań, Poland
      3
        West Pomeranian University of Technology Szczecin, Faculty of Chemical Technology and Engineering, Piastów Ave-
      nue 42, 71-065 Szczecin, Poland
      *
        Corresponding author: e-mail: malgorzata.friedrich@zut.edu.pl

      The purpose of the present article was to determine odour emission rate from primary settling tanks after her-
      metisation. The paper presents the results of the research on odour emission from four settling tanks, covered with
      self-supporting aluminium domes with a diameter of 52 meters, located on urban wastewater treatment plants, with
      the planned flow capacity equal to 200 000 m3/day. Altogether, the olfactometry analysis of 189 samples of polluted
      air pulled from the domes with the use of an air blower which has efficiency of 12 000 m3/h was conducted. The
      results of odour concentration measurements were in a range of approximately 10 800 to 763 600 ouE/m3. Average
      odour emission rate was equal to 102 ouE/(s · m2). The obtained value is much higher than the literature data,
      available for non-hermetised settlers only. This rate enables better estimation of the odour stream that has to be
      deodorised after sealing the settling tanks.

      Keywords: odour emission, odour emission rate, air tightening, primary settling tank, wastewater treat-
      ment plant.

INTRODUCTION                                                       able emission of pollutions. The size of this emission
                                                                   depends on numerous factors, such as: composition of
   Nowadays, technologies and installations that have the
                                                                   wastewater, their turbulence, pH, temperature, size of
least possible impact on the environment are desirable1–2.
                                                                   mass exchange area (liquid – gas), and wind velocity over
One of the most onerous impacts is odorous impact3–7.
                                                                   this surface24, 31, 35–37. Therefore, taking representative
Odour nuisance can be counteracted in various ways,
such as: change of type of resources or technologies,              samples for olfactometric analysis is problematic38–41. The
modification of process parameters, increase of ejection           methodology for collecting samples to determine odour
point of polluted air to the atmosphere, hermetisation,            emission from surface sources is still not standardised.
deodorisation and also – in the case of new objects –              In practice, wind tunnels or shields are used to cover
proper localization8–18. The choice of the optimal solution        section of sewage surface, enforcing flow of known size
is possible by modelling odorants dispersion. As a result          underneath them (see Fig. 1). Samples of polluted air
of such calculations, the olfactory range of the installa-         are taken at the outlet from the tunnel/shield, in a simi-
tion impact can be estimated for the subject matter in             lar way as organised emission. Construction of tunnels
question19–23. However, the use of deodorisation with              and shields is varied, which can significantly affect the
a certain odour abatement efficiency is frequently the             measurement results39.
only possible solution.
   There are various methods of deodorisation. The cho-
ice of the right one depends strictly on the parameters
of the air stream to be treated, such as: volume flow,
temperature, humidity or pollutant charge, as well as
expected odour concentration reduction level24. In order
to design a suitable deodorising installation, knowledge
of the odour concentration in the treated stream is
needed. This quantity can be estimated in two ways: by
                                                                   Figure 1. Principle of sampling on a passive surface source24
performing olfactometric measurements at the source of
emission, or by using literature data – odour emission                Literature data on odour emissions from primary set-
rates25–29. However, there are facilities, such as primary         tling tanks are few and far between. In 2004 Frechen
settling tanks that are a dominant source of odour nu-             published odour emission rates from primary settling
isance generated by wastewater treatment plants, where             tanks, relating to one m3 of sewage area, at the level of
determination of odour emission is problematic30–34.
                                                                   0.64 ouE/s, and for weir – 2.14 ouE/s (see Table 1)24. In
   The primary settling tanks are the last stage of the
                                                                   2015 Sówka, Sobczyński and Miller presented the results
mechanical wastewater treatment and are large, usually
                                                                   of odour emission measurements from the primary set-
round or rectangular tanks with proper instrumentation,
where sewage flows through. Their task is to remove                tler obtained in selected months, ranging from 30.9 ouE/
easily falling suspensions (as a result of sedimentation)          (s · m2) to 72.9 ouE/(s · m2) (see Table 2)42. In turn, the
as well as suspensions lighter than water, which flow to           Sobczyński, Sówka and Bezyk publication (also from
the surface.                                                       2015) presents 14 results of odour emission measurements
   The primary settling tanks are diffusion sources,               from the primary settling tank (see Table 3), carried out
characterized by large surface and unorganized vari-               in the period from October to February, whose average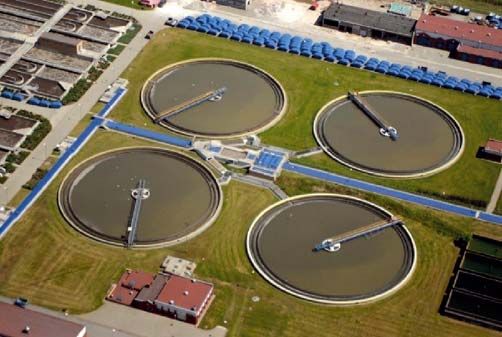
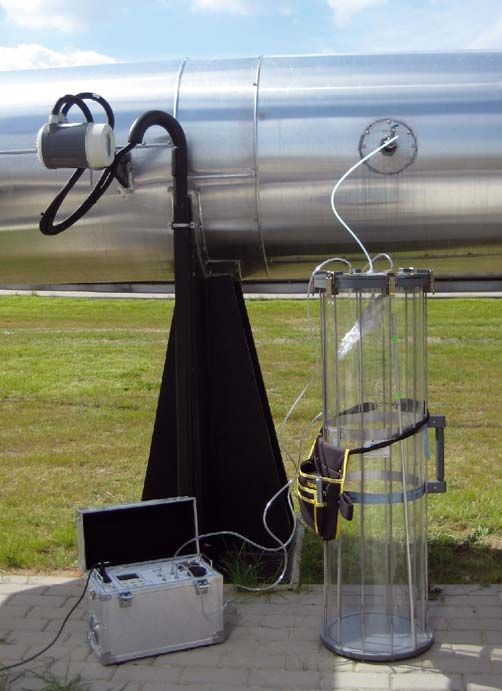
Pol. J. Chem. Tech., Vol. 22, No. 4, 2020

Table 1. Odour emission rates from the primary settling tanks according to24

Low – mean minus standard deviation; High – mean plus standard deviation; Maximum – maximum value obtained from the me-
asurements; No. of values – number of values on the basis of which the mean was calculated; No. of WWTP – number of objects
on the basis of which the research was conducted

Table 2. Odour emission rates from the primary settling tanks according to42

Table 3. Odour emission rates from the primary settling tanks according to43

value, related to 1 m2 of the sewage area, is 22,8 ouE/            Table 4. Technical parameters of the primary settling tanks on
(s · m2), and the minimum and maximum values of 7,9                         the basis of which the tests were carried out
ouE/(s · m2) and 68.5 ouE/(s · m2) respectively43.
  Differences in the above mentioned values of the odour
emission rates from the primary settling tanks may have
a significant impact on the values determined with their
use. As a result, this may lead to an incorrect estimation
of the odour impact range of the primary settling tanks
or the size of the odour flow rate after settlers have been
sealed air tight. The literature on the subject is missing
information on odour emission from primary settling tanks            Settling tanks worked simultaneously. The wastewater
after hermetization. In this work, the rate of odour emis-         was distributed evenly to them from the distribution
sion from hermetized primary settling tank was estimated           chamber. These were the wastewater after the retention of
on the basis of a large set of results of olfactometric            larger solid contaminants on the screenings and removal
measurements conducted under real conditions.                      of mineral suspended matter in sand traps.

OBJECT OF STUDY                                                    RESEARCH METHODOLOGY
  The research was carried out on a mechanical – bio-                 Measurements of odour emission from the settling tanks
logical municipal wastewater treatment plant with an               were carried out after their air tightening with the use of
increased degree of biogen removal and full processing             a „solid – self supporting” aluminium cover (see Fig. 3). The
of sewage sludge. This treatment plant treats wastewater           flow of the ventilation air from each of the settling tanks was
from both households and industrial plants (e.g. food              12 000 m3/h. The measurments were carried out over a period
industry, pharmaceutical industry, automotive industry,            of 6 years, starting in 2014, when the first two covers were
cosmetics industry, printing industry and chemical indus-          installed. A total of 6 measurement sessions were conducted,
try). Its designed capacity is 200 000 m3/d. Four identical        one each in February (2015), and October (2017) and three
horizontal flow radial settlers with chain scrapers were           each in September (2014, 2018 and 2019). The measurement
tested (see Fig. 2). The technical parameters of each of           sessions lasted from 2 to 4 days, depending on the number of
the settling tanks are presented in Table 4.                       settling tanks testet (see Table 5). Only one settling tanks was

Figure 2. Primary settling tanks before hermetization              Figure 3. Primary settling tanks after hermetization
Pol. J. Chem. Tech., Vol. 22, No. 4, 2020
Table 5. Characteristics of the measurement sessions
D – length of the measurement session, PS – number of settling tanks tested, S – total number of the samples taken, T – air tem-
perature, P – atmospheric pressure, H – atmospheric humidity, a – mean value, l – minimum value, m – maximum value
assessed every day. Nine ventilation air samples were taken Immediately after sampling, the samples were trans-
from each settling tank. Samples were taken at different times ported to the Mobile Olfactometric Laboratory, installed
of the day, on average every 1,5 hours. about 2 km from the research facility, where the olfacto-
Between subsequent observations, atmospheric condi- metric analysis was performed. During the measurements,
tions were monitored with the use of Testo 400 meter environmental conditions, such as temperature and CO2
and appropriate probes. Table 5 summarises the sampling concentration, in the laboratory were monitored. The
atmospheric conditions, the average value (a) of the determination of odour concentration (cod [ouE/m3]) was
atmospheric pressure, temperature, humidity, and their carried out using the dynamic dilution method according
to the EN 13725:2003 „Air quality – Determination of
lowest (l) and highest (m) values.
odour concentration by dynamic olfactometry”25 using
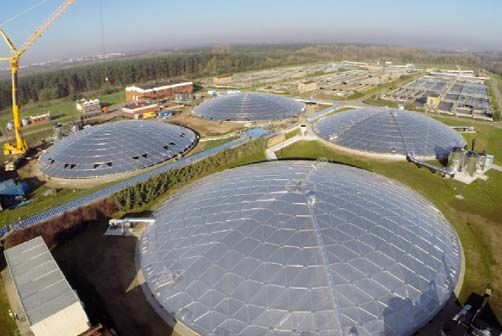
The „lung” method without pre-dilution was used
a TO7 (measurement sessions in 2014 and 2015) or
for sampling. The sampling system consisted of a rigid
TO9 (measurement sessions in 2017, 2018 and 2019)
container, in which the bag was placed, a control system four-panelist station olfactometer. They were attended
producing a vacuum in the container and a probe in the by an experienced odour panel with olfactory sensitivi-
form of a teflon tube with an inside diameter of 4 mm ty to n-butanol controlled in accordance with the EN
(see Fig. 4). Two probes were used alternately for each 13725 (the panelists conducted between several dozen to
measuring point. Each probe was flushed with clean air more than 2000 controls in their measurement history).
before the next use. Samples were taken continuously A total of 18 panelists took part in the study. The yes/
for about 10÷20 minutes at a speed of about 50÷100 no method was used to present samples to the panelists.
l/h. Each sample was taken into a new bag made of The samples were pre-diluted before connection to the
Nalophan film and a teflon tube with a stopper. olfactometer. Two odour concentration determinations
were performed for each sample.
The results from all the settling tanks obtained during
one measurement session were treated as one set of
data, for which the average and 95% confidence interval
were calculated. The confidence interval of the measured
odour concentration for the measurement session was
determined from the relationship:
where
yw – average of the measurement results
m – expected value
t – Student`s factor for n = ∞ (t ≈ 2 for 95% confi-
dence interval)
n – number of observations (n depending on the me-
asurement session)
sr – standard deviation for precision measurement
determined as a result of the international Proficiency
Test of Olfactometry in a given year.
RESULTS AND DISCUSSION
The set of results of odour concentration (cod) mea-
surements in the ventilation air stream of the primary
settling tanks after air-tightening, obtained in particular
measurement sessions is shown in Fig. 5. The mean value
of odour emission (qod,mean – geometric mean from n
observations in a given measurement session) together
Figure 4. Sampling for the determination of odour concentra- with 95% confidence interval of the result obtained for
tion particular measurement sessions is presented in Table 6.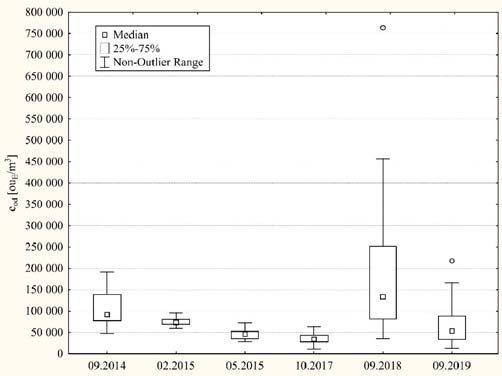
Pol. J. Chem. Tech., Vol. 22, No. 4, 2020

Table 6. Results of the evaluation of the odour emission in individual measurement sessions

                                                                      Table 8 shows the average values of odour emission
                                                                   rates from the primary settling tank after air-tightening
                                                                   (together with the 95% confidence interval of the result),
                                                                   calculated for individual measurement sessions. These
                                                                   ratios are expressed in odour units per second and related
                                                                   to 1 m2 of sewage area. The average value of the rate for
                                                                   the whole set of data collected during six measurement
                                                                   sessions (total of 189 values) was 102 ouE/(s · m2). The
                                                                   rate corresponding to the highest recorded value of the
                                                                   odour concentration in this set is 1200 ouE/(s · m2). The
                                                                   values obtained differ significantly from the literature
                                                                   data24, 42, 43, determined on the basis of studies carried out
                                                                   in open primary settling tanks (without air-tightening).
                                                                   It is therefore confirmed that for the determination of
                                                                   odour emissions from large surface sources (such as set-
Figure 5. Distribution of odour concentration measurement          tling tanks), the method of sampling for olfactometric
          results obtained in individual measurement sessions      analysis is important. Therefore, the rates determined
                                                                   for this source before air-tightening cannot be used to
Table 6 also shows the lowest (qod,min) and the highest            estimate the size of the polluted odour stream, emitted
(qod,max) value of odour emission recorded in particular           from the primary settling tanks after air-tightening. It
measurement sessions.                                              is necessary to apply the rate relating to air-tightened
  The results obtained confirm high variability of odour           settling tanks.
concentration in the ventilation air stream of the primary
                                                                   Table 8. Odour emission rates from the primary settling tanks
settling tanks after air-tightening. Both the highest values
                                                                            after air-tightening
and the highest spread of the results were obtained in
September 2018. This may be related to weather condi-
tions and the associated residence time of the wastewater
in the settling tanks. The period preceding the session
was characterized by low precipitation and relatively high
temperatures (see Table 7). In turn, the lowest values
were obtained in October 2017, the period with the most
rainfall. Therefore, it can be assumed that the more
wastewater is diluted by precipitation and stays shorter
in settling tanks, the lower the odour emission from the
                                                                   CONCLUSIONS
primary settling tanks. In addition, it can be noted that
the higher the temperature of the atmospheric air, the                Primary settling tanks are an important source of
greater the variation in odour concentration in the air            odour nuisance at wastewater treatment plants. One of
discharged from the settling tanks. However, determi-              the ways to reduce this nuisance is hermetization of the
nation of this relationship is a separate research topic.          settling tanks and deodorization of the ventilation air.
                                                                   When estimating the amount of pollutants in the air to
Table 7. Characteristics of atmospheric conditions for the week
         and month preceding a given measurement session44         be treated, rates related to the settling tanks after air-
                                                                   tightening should be used. Using the values set for open
                                                                   tanks, the projected emissions may be significantly un-
                                                                   derestimated in relation to the actual ones, and this may
                                                                   result in an inefficient installation of the air purification
                                                                   plant of the air discharged from the settling tanks. The
                                                                   average odour emission rate of the primary settling tanks
                                                                   after air-tightening is 102 ouE/(s · m2). The minimum
                                                                   value recorded during the tests is 17 ouE/(s · m2) and
                                                                   the maximum one is 1200 ouE/(s · m2). Higher values
                                                                   and higher variability of emissions were observed in the
weekly – covers 7 days before the end of a given measure-
ment session; monthly – covers 30 days before the end of the
                                                                   case of measurement sessions characterized by lower
measurement session                                                precipitation and higher temperatures.
Pol. J. Chem. Tech., Vol. 22, No. 4, 2020
LITERATURE CITED 17. Reyes, J., Gutiérrez, M.C., Toledo, M., Vera, L., Sán-
chez, L., Siles, J.A. & Martín, M.A. (2020). Environmental
1. Moran, S. (2017). Pollution Control. In S. Moran (Eds.),
performance of an industrial biofilter: Relationship between
Process Plant Layout, 2nd Edition (pp. 187–206). Butterworth-
photochemical oxidation and odorous impacts. Environ. Res.,
-Heinemann.
183, 109168. DOI: 10.1016/j.envres.2020.109168.
2. Badach, J., Kolasińska, P., Paciorek, M., Wojnowski, W.,
18. Zhang, X.L., Yan, S., Tyagi, R.D. & Surampalli, R.Y.
Dymerski, T., Gębicki, J., Dymnicka, M. & Namieśnik, J. (2018).
(2013). Odor control in lagoons. J. Environ. Manag., 124, 62–71.
A case study of odour nuisance evaluation in the context of
DOI: 10.1016/j.jenvman.2013.03.022.
integrated urban planning. J. Environ. Manag., 213, 417–424.
DOI: 10.1016/j.jenvman.2018.02.086. 19. Muñoz, R., Sivret, E.C., Parcsi, G., Lebrero, R., Wang,
3. Conti, C., Guarino, M. & Bacenetti J. (2020). Mea- X., Suffet, I.H. & Stuetz, R.M. (2010). Monitoring techniques
surements techniques and models to assess odor annoyance: for odour abatement assessment. Water Res., 44(18), 5129–5149.
A review. Environ. Internat., 134, 105261, DOI: 10.1016/j. DOI: 10.1016/j.watres.2010.06.013.
envint.2019.105261. 20. Capelli, L., Sironi, S., Del Rosso, R., Céntola, P., Ros-
4. Aatamila, M., Verkasalo, P.K, Korhonen, M.J., Suominen, si, A. & Austeri, C. (2011). Olfactometric approach for the
A.L., Hirvonen, M.R., Viluksela, M.K. & Nevalainen, A. (2011). evaluation of citizens’ exposure to industrial emissions in the
Odour annoyance and physical symptoms among residents living city of Terni, Italy. Sci. Total Environ., 409(3), 595–603. DOI:
near waste treatment centres. Environ. Res., 111(1), 164–170. 10.1016/j.scitotenv.2010.10.054.
DOI: 10.1016/j.envres.2010.11.008. 21. Capelli, L., Sironi S., Del Rosso R. & Guillot J.M. (2013).
5. Capelli, L., Sironi, S., Del Rosso, R., Céntola, P., Rossi, Measuring odours in the environment vs. dispersion modelling:
A. & Austeri, C. (2011). Odour impact assessment in urban A review. Atmospheric Environ., 71, 731–743. DOI: 10.1016/j.
areas: case study of the city of Terni. Proc. Environ. Sci., 4, atmosenv.2013.07.029.
151–157. DOI: 10.1016/j.proenv.2011.03.018. 22. Sommer-Quabach, E., Piringer, M., Petz, E. & Schauber-
6. Brancher, M., Griffiths, K.D., Franco, D. & de Melo ger, G. (2014). Comparability of separation distances between
Lisboa, H. (2017). A review of odour impact criteria in selected odour sources and residential areas determined by various
countries around the world. Chemosphere, 168, 1531–1570. national odour impact criteria. Atmospheric Environ., 95, 20–28.
DOI: 10.1016/j.chemosphere.2016.11.160. DOI: 10.1016/j.atmosenv.2014.05.068.
7. Nicell, J.A. (2009). Assessment and regulation of odour 23. Lucernoni, F., Capelli, L. & Sironi, S. (2017). Com-
impacts. Atmospheric Environ., 43(1), 196–206. DOI: 10.1016/j. parison of different approaches for the estimation of odour
atmosenv.2008.09.033. emissions from landfill surfaces. Waste Manag., 63, 345–353.
8. Estrada, J.M., Kraakman, N.J.R., Lebrero, R. & Muñoz, DOI: 10.1016/j.wasman.2016.09.041.
R. (2015). Integral approaches to wastewater treatment plant 24. Frechen, F.B. (2004). Odour emission inventory of Ger-
upgrading for odor prevention: Activated Sludge and Oxidized man wastewater treatment plants - odour flow rates and odour
Ammonium Recycling. Biores. Technol. 196, 685–693. DOI: emission capacity. Water Sci. Technol., 50(4), 139–146. DOI:
10.1016/j.biortech.2015.08.044. 10.2166/wst.2004.0244.
9. Lewkowska, P., Cieślik, B., Dymerski, T., Konieczka, P. 25. European Committee for Standardization. (2003).
& Namieśnik, J. (2016). Characteristics of odors emitted from European Standard: Air Quality − Determination of Odor
municipal wastewater treatment plant and methods for their Concentration by Dynamic Olfactometry. EN13725:2003.
identification and deodorization techniques. Environ. Res. 151, Brussels, Belgium.
573–586. DOI: 10.1016/j.envres.2016.08.030. 26. Zilio, M., Orzi, V., Chiodini, M., Riva, C., Acutis, M.,
10. Barbusinski, K., Kalemba, K., Kasperczyk, D., Urbaniec, Boccasile, G. & Adani, F. (2020). Evaluation of ammonia and
K. & Kozik, V. (2017). Biological methods for odor treatment odour emissions from animal slurry and digestate storage in
– A review. J. Cleaner Prod., 152, 223–241. DOI: 10.1016/j. the Po Valley (Italy). Waste Management., 103, 296–304. DOI:
jclepro.2017.03.093. 10.1016/j.wasman.2019.12.038.
11. Shammay, A., Sivret, E.C., Le-Minh, N., Lebrero Fernan-
27. Toledo, M., Gutiérrez, M.C., Siles, J.A. & Martín, M.A.
dez, R., Evanson, I. & Stuetz, R.M. (2016). Review of odour
(2018). Full-scale composting of sewage sludge and market
abatement in sewer networks. J. Environ. Chem. Engin., 4(4),
waste: Stability monitoring and odor dispersion modeling.
3866–3881. DOI: 10.1016/j.jece.2016.08.016.
Environ. Res., 167, 739–750. DOI: 10.1016/j.envres.2018.09.001.
12. Lebrero, R., Rodríguez, E., García-Encina, P.A. &
28. Schauberger, G., Lim, T.T., Ni, J.Q., Bundy, D.S., Hay-
Muñoz, R. (2011). A comparative assessment of biofiltration
more, B.L., Diehl, C.A. & Heber, A.J. (2013). Empirical model
and activated sludge diffusion for odour abatement. J. Hazard.
of odor emission from deep-pit swine finishing barns to derive
Mater., 190(1–3), 622–630. DOI: 10.1016/j.jhazmat.2011.03.090.
13. Estrada, J.M., Kraakman, N.J.R.B., Muñoz, R. & Lebre- a standardized odor emission factor. Atmospheric Environ., 66,
ro, R. (2011). A Comparative Analysis of Odour Treatment 84–90. DOI: 10.1016/j.atmosenv.2012.05.046.
Technologies in Wastewater Treatment Plants. Environ. Sci. 29. Lucernoni, F., Tapparo, F., Capelli, L. & Sironi, S. (2016).
Technol., 45(3), 1100–1106. DOI: 10.1021/es103478j. Evaluation of an Odour Emission Factor (OEF) to estimate
14. Hansen, N.G. & Rindel, K. (2000). Bioscrubbing, an ef- odour emissions from landfill surfaces. Atmospheric Environ.,
fective and economic solution to odour control at wastewater 144, 87–99. DOI: 10.1016/j.atmosenv.2016.08.064.
treatment plants. Water Sci. Technol., 41(6), 155–164. DOI: 30. Stuetz, R. & Frechen, F.B. (2005). Odours in Wastewater
10.2166/wst.2000.0105. Treatment Measurement, Modelling and Control. IWA Publishing.
15. Brancher, M., Piringer, M., Franco, D., Filho, P.B., De Retrieved March 15, 2020. from https://iwaponline.com/ebooks/
Melo Lisboa, H. & Schauberger, G. (2019). Assessing the inter- book/29/Odours-in-Wastewater-Treatment-Measurement. DOI:
annual variability of separation distances around odour sources 10.2166/9781780402932.
to protect the residents from odour annoyance. J. Environ. Sci., 31. Lebrero, R., Bouchy, L., Stuetz, R. & Muñoz, R. (2011).
79, 11–24. DOI: 10.1016/j.jes.2018.09.018. Odor Assessment and Management in Wastewater Treatment
16. Tabase, R.K., Millet, S., Brusselman, E., Ampe, B., De Plants: A Review. Critical Rev. Environ. Sci. Technol., 41(10),
Cuyper, C., Sonck, B. & Demeyer, P. (2020). Effect of ventila- 915–950. DOI: 10.1080/10643380903300000.
tion control settings on ammonia and odour emissions from 32. Gostelow, P., Parsons, S.A. & Stuetz, R.M. (2001). Odour
a pig rearing building. Biosystems Engin., 192, 215–231. DOI: measurements for sewage treatment works. Water Res., 35(3),
10.1016/j.biosystemseng.2020.01.022. 579–597. DOI: 10.1016/s0043-1354(00)00313-4.Pol. J. Chem. Tech., Vol. 22, No. 4, 2020
33. Sówka, I., Grzelka, A. & Miller, U. (2017). Problematyka 40. Hudson, N., Ayoko, G.A., Dunlop, M., Duperouzel, D.,
odorów w procesach gospodarki ściekowej. Wodociągi-Kanali- Burrell, D., Bell, K. & Heinrich, N. (2009). Comparison of
zacja. 6(160), 39–42. odour emission rates measured from various sources using
34. Capelli, L., Sironi, S., & Rosso, R.D. (2014). Odour Emis- two sampling devices. Biores. Technol., 100(1), 118–124. DOI:
sion Factors: Fundamental Tools for Air Quality Management. 10.1016/j.biortech.2008.05.043.
Chem. Engin. Transac., 40, 193–198. DOI: 10.3303/CET1440033. 41. Hudson, N., Bell, K., McGahan, E., Lowe, S., Galvin, G.
35. Hudson, N. & Ayoko, G.A. (2008). Odour sampling 1: & Casey, K. (2007). Odour emissions from anaerobic piggery
Physical chemistry considerations. Biores. Technol., 99(10), ponds. 2: Improving estimates of emission rate through recogni-
3982–3992. DOI: 10.1016/j.biortech.2007.04.034. tion of spatial variability. Biores. Technol., 98(10), 1888–1897.
36. Nagaraj, A. & Sattler, M. (2005). Correlating Emissions DOI: 10.1016/j.biortech.2006.06.013.
42. Sówka, I., Sobczyński, P. & Miller, U. (2015). Wpływ
with time and temperature to predict worstcase emissions from
sezonowej zmienności odorów emitowanych ze źródeł po-
open liquid area sources. J. Air & Waste Manag. Assoc., 55(8),
wierzchniowych pasywnych na zasięg oddziaływania zapacho-
1077–1084. DOI: 10.1080/10473289.2005.10464713.
wego wybranej komunalnej oczyszczalni ścieków. Rocz. Ochr.
37. Schwarzenbach, R., Gschwend, P. & Imboden, D. (2003).
Środ., 17(2), 1339–1349.
Environ. Organic Chem., 2nd Edition. New York: John Wiley 43. Sobczyński, P., Sówka, I. & Bezyk, Y. (2015). Charak-
& Sons. terystyka zmienności emisji odorów z osadników wstępnych i
38. Capelli, L., Sironi, S., Del Rosso, R., & Céntola, P. jej wpływ na zasięg oddziaływania zapachowego oczyszczalni
(2009). Design and validation of a wind tunnel system for ścieków komunalnych. In A. Kotowski, K. Piekarska & B.
odour sampling on liquid area sources. Water Sci. Technol., Kaźmierczak (Eds.) Interdyscyplinarne zagadnienia w inżynierii
59(8), 1611–1620. DOI: 10.2166/wst.2009.123. i ochronie środowiska. Tom 6 (pp. 356–363). Wrocław: Of.
39. Hudson, N. & Ayoko, G.A. (2008). Odour sampling. 2. Wydaw. Polit. Wroc.
Comparison of physical and aerodynamic characteristics of 44. Meteomodel (2019, March). Pogoda i Klimat. Retrieved
sampling devices: A review. Biores. Technol., 99(10), 3993–4007. March 23, 2020, https://meteomodel.pl/aktualne-dane-pomiar-
DOI: 10.1016/j.biortech.2007.03.043. owe/.You can also read