NATIONAL SURVEILLANCE OF SARS-COV-2 IN WASTEWATER - Last developments and results - May 2021 - Sciensano
←
→
Page content transcription
If your browser does not render page correctly, please read the page content below
NATIONAL SURVEILLANCE OF
SARS-COV-2 IN WASTEWATER
 Last developments and results - May 2021

 _
Sciensano
 Epidemiology and public health
 Infectious diseases in humans
 Raphaël Janssens, Hadrien Maloux, Marie Lesenfants

 In collaboration with
The Partners listed here below, with a closer contribution of e-Biom, UNamur, SPGE, UGent and
 UAntwerpen

 Partners :

 Contact person: Coordinator of the present Surveillance :
 Marie Lesenfants • marie.lesenfants@sciensano.be

 2
SUMMARY
The present report is dedicated to the SARS-CoV-2 wastewater national surveillance in Belgium and
aims to communicate about the project and the resulting epidemiological information which is available.

The national surveillance of SARS-CoV-2 in wastewater covers the three regions of Belgium and is
effective since mid-September 2020. Over 40% of the Belgian population is included in the surveillance
through 24h-representative wastewater samples taken at the inlet of 42 wastewater treatment plants,
twice a week (see Figure 1). Three laboratories, spread over the country, are analyzing SARS-CoV-2 in
these wastewater samples.

The principle of the present surveillance is to have a global view of the SARS-CoV-2 circulation in the
population through a non-invasive method, meaning the analysis of the viral load in the wastewater.
Given that a large part of infected people, even if asymptomatic, are excreting viral particles in their
faeces, the viral load of SARS-CoV-2 in wastewater can be used as an indicator of its circulation in the
population.

The objectives of the national wastewater surveillance are (i) to early-detect any significant increase of
the SARS-CoV-2 circulation and, more largely, (ii) to provide information about the SARS-CoV-2
circulation among populations, which complements other existing epidemiological indicators (i.e.
laboratory-based confirmed cases, positivity ratio of tested persons, hospital admissions,
seroprevalence, mortality, …).
The main added value of the wastewater surveillance is triple:
 1. Wastewater can track the part of the population which is infected but may not be tested, for
 example, due to the absence of symptoms.
 2. It can early detect a significant surge of the sanitary situation days before a surge in the
 laboratory-based confirmed cases, the hospital admissions, and on mortality rate.
 3. Wastewater surveillance captures all persons physically present in a certain geographic
 catchment area, no matter their administrative status, health care seeking behavior, or
 compliance with COVID-19 testing recommendations. Besides, the results are independent of
 possible changes occurring in the testing strategy, motivations for testing, and barriers for
 testing.

The present report provides the study set-up, the analysis methodology, and additional background
information which supports the interpretation of the SARS-CoV-2 wastewater surveillance results.
Based on the surveillance results, a predictive early-warning model is under development. The
preliminary analysis of the predictive performance of the model, as well as the first results of the tool,
are also presented in the present report. The model highlights the areas of concern, among the areas
covered by the surveillance (see Figure 1), and classifies them in 3 categories: “High circulation of
SARS-CoV-2”, “Fast increase in wastewater viral load” and “Increasing trend in wastewater viral load”,
(see the “Results and discussion” section for more details).

This early warning information will also become available for real-time risk assessment of the
epidemiological situation in Belgium and is a promising tool for decision-makers in the current COVID-
19 crisis management.

The results of SARS-CoV-2 wastewater surveillance can support crisis management and decision-
making. They should be considered complementary to the other available surveillance indicators
(laboratory-based positive cases, hospitalizations, changes in testing policy, positivity ratio, mobility, the
situation in schools, etc.) in the light of the emergence of SARS-CoV-2 variants of concern.

 3
In conclusion, although further developments are still ongoing to better define the predictive performance
of the SARS-CoV-2 wastewater-based surveillance, it appears as a valuable tool for the follow-up of the
epidemiological situation in Belgium.

INTRODUCTION
The SARS-CoV-2 national wastewater surveillance has been launched in Belgium since mid-September
2020. Sciensano coordinates this project with 5 direct partners: the University of Antwerp, Ghent
University, the University of Namur, e-Biom (spin-off of the University of Namur) and the SPGE (Société
Publique de Gestion de l'Eau). Indirect partners are also involved: the SBGE (Société Bruxelloise de
Gestion de l'Eau), Aquiris (Veolia) and Aquafin. The regional public health agencies are members of the
project's Support Committee. We also collaborate with the Dutch Institute for Public Health and the
Environment (RIVM). Besides, we are in contact with other European countries which have developed
similar surveillance program, notably through the European efforts to connect and foster the different
Member states initiatives on the topic, and also more largely within the World Health Institute (WHO)
network.

The preliminary results of the wastewater surveillance were communicated in December 2020 in
agreement with the stakeholders (cfr. Sciensano press release1). At that time, too many factors were
still missing in the model to validate the detection tool for SARS-CoV-2 resurgence.

From mid of February 2021, some of the uncertainty factors were tackled by performing extra lab
analyzes on the wastewater samples: the quantification of SARS-CoV-2 genomic traces in RNA
copies/ml, and a faecal load estimation by quantifying the PMMoV RNA (Pepper mild mottle virus, or
“red pepper virus”). Thanks to these extra lab results, the interpretability of the wastewater surveillance
was improved.

Precautions must still be taken in the interpretation of the wastewater surveillance results as an increase
in SARS-CoV-2 concentrations in wastewater does not systematically correlate with an increase of the
COVID-19 laboratory-based confirmed cases. A perfect correlation of the two metrics is however not
expected. For instance, unlike case-based surveillance, wastewater surveillance monitors the whole
population and includes untested asymptomatic cases. Also, wastewater is a complex matrix that is
more unstable compared to clinical samples and has a fluctuating physical and chemical composition,
which has an impact on the quantification of SARS-CoV-2 RNA concentration. Also, several additional
factors are expected to influence the correlation between SARS-CoV-2 concentrations in wastewater
and the laboratory-based confirmed cases (see the “Uncertainties and future developments” section).
The changes in the clinical testing and/or in the virus shedding dynamic due to the emergence of variants
() may also impact the correlation. While some of these factors are measurable and the impact of these
factors can be included in the qualitative analysis, the impact of other factors remains unknown.
The identification of the interfering factors causing non-significant or weak correlations is currently
performed intending to correct their effect.

1
 https://www.sciensano.be/fr/coin-presse/covid-19-surveillance-des-eaux-usees-resultats-preliminaires,
https://www.sciensano.be/nl/pershoek/covid-19-surveillance-van-het-afvalwater-voorlopige-resultaten
 4
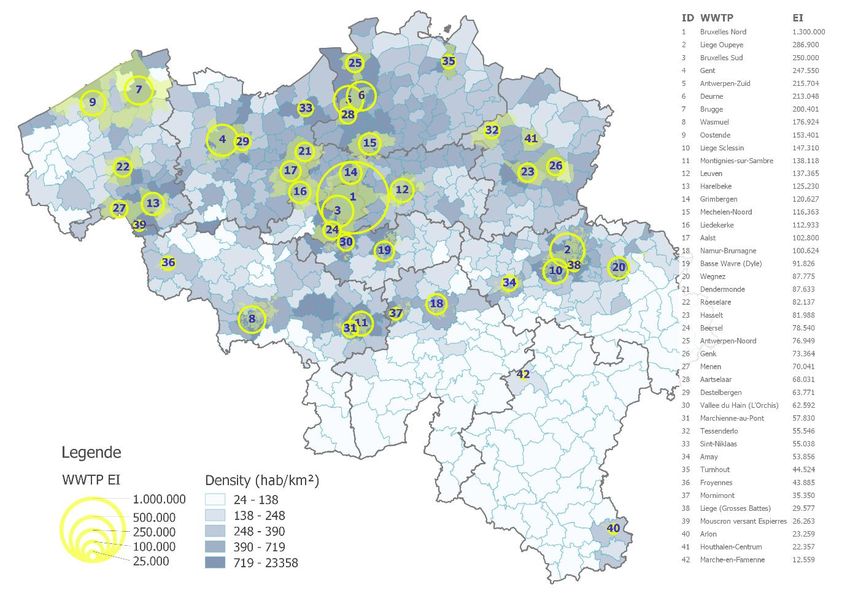
METHODOLOGY
Wastewater sample collection and SARS-CoV-2 analysis
The project covers over 40% of the Belgian population. The choice of the population included in the
present surveillance is based on the following epidemiologic hypothesis: high-density areas are more
likely to lead to a more rapid increase in the circulation of the virus in that population (in comparison to
areas of less density). Regarding the early-warning objective of the tool, this hypothesis was used as
the main criterion to select the treatment plants to investigate in this project (see Figure 1). The map
below shows the population density of each municipality, the location of the selected stations, and with
the yellow circles, the population equivalents (EI) monitored by the wastewater surveillance program.

 Figure 1: wastewater sampling plan coverage

Practically, 24-hour composite samples are collected twice a week on Mondays and Wednesdays from
the 42 wastewater treatment plants (WWTPs) and analyzed by three different laboratories on Tuesdays
and Thursdays. Once collected, the samples are stored at 4°C and analyzed by RT-qPCR within 24
hours. Three target sequences located in two genes of the SARS-CoV-2 genome are analyzed in
duplicate: the N1- and N2-sequence, targeting the N-gene encoding for the nucleoprotein, and the E-
gene encoding for the viral envelope protein.
Influent flow rates of each WWTPs, as well as the estimated population connected to the sewage system
of each WWTP, are provided by the regional water agencies.

Laboratory-based confirmed cases data
COVID-19 laboratory tests from clinical samples (negative and positive results) are reported at the
municipality level. From the laboratory-based confirmed cases at the municipality level, we estimate the
number of confirmed cases related to each wastewater catchment area using a population-based

 5
proportional rule, intending to compare wastewater- and confirmed case indicators for a similar
geographical zone.

Towards SARS-CoV-2 quantification
From mid-September 2020 until mid-February 2021, an approach called semi-quantitative was
developed to report the results in a semi-quantitative way by expressing analytical measures in Cycle
threshold values (Ct). Avoiding performing quantification at the early stage of the project allowed to
reduce the analysis costs while starting to develop the surveillance tool on observed trends of the viral
circulation in the areas covered by the surveillance. In a second time, from mid-February 2021
onwards, a quantitative approach was used expressing the viral concentrations in RNA copies/ml.
This requires an additional calibration step to the analytical procedure. The quantitative approach allows
to reduce the measurement uncertainty related to the difference of analytical methods existing between
laboratories, and thus reach better comparability between regions. Moreover, the quantification
facilitates the normalization of SARS-CoV-2 concentrations with respect to dilution by precipitation and
faecal load parameters.
The stepwise approach was used to optimize the accuracy of the project outcomes with the limited
resources available.

During the semi-quantitative approach period, we chose to convert the Ct values into RNA relative
amount (RNA/RNAmin), which allows a better comparison of the trends between that first period and the
second one (quantitative). The transposition of Ct values in relative RNA follows a specific methodology
that was improved over time and whose current state is summarized hereafter.
Each of the 3 laboratories performed multiple calibration curves, on each of the 3 genomic targets.
These calibration curves present the relation between the Ct and RNA values as follows: = ∗
ln( ) + . From ten calibration curves distributed over time, we estimate statistically the parameter
“a” of the relation, for each lab, to finally be able to express RNA in function of Ct, using the following
expression:
 ⁄
 ⁄ = ( )

The second approach, called quantitative, was launched in mid-February when the laboratories started
to quantify the number of copies of the three targets present in each sample (copies of viral genomic
RNA/ml). For each of the three targets, calibration curves were produced, and Ct values were
enumerated towards copies RNA/ml according to the above formula. The sources of uncertainties
related to each approach are discussed later in this report.
A preliminary study evaluated the limits of detection (LOD - 95% confidence interval) of the three
targeted genes to be around 1000 copies/ml. Further analyzes will be performed to define the limits of
quantification and detections accurately.

PMMoV quantification
From mid-February 2021, the Pepper mild mottle virus (PMMoV) viral load concentration was measured
in the samples (copies/ml) in addition to the SARS-Cov-2 quantification. This virus is a well-known
indicator of human faecal contamination (load). The objective of those extra PMMoV measurements is
to estimate the population effectively represented by the area covered by each WWTP, through an
estimation of the fecal matter concentration contained in the wastewater samples.

 6
RESULTS AND DISCUSSION
Semi-quantitative approach
The results of the semi-quantitative approach are presented in Figure 2, for the Brussels North
wastewater treatment plant (WWTP). The highest signal was observed at the beginning of November
2020, corresponding to the second wave of the SARS-CoV-2 outbreak in Belgium when high levels of
laboratory-based confirmed cases were recorded. The correlation between the wastewater surveillance
results and the laboratory-based confirmed cases is high for the second wave period (14/09/2020 to
01/12/2020) for all the 42 treatment plants studied with a mean correlation coefficient of 0.86, and one
plant having a correlation coefficient below 0.5. However from the first of December 2020 to the latest
results, 5th May 2021, the correlation is weaker with a mean correlation coefficient of 0.53, and 16 plants
having a correlation coefficient below 0.5. The lower mean correlation observed after the first December
can be explained by the variation in time of the analytical methods and the viral shedding dynamics, as
discussed later in the section “Uncertainties and future developments”.

Figure 2: Results for the catchment area of Brussels North WWTP. Blue background: Wastewater
surveillance results with the relative amount of mean gene copies, and the 14 days rolling
average. Orange background: Laboratory-based positive tests dataset, test percent positivity, 7
and 14 days incidence filtered on the wastewater area of concern

Quantitative approach
Since mid-February 2021, the results are expressed for each of the three targeted genes in RNA copies
per milliliter of wastewater sample. As presented in Figure 3 for the Brussels North WWTP, the rolling
average on the past 14 days of the mean viral concentration of the three targeted genes shows a peak
with a maximum value recorded at the end of March. In this particular case, the wastewater signal is
correlated with the confirmed clinical cases.
A recent correlation study conducted on the quantitative results shows that, for the period of mid-
February to the 5th May 2021, the wastewater signal correlates well with the laboratory-based positive
results with a mean correlation coefficient of 0.55 considering all the 42 treatment plants covered by the
surveillance, and 14 treatment plants having a coefficient below 0.5 (considered period: 08/02/2021 –
05/05/2021).

 7
Figure 3: Viral concentration (the maximum and minimum values indicated as vertical lines, the
first and third quartiles as box sides and median as horizontal lines), its rolling average on the
past 14 days, the estimated limit of detection (LOD-95%), test percent positivity, and incidence
for the catchment area of the Brussels North WWTP

Alerting indicators
To highlight the treatment plants of possible concerns, three types of alerting indicators are assessed
twice a week based on the wastewater surveillance results. For example, Table 1 shows the indicators
obtained on the quantitative approach results of the 5th May 2021:

 1. WWTPs where the virus circulation has quickly increased, are classified as “Fast increase”.
 One treatment plant fulfilled the following condition: rolling average of the 3 genes mean
 concentrations2 on the past 7 days evolving faster than 20% per day.
 2. WWTPs where the virus circulation is higher than half of the highest value reported since the
 beginning of the quantification approach (mid-February) for the corresponding treatment plant,
 are classified as “High circulation”. Three treatment plants fulfilled to this condition (Mean
 cc./max > 50%).
 3. WWTPs where the circulation is of concern because increasing for 7 days or more, are classified
 as “Increasing trend”. Six treatment plants fulfilled the following condition: rolling average of
 the 3 genes mean concentrations on the past 14 days is increasing for 7 days or more.

2
 Mean of six concentrations for each sample: two duplicate for each three targeted genes
 8
Table 1: WWTPs selected by the early warning tool
 WWTP Mean Mean Cc avg. Evolution Cc avg. Incr. High Fast Incr.
 cc/max cc past 7 d. (%/day) past 14 days circ. incr. trend
 (%) (copie d.
 s/ml)
 Mouscron
 versant 73 127 83 26.88 94 2 Yes Yes No
 Espierres
 Wasmuel 37 66 123 4.15 85 7 No No Yes
 Montignies-
 66 165 138 0.55 163 7 Yes No Yes
 sur-Sambre
 Wegnez 16 40 79 -7.06 72 21 No No Yes
 Liege
 52 118 123 11.10 90 7 Yes No Yes
 Oupeye
 Houthalen-
 8 24 55 -28.12 58 7 No No Yes
 Centrum
 Marche-en-
 34 65 65 -48.17 101 14 No No Yes
 Famenne

UNCERTAINTIES AND FUTURE DEVELOPMENTS
Several future improvements are planned to reduce the uncertainties related to the semi-quantitative
and quantitative approaches. This will support the use of the wastewater indicator in the decision-making
of crisis management.

Results inter-comparability: The temporal and spatial comparison of the results is associated with
several sources of uncertainties. Regarding the temporal aspect, the semi-quantitative results on the
period before mid-February 2021 are not easily comparable to the quantitative results starting afterward.
Regarding the spatial comparison3, the transition to the quantitative approach was evaluated to reduce
the related uncertainties. However, the extent to which the results measured by different laboratories on
different treatment plants can be compared to each other remains unknown. This uncertainty will be
mitigated by performing cross-check analyzes between the 3 laboratories, and by assessing the limit of
quantification and detection of the analytical methods. Also, the quantitative approach allows for future
standardization of the results using (i) the dilution factor accounting mainly for the rain flow, and (ii) the
faecal concentrations (PMMoV) adding information on the population tracked in the wastewater sample.
These future improvements are expected to improve the comparison between the areas covered by the
different laboratories, as well as between the treatment plants.

Hospitals and nursing homes: Different major point sources of SARS-CoV-2 RNA shedding, such as
hospitals and nursing homes, are currently listed and will be considered as influencing factors for the
risk assessment.

Mobility: The mobility of the persons in the areas covered by the surveillance is a key factor that could
partially explain the variability in the correlation between the wastewater curves and the curves
corresponding to the confirmed cases (expressed through incidence and positivity ratio indicators).
UNamur is currently studying the mobility influence on the correlation results, which results will then be
implemented in the national model.

3
 To note that the spatial comparability does not only concern the regional level as Flanders is analyzed by two different
labs
 9
Parameters influencing the shedding dynamic: The individual viral shedding dynamic is influenced
by several factors: not all infected persons (~60%) are effectively shedding the virus in their faeces, the
variability in individual viral load, the variability of the duration of shedding, etc. The relation between
shedding and the severity of symptoms could also be impacted by the vaccination, which would impact
the correlation between the signal measured in wastewater compared to the positive tests. Besides, the
measured viral concentration may also depend on environmental factors, such as the temperature of
the water, the residence time4, the chemical composition (presence of industries discharging detergents
in the area), etc. The temperature effect is currently studied by UGent as a sub-research and, in case
of any promising conclusions, we foresee valorizing them in the national model.

Early detection: The predictive character of the alerting indicators still requires further analysis to
understand the correlation and the possible temporal association between the wastewater signal and
the positive cases.
Several hypotheses could explain the weak correlation observed on the semi-quantitative results from
December onwards:
 - Before mid-February 2021, most of the wastewater treatment plants were below the estimated
 limit of detection of the analytical method, which would lead to low accuracy measurements;
 - Another hypothesis could be the larger uncertainties behind semi-quantitative results compared
 to quantitative ones.
Several reasons can be stated to explain why some treatment plants have a correlation coefficient below
0.5: i) a lack of correspondence between the population tracked by wastewater compared to the clinical
tests in these specific areas, ii) higher mobility of the persons living in the area (which would not be
tracked by wastewater while being counted as laboratory-based confirmed cases, based on their
residential postcode), iii) the presence of hospitals or collectivities in the area, iv) the presence and
activity of industries, etc.
In terms of future development to support the predictive character of the tool, we will also study the
temporal lag between the wastewater and the laboratory-based confirmed case signals. Our partner e-
Biom, together with UNamur and SPGE, will further support Sciensano with the ongoing correlation
studies.

4
 Time for the wastewater to reach the treatment plant
 10
CONCLUSIONS
Since the start of the wastewater surveillance, we significantly improved our mastery of the tool.
Nevertheless, developments are still ongoing. Among those, two major developments are:
 1) The reduction of the impact of several major parameters of influence
 2) The further assessment of the predictive character of the model

The standardization of the SARS-CoV-2 viral concentrations will contribute to the first development, as
it will take into account the real population covered by the wastewater treatment plants. Regarding the
second one, we will continue improving the alerting tool and related indicators, in parallel of improving
our understanding of the background defining the correlation quality between the wastewater indicators
with the other available epidemiological indicators, such as the incidence and positivity ratio, obtained
by the laboratory-based confirmed cases surveillance.

The 3 categories of indicators developed aim to identify significant changes in wastewater surveillance
signals which should be highlighted and communicated for COVID-19 risk assessment. More precisely,
the wastewater alerting indicators are complementary to the other available indicators (hospitalizations,
positivity rate, mobility, situation in schools, etc., i.e.), and together with additional contextual elements
(e.g. testing policy, measures in place) enable policymakers and risk assessors to appraise the
epidemiological situation in its evolving context.

Once those indicators are further stabilized, they will be the core of the wastewater surveillance outputs
by supporting the weekly appraisal of the COVID-19 epidemiological situation and its risk assessment
in Belgium.
To conclude, wastewater molecular surveillance is an innovative and new technology, which needs to
be carefully developed to validate its interpretation tools for public health purposes. The quality of the
reported information, the profound scientific grounding of context in which results are presented and the
reliability of the resulting health recommendations are shared values among all participating partners of
the project.

 11
ACKNOWLEDGEMENT
We acknowledge the contribution of all involved partners: e-Biom, UNamur, SPGE, UGent, UAntwerpen,
SBGE — BMWB, Aquiris and Aquafin. We thank in particular the partners involved in the frequent
sample collection, logistics and laboratory analysis. We also thank the partners which provided
quantitative background information about the wastewater system and its population covered. We thank
our Sciensano colleagues of the laboratory DOs for the coordination of the laboratory and logistics
aspects. We thank all partners and other colleagues for critical reading of and their contributions to this
report. We thank the authorities for their support and funding of this project.

 12
You can also read