Q3 2014 Investor Presentation - as of September 30, 2014 - Investor Relations
←
→
Page content transcription
If your browser does not render page correctly, please read the page content below
Q3 2014
       Investor Presentation

as of September 30, 2014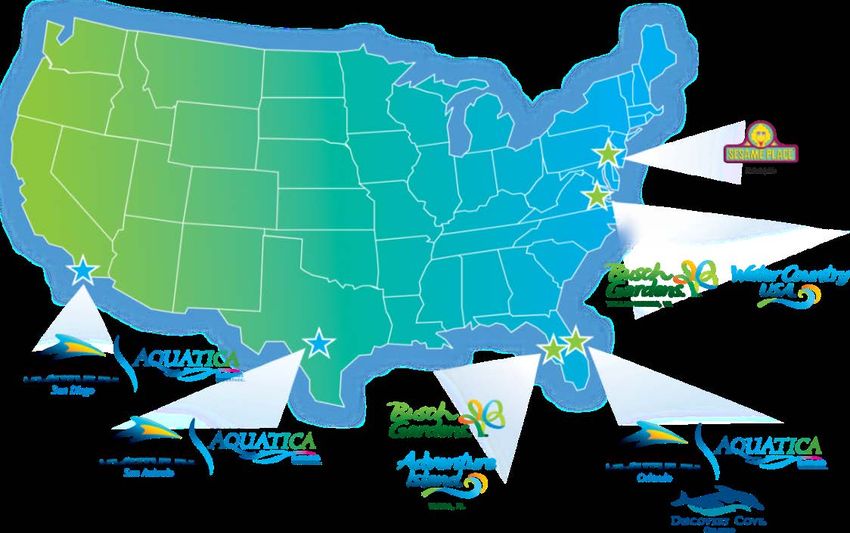
Cautionary Statements
Statement Regarding Forward-Looking Statements
This presentation contains “forward-looking statements” within the meaning of U.S. federal securities laws. All statements contained in this presentation other than statements
of historical facts are forward-looking statements. Words such as “might,” “will,” “may,” “should,” “estimates,” “expects,” “continues,” “contemplates,” “anticipates,” “projects,”
“plans,” “potential,” “predicts,” “intends,” “believes,” “forecasts,” “future” and variations of such words or similar expressions are intended to identify forward-looking statements.
Forward-looking statements are not historical facts, and are based upon management’s current expectations, beliefs, estimates and projections, and various assumptions,
many of which are inherently uncertain and beyond our control. Such expectations, beliefs, estimates and projections are expressed in good faith and management believes
there is a reasonable basis for them. However, there can be no assurance that management’s expectations, beliefs, estimates and projections will be achieved and actual
results may differ materially from what is expressed in or indicated by the forward-looking statements. Forward-looking statements are subject to risks and uncertainties that
could cause actual performance or results to differ materially from those expressed in the forward-looking statements, including risks detailed in SeaWorld Entertainment,
Inc.’s (“SeaWorld” or the “Company”). Annual Report on Form 10-K for the year ended December 31, 2013 as filed with the U.S. Securities and Exchange Commission (the
“SEC”), as such risk factors may be updated from time to time in our periodic filings with the SEC. Forward-looking statements speak only as of the date the statements are
made. The Company assumes no obligation to update forward-looking statements to reflect actual results, subsequent events or circumstances or other changes affecting
forward-looking information except to the extent required by applicable securities laws.
Statement Regarding Non-GAAP Financial Measures
This presentation includes several metrics which are not calculated in accordance with the generally accepted accounting principles in the United States (“GAAP”), including
Adjusted EBITDA, Free Cash Flow and Adjusted Free Cash Flow. These metrics have important limitations and should not be considered in isolation or as a substitute for
measures of the Company’s financial performance or liquidity prepared in accordance with GAAP. In addition, these metrics, as presented by the Company, may not be
comparable to similarly titled measures of other companies due to varying methods of calculations.
Adjusted EBITDA is defined as net income (loss) before interest expense, income tax expense (benefit), depreciation and amortization, as further adjusted to exclude certain
unusual, non-cash and other items permitted in calculating covenant compliance under the indenture governing the Company’s existing senior notes and the credit agreement
governing the Company’s senior secured credit facilities. The Company believes that the presentation of Adjusted EBITDA is appropriate to provide additional information to
investors about the calculation of, and compliance with, certain financial covenants in the indenture and the credit agreement. Adjusted EBITDA is a material component of
these covenants. The Company also uses Adjusted EBITDA in connection with certain components of its executive compensation program. In addition, investors, lenders,
financial analysts and rating agencies have historically used EBITDA-related measures in the Company’s theme park and entertainment industry, along with other measures to
evaluate the Company’s ability to meet its debt service requirement, to estimate the value of a company and to make informed investment decisions. Free Cash Flow is
defined as net cash provided by operating activities less capital expenditures. Adjusted Free Cash Flow is defined as Free Cash Flow reduced by the one-time cash payment
of the 2009 Advisory Agreement termination fee. For a reconciliation of Adjusted EBITDA to net income and Free Cash Flow and Adjusted Free Cash Flow to cash flow from
operating activities, please refer to the Appendix in this presentation or our Quarterly Earnings Release, which can be found at our website www.seaworldentertainment.com.
Statement Regarding Use of Registered Trademarks
The Company owns or has rights to use a number of registered and common law trademarks, service marks and trade names in connection with its business in the United
States and in certain foreign jurisdictions, including SeaWorld Entertainment, Inc.SM, SeaWorld Parks & Entertainment®, SeaWorld®, Shamu®, Busch Gardens®, Aquatica
SeaWorld’s Waterpark®, Discovery Cove®, Sea Rescue™, and other names and marks that identify our theme parks, characters, rides, attractions and other businesses. In
addition, the Company has certain rights to use Sesame Street® marks, characters and related indicia through certain license agreements with Sesame Workshop (f/k/a
Children’s Television Workshop).
Solely for convenience, trademarks, service marks and trade names referred to in this presentation may be without the ® and ™ symbols, but such references are not
intended to indicate, in any way, that the Company will not assert, to the fullest extent under applicable law, its rights or the rights of the applicable licensors to these
trademarks, service marks, and trade names.

                                                                                                                                                                                          2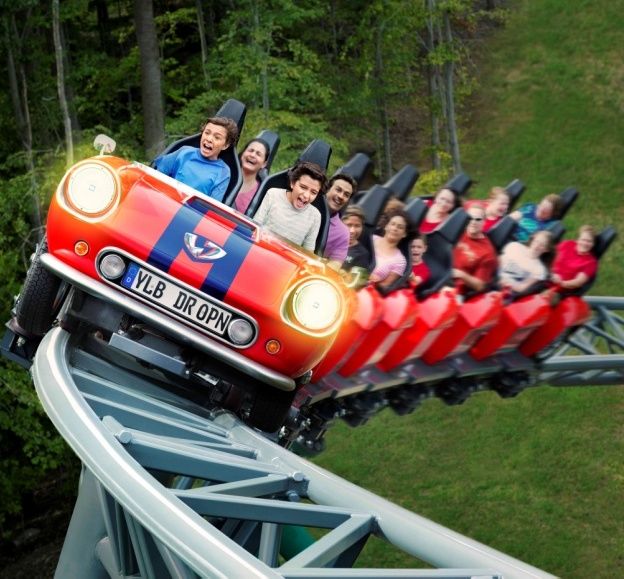
Company Overview &
Investment Highlights

                        3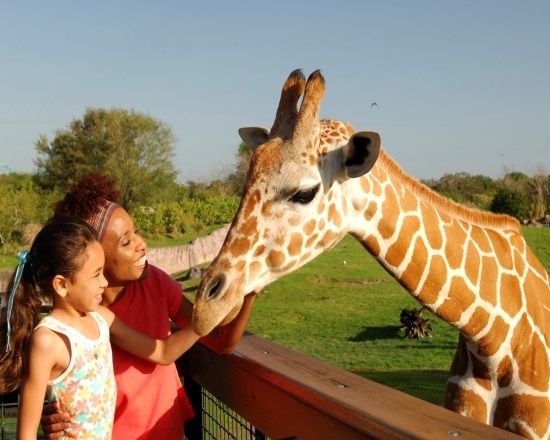
A Leading Theme Park and Entertainment
     Company

         We inspire people, through the power of entertainment,
    to celebrate, connect with and care for the natural world we share.

4                                                                     4
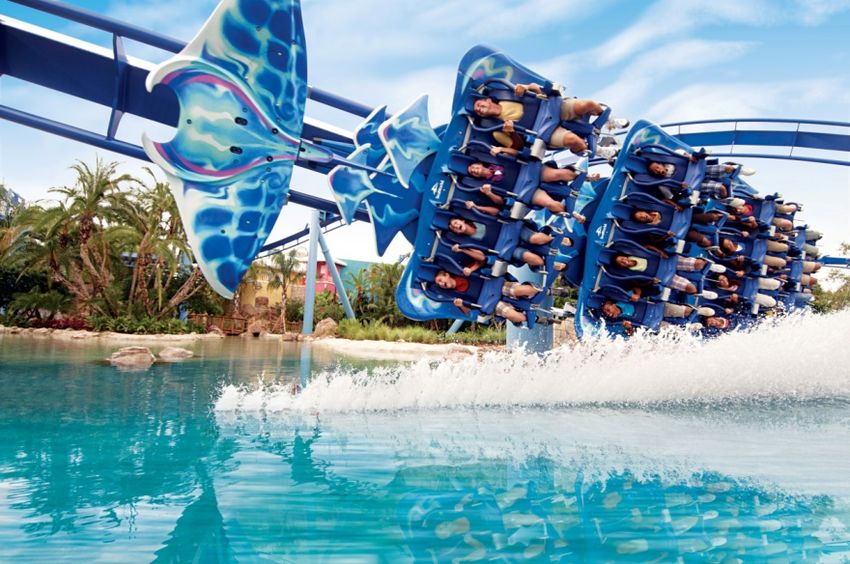
SeaWorld Entertainment, Inc.
At a Glance…
                     Operations

• 11 parks in 5 states
• 4 of top 20 theme parks by attendance in
  North America1
• Over 50 year operating history
• Approximately 86,000 animals2
• Over 600 rides and attractions2
• Approximately 2,000 acres of owned land,
  with nearly 400 acres available for future
  development3

              2014 LTM4 Results                                                                               SeaWorld’s Differentiation

• 22.5 million in Attendance                                                               • Large scale parks
• $1.4 billion of Revenue                                                                  • Located in key markets: warm weather, sizable
• $367 million of Adjusted EBITDA                                                            local populations, tourist destinations

• $120 million of Free Cash Flow                                                           • Park clusters in 5 of 6 markets
                                                                                           • Distinct animal collection
          1
                                                                                           • Strong brands and intellectual property
            Source: Theme Index: The Global Attractions Attendance Report TEA / AECOM, 2014.
          2 As of December 31, 2013.
          3 Developable land defined as unimproved acreage outside park perimeter, including unpaved guest parking lots.
          4 2014 LTM results represent latest twelve months through September 30, 2014.
                                                                                                                                             5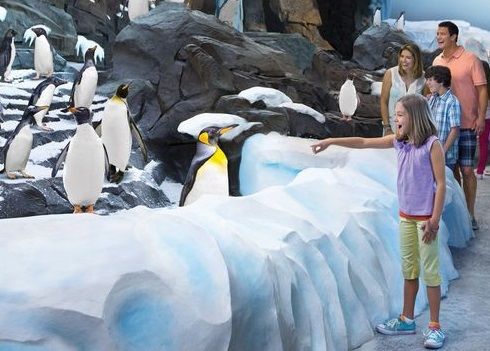
Investment Highlights
      Globally Recognized Parks, Brands and Intellectual Property

        Well-Capitalized Parks Positioned for Sustained Growth

                      Diversified Revenue Base

               Ongoing Margin Expansion Opportunities

                  Strong Free Cash Flow Generation

                   Continued Growth Opportunities

       Experienced and Execution–Focused Management Team

                                                                    6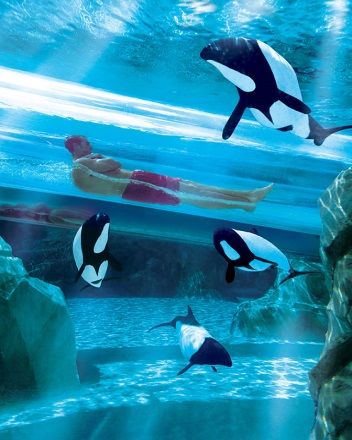
Globally Recognized Parks, Brands and
Intellectual Property
                                  Strong Brands and Intellectual Property Drive Value

• Differentiated brands and intellectual property (IP)
  – Drives attendance
  – Enhances guest experience
  – Creates monetizable value in and out of parks

• Demonstrated ability to create new IP

• Opportunity to leverage owned brands and IP across
  multiple platforms

• Brands that transcend cultures

• Library of IP includes over1:
  – 200 brands & marks
  – 700 active U.S. trademarks
  – 400 foreign trademarks registrations in over 60
    countries

          1
                                                                                        7
              As of December 31, 2013.
Among the World’s Largest Zoological
Collections
    Inspiring Guests to Care for the Natural World through Up-Close Animal Experiences

• One-of-a-kind collection of approximately 86,000 marine and
  terrestrial animals1

• More than 80% of our marine mammals were born in human care1

• Successful and innovative breeding programs that have produced 31
  killer whales, 159 dolphins and 135 sea lions, among other species1

• Our marine animal populations are characterized by their substantial
  genetic diversity

• One of the world’s largest penguin collections

          1
                                                                                         8
              As of December 31, 2013.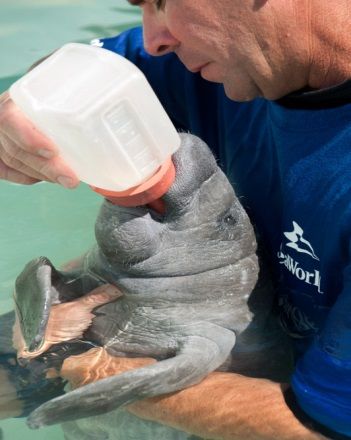
Care for Our Community and the
Natural World
  A Global Leader in Animal Husbandry, Veterinary Care, Enrichment and Animal Behavior

• More than 1,500 employees dedicated to the welfare, enrichment,
  husbandry and veterinary care of our animals1

• Our animal experts have helped animals in need – ill, injured, orphaned
  or abandoned – for more than four decades

• Thus far in 2014 we have assisted over 1,200 animals, bringing our
  total rescues to date to more than 24,000 animals2

• We contribute to wildlife research, habitat protection, animal rescue
  and conservation education through the SeaWorld & Busch Gardens
  Conservation Fund and other environmental organizations

          1
          2
              As of December 31, 2013.                                                   9
              As of November 3, 2014.
Investment Highlights
      Globally Recognized Parks, Brands and Intellectual Property

        Well-Capitalized Parks Positioned for Sustained Growth

                      Diversified Revenue Base

               Ongoing Margin Expansion Opportunities

                  Strong Free Cash Flow Generation

                   Continued Growth Opportunities

       Experienced and Execution–Focused Management Team

                                                                    10
Well-Capitalized Parks Positioned for
Sustained Growth
Well-Maintained and Industry Recognized Theme Parks and Attractions
• In 2014, TripAdvisor ranked 9 of our 11 theme parks among the best 25 attractions in North
America, including Discovery Cove, which was voted the Number 1 amusement park in the world
for the second consecutive year1
• Busch Gardens Williamsburg named the most beautiful theme park in the world for 23
consecutive years2
• Winner of the top three spots in Amusement Today’s Golden Ticket Award for Best Marine Life
Park since 20063
• Busch Gardens Williamsburg has been recognized with the Golden Ticket Award for Best
Landscaping each year since the award’s inception in 19983
Discovery Cove Busch Gardens
SeaWorld Orlando
Williamsburg
1 TripAdvisor Traveler’s Choice Awards, 2014.
2
3
National Amusement Park Historical Association, 2013. 11
Amusement Today Inc. Golden Ticket Awards, 2014.New Attractions Opened in 9 of Our 11
Parks in 2014
50th Anniversary Celebration Colossal Curl Cookie’s Monster Land
All 3 SeaWorld Parks Water Country USA Sesame Place
Explorer’s Reef Falcon’s Fury & Pantopia Ihu’s Breakaway Falls
SeaWorld San Diego Busch Gardens Tampa Aquatica Orlando
London Rocks show Roa’s Aviary Taumata Racer
Busch Gardens Williamsburg Aquatica San Antonio Aquatica San Diego
12Blue World Project
• New, first-of-its-kind killer whale environments will open at all three
SeaWorld parks
– The first realm will open at SeaWorld San Diego in 2018
– Nearly doubles the volume of water in existing facilities, with a
maximum depth of 50 feet and surface area of nearly 1.5 acres
– Transforms how our guests experience killer whales through up-
close and personal encounters
– Investment of approximately $100 million per park
• Also announced $10 million in matching funds for research focused
on identifying threats to killer whales in the wild and a multi-million
dollar partnership on ocean health
• Visit http://blueworldproject.seaworld.com to learn more
13Investment Highlights
Globally Recognized Parks, Brands and Intellectual Property
Well-Capitalized Parks Positioned for Sustained Growth
Diversified Revenue Base
Ongoing Margin Expansion Opportunities
Strong Free Cash Flow Generation
Continued Growth Opportunities
Experienced and Execution–Focused Management Team
14Diversified Revenue Base1
2013 Revenue by State 2013 Revenue by Line of Business
Other
VA All
FL Other
CA
Admissions
• Our parks are near large metro areas, with • Our parks operate more than 100 culinary
over 60 million people located within 150 miles outlets and over 200 specialty retail shops
2013 Attendance by Guest Origin 2013 Attendance by Family Demographic
International
Adult
Only Family
Domestic
• Our diversified guest base is comprised of • Our parks have broad demographic appeal,
local visitors, non-local domestic visitors and with an average party size of 3.8 people
international tourists
1
15
As of December 31, 2013.Investment Highlights
Globally Recognized Parks, Brands and Intellectual Property
Well-Capitalized Parks Positioned for Sustained Growth
Diversified Revenue Base
Ongoing Margin Expansion Opportunities
Strong Free Cash Flow Generation
Continued Growth Opportunities
Experienced and Execution–Focused Management Team
16Ongoing Margin Expansion Opportunities
($ in millions)
Adj. EBITDA and Contribution Margin Opportunities
• High flow-through margin revenue
• Fixed cost as revenue grows, semi-
variable as volume decreases
• Park clustering to leverage efficiencies
• Continued cost and labor management
$439
$415 – Review of existing cost structure, with
$382 $367 the intent to drive $50 million in cost
$343 savings by the end of 2015
• Management of operating calendars and
operating hours
2010 2011 2012 2013 2014
LTM1 • Addition of higher margin businesses
Adj. EBITDA Margin • Strategic sourcing / cooperative buying
28.3%2 28.7% 29.2% 30.1% 26.5%
1 2014 LTM results represent latest twelve months through September 30, 2014.
2 Revenue
17
includes add-back of $17M for deferred revenue write-downs in 2010.Aligning Costs for Future Growth
($ in millions)
Execute a $50 million Cost Savings Plan by the End of 2015
Estimated EBITDA Expense Savings by Category
• $50 million of annual cost savings realized by
Organization redesign $15 the end of 2015
Park Operations $30
• $10 million of cost savings recognized in 2014
Other reductions $5 on a pro forma basis (included in guidance)
Total $50
• Expect a charge of approximately $13 million
Estimated EBITDA Expense Impact by Year in the fourth quarter of 2014 (excluded from
Adjusted EBITDA)
2014 – Pro Forma ($10)
2015 - Remainder ($40)
• Benefit of cost reductions offset by add-backs
in 2015, normal inflationary cost increases, and
2015 – Total ($50) an anticipated increase in marketing
2015 versus 2014 Impact ($40)
• Net 2015 Adjusted EBITDA expenses expected
2015 Add-backs $35 – $40
to be flat to down slightly versus 2014
Net 2015 vs. 2014 Expenses ($5 to Flat)
18Investment Highlights
Globally Recognized Parks, Brands and Intellectual Property
Well-Capitalized Parks Positioned for Sustained Growth
Diversified Revenue Base
Ongoing Margin Expansion Opportunities
Strong Free Cash Flow Generation
Continued Growth Opportunities
Experienced and Execution–Focused Management Team
19Strong Free Cash Flow Generation
($ in millions)
Strong Free Cash Flow Generation with Substantial Visible Growth in the Future
$367 $75
Working
Cash Interest Capital and
Expense Cash Taxes Other2 $283 $163
LTM Capital
Adjusted Expenditures
Adjusted
EBITDA1
Cash Flow
from $120
Operations 2014 LTM
Free Cash
Flow1
Revenue Deleveraging ~$660M Minimal Cash flow Disciplined
growth and over time and in Federal working available for and flexible
margin refinancing NOLs capital discretionary capital
expansion opportunities needs investment spending
1
2
2014 LTM results represent latest twelve months through September 30, 2014. 20
Excludes other non-cash items.Investment Highlights
Globally Recognized Parks, Brands and Intellectual Property
Well-Capitalized Parks Positioned for Sustained Growth
Diversified Revenue Base
Ongoing Margin Expansion Opportunities
Strong Free Cash Flow Generation
Continued Growth Opportunities
Experienced and Execution–Focused Management Team
21Continued Growth Opportunities
Increasing Admissions Revenue and In-Park Spending1
• Expand application of variable pricing to additional markets
• Optimize pricing and benefits for tiered pass products
• Promote in-park product offerings and special events
– Quick Queue, PhotoKey and All-Day Dining Deal
– Cashless Wristband Program
• Refresh restaurant concepts to market style, away from
traditional cafeteria style service
Expedition Café (market style)
• Create premium in-park experiences utilizing mobile technology SeaWorld Orlando
to drive higher in-park spending
Multi-year Focus on Digital Innovation
• “Discovery Guide” mobile apps put the parks into guests’ pockets
– In-app purchasing, mobile ticketing, and ability to redeem
special offers
– At certain dining locations, guests can use a mobile device to
pre-order meals or to order their meals for table delivery
1
22
In-Park Spending represents total food, merchandise and other revenue.Expansion Opportunities
Opportunities
• Ability to replicate proven park formats and attractions
Self-Funded New
Parks • Significant owned and available land for development
(2000: Discovery Cove)
• Variety of park formats and sizes expands opportunity set
Opportunistic • Opportunistic acquisition and expansion opportunities,
Acquisitions particularly for smaller park formats
(2012: Aquatica San Diego) • Ability to rebrand acquired parks with Company brands
• Extend Company-branded entertainment outside of parks
New Businesses • Possible opportunities may include lodging, cruise and
entertainment districts
• Capital-light joint ventures leverage Company’s brands and
expertise while generating royalties and management fees
International – Memorandum of Understanding to build a multi-park
Expansion development in the Middle East; first phase expected to
open in 2020
– Letter of Intent with Village Roadshow Theme Parks to
co-develop parks in Pan-Asia, India and Russia 23Brand Extensions Provide Additional
Awareness
Theme Parks Provide a Platform to Create and Showcase Intellectual Property
• Builds awareness of the Company’s brands
and parks
Media, Film, • Live-action and animated television
TV & Music programs based on owned IP & content
• New properties in development and
production
• Enhances and extends in-park experiences
• New collection of mobile games designed to
Digital, Mobile &
engage the imaginations of children
Apps
• Empowers and engages users to help wildlife
and nature
• Product can be sold in and out of parks
Consumer • Allows guests to take park experience home
Products & • Can include toys, apparel, games, movies,
Licensing and back-to-school items, among others
• High-margin licensing opportunities
24More than 244 Million Viewers have Watched these Two Television Series1
• Sea Rescue™ focuses on the rescue, rehab, and return of sea
life back into their natural habitat
– Nominated for a 2014 Daytime Emmy® Award for
“Outstanding Children's Series”
– Premiered in April 2012 and began its fourth season on
October 4; also renewed for its fifth season
– Top-rated Saturday morning show in most major U.S. markets
– Total viewership of nearly 175 million
• The Wildlife Docs™ gives a behind the scenes look at Busch
Gardens Tampa’s elite zoological team as they care for more
than 12,000 animals
– Much of the show takes place in the park's Animal Care
Center, an innovative medical center that brings park guests
into the animal care experience
– Premiered in October 2013 and began its second season on
October 4; also renewed for its third season
– Almost 70 million viewers have tuned in since its debut
1 Viewership
25
data from April 7, 2012 through September 28, 2014.Investment Highlights
Globally Recognized Parks, Brands and Intellectual Property
Well-Capitalized Parks Positioned for Sustained Growth
Diversified Revenue Base
Ongoing Margin Expansion Opportunities
Strong Free Cash Flow Generation
Continued Growth Opportunities
Experienced and Execution-Focused Management Team
26Experienced and Execution-Focused
Management Team
Years with Years in
Name Title
SEAS Industry
Chief Executive Officer, President &
Jim Atchison 27 27
Director
Jim Heaney Chief Financial Officer 2 24
Chief Operating Officer, SeaWorld &
Dan Brown 39 39
Discovery Cove
Chief Operating Officer, Busch Gardens &
Donnie Mills 40 40
Sesame Place
Scott Helmstedter Chief Creative Officer 3 28
Dave Hammer Chief Human Resources Officer 34 34
Brad Andrews Chief Zoological Officer 42 42
Chief Legal & Corporate Affairs Officer,
Tony Taylor 14 14
General Counsel & Corporate Secretary
Marc Swanson Chief Accounting Officer 14 14
27Financial Summary
28Financial Performance1
(In millions except per capita data)
2010 – 2013
2010 2011 2012 2013 2014 LTM2
CAGR
Attendance 22.4 23.6 24.4 23.4 1.5% 22.5
Total Revenue per Capita3 $53.32 $56.31 $58.37 $62.43 5.4% $61.57
Revenue $1,196 $1,331 $1,424 $1,460 6.9% $1,385
Adjusted EBITDA $343 $382 $415 $439 8.6% $367
Capital Expenditures $120 $225 $192 $166 11.4% $163
Adjusted Free Cash Flow $82 $39 $108 $1674 26.7% $120
1 Certain prior year amounts included in this presentation have been revised. Refer to the Company’s Quarterly Report on Form 10Q to be filed on November 13, 2014 for
additional information.
2 2014 LTM results represent latest twelve months through September 30, 2014.
3 Calculated as total revenue divided by attendance.
4 Excludes a one-time fee of $46.3 million paid to an affiliate of Blackstone in connection with the termination of the 2009 Advisory Agreement in Q2 2013.
29Disciplined Capital Spending
(In $ millions)
Pursue Disciplined Investment and Expansion Opportunities
• Expected full-year 2014 capital expenditures to be in the range of $155 to $165 million and
2015 capital expenditures to be in the range of $185 to $195 million
• Capital re-investment program that will bring new attractions to destination parks in the
coming years
• Blue World Project brings new, first-of-its-kind killer whale environments to all three SeaWorld
parks, the first to open at SeaWorld San Diego in 2018
Capital Spending
$225 $185 to
$192 $155 to
$166 $195
$120 $165
2010 2011 2012 2013 2014 2015
Guidance Guidance
1
30
2014 and 2015 capital spending guidance as of November 12, 2014.Efficient Capital Structure
(In $ millions)
Key Highlights
• March 2014 swap: increased interest rate swap position on term loan to $1B
– Effectively converts over 70% of variable rate debt to fixed rate through September 2016
• Voluntary prepayment of $31.5 million on Term B2 Loan during the third quarter of 2014
• Ability to call Senior Notes in December 2014 at a reduced premium
Coupon
Tranche (as of 9/30/2014) Amount Maturity x EBITDA
(bps)
Total cash & equivalents $115
$192.5M revolver -- L+225 4/24/2018
Term B2 Loan $1,356 L+225 / 0.75% 5/14/2020
Total secured debt $1,356
Senior Notes $260 11.00% 12/1/2016
Total debt1 $1,616
Net debt1 $1,501 4.09x2
1
2
Excludes unamortized debt discount. 31
Represents September 30, 2014 net debt divided by 2014 LTM Adjusted EBITDA.Returning Value to Shareholders
(In millions except per share amounts)
Over $200 Million in Net Value Returned to Shareholders since April 2013
Q2 2013 Q3 2013 Q4 2013 Q1 2014 Q2 2014 Q3 2014 Total
Dividends per share $0.20 $0.20 $0.20 $0.20 $0.21 $0.21 4.6% Yield1
Declared $ value $18 $18 $18 $18 $18 $18 $108
Share total shares -- -- 1.5 -- 1.75 -- 3.25
Buybacks net $ value -- -- $43 -- $51 -- $94
Total Value
Capital Allocation Priorities $202
1. Grow the Company through opportunistic acquisitions and brand extensions
What we did: Acquired eleventh theme park in 2012; expansion into media, digital and licensing
2. Provide a stable dividend which grows over time
What we did: Increased the dividend 5% in 2014
3. Opportunistically buy back our own stock
What we did: Bought 1.75 million shares in April 2014 and 1.5 million shares in December 2013
and the Board of Directors authorized a share repurchase program of up to $250 million,
effective January 1, 2015
4. Pay down long-term liabilities
What we did: Paid $42 million toward our Term B2 Loan thus far in 2014
1
32
Calculated as current annualized dividend payout divided by stock price per share at close of business on November 10, 2014.Investment Summary
Globally Recognized Parks, Brands and Intellectual Property
Well-Capitalized Parks Positioned for Sustained Growth
Diversified Revenue Base
Ongoing Margin Expansion Opportunities
Strong Free Cash Flow Generation
Continued Growth Opportunities
Experienced and Execution-Focused Management Team
33Appendix
34Reconciliation of Adjusted EBITDA to Net
(Loss) Income1
(In $ millions)
2010 2011 2012 2013 2014 LTM2
Net (loss) income ($45) $15 $74 $52 $62
(Benefit from) provision for income taxes (29) 11 37 26 40
Loss on early extinguishment of debt -- 15 2 30 --
Interest expense 134 98 111 90 81
Depreciation & amortization 207 214 167 166 171
Secondary offering costs -- -- -- 1 2
Termination of advisory agreement -- -- -- 50 --
Advisory fees 5 6 6 3 --
Equity based compensation expense -- 1 2 6 3
Debt refinancing costs -- 4 5 4 --
Other adjusting items -- -- 1 1 4
Other non-cash expenses 9 12 10 10 3
Carve-out costs 45 6 -- -- --
Deferred revenue write-down 17 -- -- -- --
Adjusted EBITDA3 $343 $382 $415 $439 $367
1 Certain prior year amounts included in this presentation have been revised. Refer to the Company’s Quarterly Report on Form 10Q to be filed on November 13, 2014 for
additional information.
2 2014 LTM results represent latest twelve months through September 30, 2014.
3 Column may not foot due to rounding.
35Reconciliation of Adjusted Free Cash Flow
to Cash Flow from Operating Activities1
(In $ millions)
2010 2011 2012 2013 2014 LTM2
Net cash provided by operating activities $202 $264 $299 $286 $283
Capital expenditures 120 225 192 166 163
Free Cash Flow 82 39 108 120 120
Advisory termination fee cash payment -- -- -- 46 --
Adjusted Free Cash Flow3 $82 $39 $108 $167 $120
1 Certain prior year amounts included in this presentation have been revised. Refer to the Company’s Quarterly Report on Form 10Q to be filed on November 13, 2014 for
additional information.
2 2014 LTM results represent latest twelve months through September 30, 2014.
3 Column may not foot due to rounding.
36Q3 2014
Investor Presentation
as of September 30, 2014You can also read