THAILAND AMIDST COVID-19: CHALLENGES & OPPORTUNITIES - KIRIDA BHAOPICHITR 9 OCT 2020 - Joint Foreign Chambers of ...

Page created by Kenneth Sherman
 
CONTINUE READING
THAILAND AMIDST COVID-19: CHALLENGES & OPPORTUNITIES - KIRIDA BHAOPICHITR 9 OCT 2020 - Joint Foreign Chambers of ...
THAILAND AMIDST COVID-19:
CHALLENGES & OPPORTUNITIES

             KIRIDA
           BHAOPICHITR
            9 OCT 2020
THAILAND AMIDST COVID-19: CHALLENGES & OPPORTUNITIES - KIRIDA BHAOPICHITR 9 OCT 2020 - Joint Foreign Chambers of ...
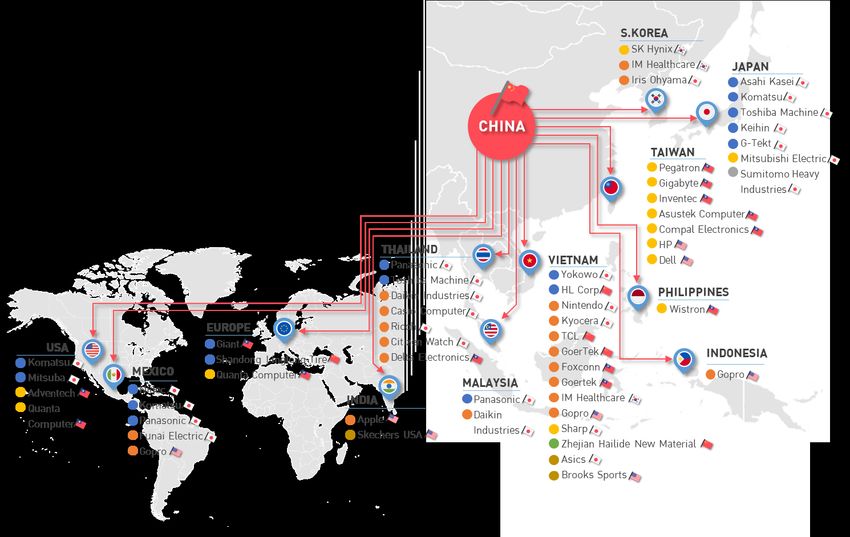
proven vaccine will be available
                             only at least a year from now
• Earliest planned completion date for COVID-19 is September 2021.

                                          Vaccines currently undergoing clinical trials

    Source: Vaccine Centre, London School of Hygiene & Tropical Medicine and New York Times   2
THAILAND AMIDST COVID-19: CHALLENGES & OPPORTUNITIES - KIRIDA BHAOPICHITR 9 OCT 2020 - Joint Foreign Chambers of ...
Global economy will not recover
                                                           until after 2021
   • According to IMF, global GDP growth is projected to contract by 4.9% in 2020. In the baseline, global activity
     is expected to bottom out in the second quarter of 2020, recovering thereafter and reaching pre-COVID levels
     by the end of 2021.
   • Advanced economies, including US, Euro, and Japan, will contract by more than developing economies and
     will recover to pre-COVID levels only after 2021; China is the only large economy that will expand, albeit
     modestly, this year.
   • However, recovery will be delayed should the pandemic not end by next year or countries lockdown when
     faced with future waves of outbreaks.
                                                                            GDP Growth Forecasts by IMF
                                                                                                                                                                RUSSIA
       WORLD                                                                                                                                                    Growth in 2020          2021
          Growth in 2020       2021
                                                                                                      EURO AREA
                                                                                                                                                        2019
                                                                                                                                                       1.3%     -6.6 4.1      %            %
 2.9 -4.9 5.4
   2019
                                                                                                                                                                        (-5.5%)         (3.5%)
      %                %          %                                                                           Growth in 2020       2021
                 (-3.0%)       (5.8%)                                                               2019
                                                                                                    1.3%    -10.2 6.0       %          %
                                                                                                                                                        CHINA
            ADVANCED ECONOMIES                      USA                                                               (-7.5%)     (4.7%)
                                                                                                                                                       Growth in 2020            2021                  JAPAN
     2019
    1.7%
              Growth in 2020

              -8.0% 4.8%
                     (-6.1%)
                                2021

                                (4.5%)
                                         2019
                                         2.3%
                                                Growth in 2020

                                                -8.0 4.5    %
                                                                        2021

                                                                           %                          MIDDLE EAST
                                                                                                                                                2019
                                                                                                                                               6.1%       1.0 8.2    %
                                                                                                                                                                 (1.2%)
                                                                                                                                                                                   %
                                                                                                                                                                              (7.2%)
                                                                                                                                                                                               2019
                                                                                                                                                                                            0.7%
                                                                                                                                                                                                      Growth in 2020

                                                                                                                                                                                                      -5.8 2.4      %
                                                                                                                                                                                                                              2021

                                                                                                                                                                                                                                 %
                                                       (-5.9%)          (4.7%)                        AND CENTRAL ASIA                                                                                          (-5.2%)       (3.0%)
                                                                                                           Growth in 2020       2021
                                                                                                                                                                                         ASEAN-5
                                                                 LATIN AMERICA 1.0% -4.7   % 3.3%                                               INDIA
          EMERGING MARKET AND                                                                       2019
          DEVELOPING ECONOMIES                                                                                                                                                         (Indonesia, Malaysia,
              Growth in 2020    2021                                                  (-2.8%)  (4.0%)                                         Growth in 2020          2021        Philippines, Thailand, Vietnam)
     2019
    3.7%      -3.0% 5.9%                                         AND THE CARIBBEAN                                                     2019
                                                                                                                                       4.2%   -4.5 6.0                                     Growth in 2020             2021
                     (-1.0%)    (6.8%)
                                                                 2019
                                                                 0.1%
                                                                         Growth in 2020

                                                                          -9.4 3.7   %
                                                                                           2021

                                                                                              %
                                                                                                                                                           %
                                                                                                                                                       (1.9%)
                                                                                                                                                                          %
                                                                                                                                                                     (7.4%)
                                                                                                                                                                                    2019
                                                                                                                                                                                   4.9%    -2.0 6.2       %
                                                                                                                                                                                                      (-0.6%)
                                                                                                                                                                                                                          %
                                                                                                                                                                                                                     (7.8%)
                                                                                 (-5.2%)   (3.4%)
Note:      shows increase/decrease compared to previous year; Number in bracket is forecast in April 2020; Size of circle is the size of economy
Source: World Economic Outlook (June 2020), International Monetary Fund and TDRI calculation                                                     3
THAILAND AMIDST COVID-19: CHALLENGES & OPPORTUNITIES - KIRIDA BHAOPICHITR 9 OCT 2020 - Joint Foreign Chambers of ...
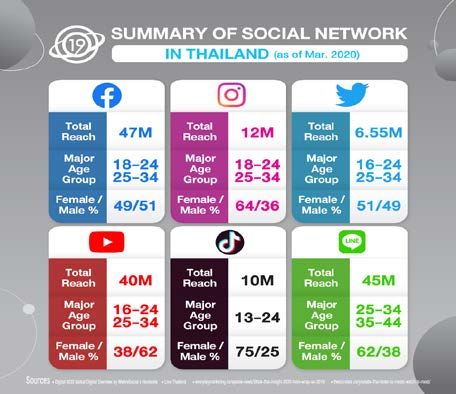
US-China trade war could step up
                  this year as phase 1 deal breaks down
• China is unlikely to meet the target             China’s purchases of US goods under US-China Phase 1 Deal
                                                                         (as of May 2020)
  with phase one deal.                       180                                                                                   Purchase commitment
                                                                                                                                   (Chinese imports)
  • In first 4 months of 2020, China         160                                                                                   $172.7 billion
                                             140                                                                                   Purchase commitment
     imported only 45% of what it would                                                                                            (US exports)
                                             120                                                                                   $142.7 billion
     have to buy to be on pace to meet       100
     the deal.                                80

  • In particular, China’s imports of oil     60
                                              40
     from US is falling far behind target,                                             $32.7 billion actual purchases, based on Chinese imports
                                                                                       $26.9 billion actual purchases, based on US exports
                                              20
     while it imports from Saudi Arabia
                                               0
     and Russia.                                    0        Jan Feb Mar Apr May Jun Jul Aug Sep Oct Nov Dec
                                                   Source: Peterson Institute for International Economics
  • Trade war will continue post US
                                                                                       US view of China
     elections as more Americans have         80
                                                                                                                             66
                                              70                                                                       60
     been viewing China more                  60              52            50 49 51         52 55 54 55
                                                                                                                                  Unfavorable
                                                                                                             47 47
     unfavorably since the trade war and      50        43         42 42                40
                                              40
     COVID-19 pandemic began.                 30                   39 39 38 36 36 40 37
                                                                                                             44
                                                        35                              35 38 37                  38
                                                                                                                                  Favorable
                                              20              29                                                       26 26
                                              10
                                                                                                                                    Source: PEW
                                               0                                                                                    Research Center
                                                     2005            2008        2011          2014        2017             2020                      4
THAILAND AMIDST COVID-19: CHALLENGES & OPPORTUNITIES - KIRIDA BHAOPICHITR 9 OCT 2020 - Joint Foreign Chambers of ...
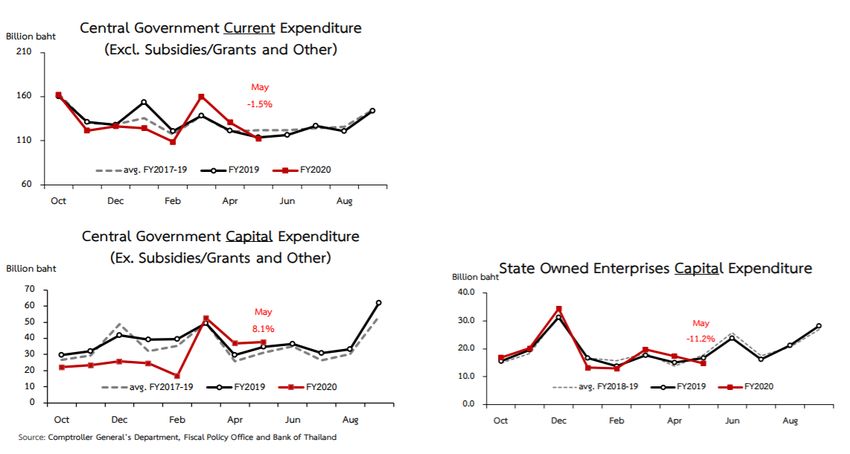
oil prices recovered from its trough
                      but will remain low until next year
                                                                                                     Global crude oil spot prices
• In June, Brent spot price was US$40.3/barrel                                                            Crude oil, WTI          Crude oil, Brent
  (-37.3% yoy), up from US$18.4/barrel in April,                                  90
                                                                                                                                              EIA Forecast
  as numerous regions worldwide began to lift                                     75
                                                                                                                                             (as of July 2020)

                                                         US dollar per barrel
  lockdowns, while global oil supply fell as
                                                                                  60
  a result of production cuts by OPEC+
                                                                                  45
• EIA expects monthly Brent spot prices to
  average US$41.5/b (-34%yoy) in 2H2020 and                                       30

  rise to an average of US$44/b in 2021 with                                      15                                                   Jun
  supply reductions and rising demand                                                   2017       2018           2019          2020            2021              2022

                                                                                                  Oil production and consumption
   • EIA forecasts is based on US gross domestic                                               Oil Production            Oil Consumption           Oil balance
     product declining by 6.4%yoy in 1H2020 before                                105
                                                                                  100
     rising in Q3/2020 through 2021.                     Million barrel per day    95
                                                                                   90
   • OPEC+ agrees to extend oil production cuts                                    85
                                                                                                                                               EIA Forecast
     through July 2020.                                                            80                                                         (as of July 2020)
                                                                                   75
   • US oil rig count falls to lowest level since 2009                             20
                                                                                   10
                                                                                    0
                                                                                  -10                                                  Jun
                                                                                        2017       2018           2019          2020            2021              2022
                                                                                    Source: EIA
                                                                                    Note: Oil balance = Production – Consumption                                     5
THAILAND AMIDST COVID-19: CHALLENGES & OPPORTUNITIES - KIRIDA BHAOPICHITR 9 OCT 2020 - Joint Foreign Chambers of ...
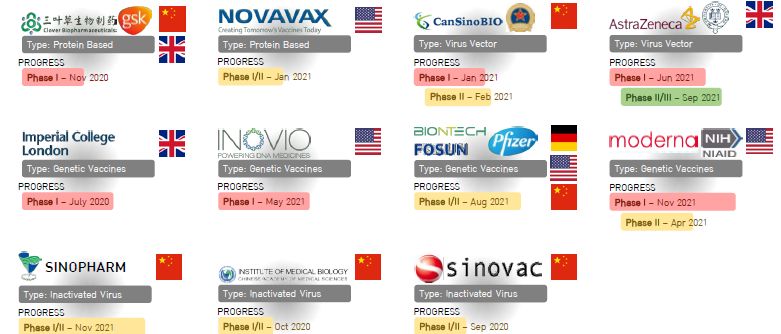
Baht/US$ is forecasted to be
                                                     around 31-31.50 for the rest of the year
      • Baht weakened from Bt31.3/USD in                                                                                                          Index of Local Currencies to US dollar (compared to Dec 2019)
        Q1/2020 to Bt31.9/USD in Q2/2020, the
        weakest in ASEAN-5 after Indonesia                                                                                                   94
                                                                                                                                                    (-1.1%) (-1.1%) (0.6%) (0.6%) (3.6%) (3.8%) (3.8%) (5.6%) (6.5%) (6.6%)
        rupiah.                                                                                                                              96

                                                                                                                Index (Q4-2019 = 100)

                                                                                                                                                                                                                                                   Strong
                                                                                                                                             98
      • For the remaining months of the year, the                                                                                       100
                                                                                                                                        100
        baht is forecasted slightly appreciate to                                                                                       102
        31-31.50 to the US dollar as trade balance

                                                                                                                                                                                                                                                   Weak
                                                                                                                                        104
        improves with recovery in exports and US                                                                                        106                 Actual          Consensus forecast
                                                                                                                                                       Q1-20      Q2-20       Q3-20     Q4-20
        dollar weakens from H1.                                                                                                         108
                                                                                                                                                   Note: Number in brackets are %changes in exchange rate in Q2/2020 from Q4/2019;
                                                                                                                                                         - = appreciate (strong), + = depreciate (weak)

                                 USD Trade Weighted Index & Thai baht                                                                                                  Thai Baht Movement Drivers
                                         USD Trade Weighted Index            THB/USD                                                                      Current Account            Net direct investment       SET Foreign Netbuy
                                128                     COVID-19 pandemic               28 Strong
Dollar index (Jan 2006 = 100)

                                126                                          Thailand                                                                     BEX Foreign Netbuy         THB/USD (Right axis)                                    Strong
                                                                                        29
                                124   COVID-19 outbreak in Wuhan            lockdown
                                                                               end
                                                                                                                                             6                                                                               Forecast 29
                                                                                             Baht / US dollar

                                122                                                     30                                                   3                                                                             (as of Aug 20) 30
                                                                                                                         Billion US dollar

                                                                                                                                                                                                                                                 Baht / US dollar
                                120                                                     31
                                                                                                                                             0                                                                                              31
                                118                                                     32
                                116                                                                                                          -3                                                                                             32
                                114                                                     33
                                                                                                                                             -6                                                                                             33
                                112                                                     34                                                         Sep
                                                                                                                                                   Feb

                                                                                                                                                   Feb
                                                                                                                                                   Apr

                                                                                                                                                    Oct

                                                                                                                                                   Apr
                                                                                                                                                   Jun
                                                                                                                                                    Jul
                                                                                                                                                   Jan

                                                                                                                                                   Jan
                                                                                                                                                   Nov

                                                                                                                                                   Q3F
                                                                                                                                                   Q4F
                                                                                                                                                   May

                                                                                                                                                   Aug

                                                                                                                                                   Dec

                                                                                                                                                   May
                                                                                                                                                   Mar

                                                                                                                                                   Mar
                                                                                             Weak
                                      Sep

                                      Feb
                                       Oct

                                      Apr
                                      Jun
                                       Jul

                                      Jun
                                       Jul
                                      Jan
                                      Nov
                                      Aug

                                      Dec

                                      May

                                      Aug
                                      Mar

                                                                                                                                                                          2019                                    2020                           Weak
                                             2019                   2020                                                                          Source: SET, ThaiBMA, BOT, CEIC and Consensus Economics Inc. (as of Aug 2020)
                                 Source: Federal Reserve Board and Bank of Thailand                                                               Note: Current account and Net direct investment data for July 2020 are not yet released              6
THAILAND AMIDST COVID-19: CHALLENGES & OPPORTUNITIES - KIRIDA BHAOPICHITR 9 OCT 2020 - Joint Foreign Chambers of ...
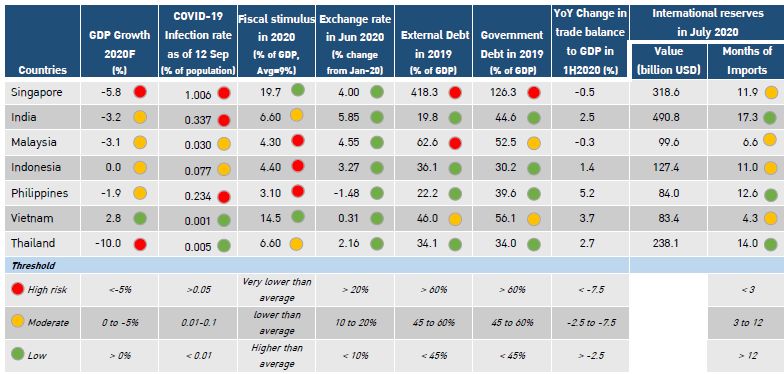
Thailand’s macroeconomic
foundation is strongest among ASEAN & india
• Thailand’s macroeconomic foundation remains strong even during the Covid-19 pandemic.
• Thailand's GDP will contract most this year in ASEAN as its reliance on international tourism is higher than
  other ASEAN countries’.

 Source: Compiled by TDRI EIS`                                                                                   7
THAILAND AMIDST COVID-19: CHALLENGES & OPPORTUNITIES - KIRIDA BHAOPICHITR 9 OCT 2020 - Joint Foreign Chambers of ...
Thai Economy

               8
THAILAND AMIDST COVID-19: CHALLENGES & OPPORTUNITIES - KIRIDA BHAOPICHITR 9 OCT 2020 - Joint Foreign Chambers of ...
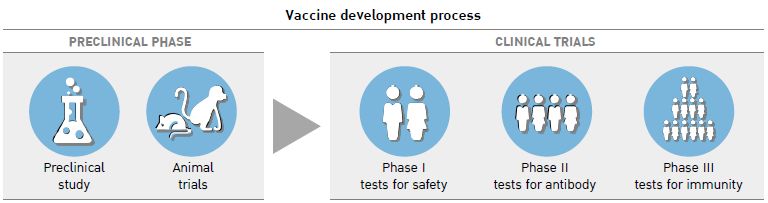
Thai economy will only
            recover to pre-COVID levels in 2023
• Thai economy could contract by 10% this year and will not reach pre-COVID levels until 2023
  as exports, tourism and domestic consumption will only start to pick up once the COVID-19
  pandemic ends.
• Post-COVID, exports will be affected by lower                                          Household debt
  global purchasing power and higher trade                                          Household debt          % of GDP (right axis)
  barriers; tourism will recover to pre-COVID                       13.6                                                            80
  levels only in 2023 when the pandemic is                          13.4                                                            79.5
  behind and international movements of                             13.2                                                            79
  people fully resume.

                                                    Trillion baht
                                                                     13                                                             78.5

• With rising household debt burden and fall in                     12.8                                                            78

  incomes and savings, household                                    12.6                                                            77.5
  consumption could take up a year to recover                       12.4                                                            77
  to its pre-COVID level after the pandemic is                      12.2                                                            76.5
  over.                                                              12                                                             76
                                                                            Q3-18     Q4-18      Q1-19   Q2-19    Q3-19    Q4-19
• Rising NPLs and excess capacity will lead to                        Source: Bank of Thailand
  a slump in private investment and delay
  adoption of automation until 2022.
                                                                                                                                           9
Exports to recover in 2020H2
                                      But could contract by 10% this year
                                                                                                  Growth of Thai export value by Major Products
   • In 7M2020, exports declined by 7.7% yoy; excluding                                              Agriculture            Manufacturing              Arms & ammunition
     gold and ammunitions, export declined by 10.2%yoy,                                              Gold                   Other exports
                                                                                                     Total exports          Total exports (excl. gold, Arms & ammunition)
     the lowest in 5 years.                                                                 20
   • Exports to all market have collapsed with                                              10
     the exception of US & China                                                             0

                                                                                  Percent
   • Exports in 2020H2 are expected to recover from H1 as                                   -10

     major markets gradually open. However, exports for                                     -20

     the entire year may contract up to 10%.                                                -30
                                                                                                    Q1 Q2 Q3 Q4 Q1 Q2 Jan Feb Mar Apr May Jun Jul
                                                                                                         2019                                 2020

         Destination                                               %YoY Growth of Thai export                                                              %Share
                                    Q3-19        Q4-19   Q1-20   Q2-20   May-20      Jun-20          Jul-20          2018         2019       2020YTD       2020YTD
   Japan                              2.8         -5.3    -5.5   -13.5    -24.2       -21.6           -17.5          13.0         -1.7        -10.5            9.7
   EU 28                             -5.2         -5.9    -3.9   -30.3    -39.7       -22.7           -17.0           5.2         -5.9        -16.8            8.8
   ASEAN                            -14.2         -8.3     4.3   -22.3    -27.9       -30.3           -19.9          14.9         -8.3        -10.6           24.6
    ASEAN-5                         -12.7         -9.9     5.7   -19.7    -27.9       -38.8           -24.6          13.6         -9.8         -9.7           14.0
    CLMV                            -16.2         -6.2     2.7   -25.8    -28.0       -17.8           -13.2          16.7         -6.3        -11.8           10.6
   USA                               7.7          5.5     -2.7    8.9     -17.3        14.5            17.8           5.5         11.8          4.5           14.5
   Middle East                       1.9          5.6      0.4   -19.7    -26.4        -7.9           -20.1          -0.1          0.4        -10.6           3.3
   Australia                         14.0        -14.9    -3.3   -16.1     -7.4       -16.7           -10.4           2.6         -5.1         -9.8           4.1
   China                              2.8          1.6    -0.9    12.1     15.3        12.0            -2.7           2.7         -3.8          4.5           12.8
Total exports                        -0.5        -4.4     0.9    -15.2   -22.5        -23.2          -11.4           6.9          -2.6         -7.7          100.0
Total exports
                                     -5.2        -4.2    -0.5    -18.7   -27.8        -16.8          -13.6           7.7          -5.0         -10.2          95.3
excl. gold, arms & ammunition
Source: Bank of Thailand with TDRI calculation                                                                                                                        10
Tourism receipts (18% of GDP)
                                                      will be almost 70% below last year’s
                                                                                                                                                                                Tourism receipts
               • From Jan-July, tourism receipts fell                                                                                                          Tourism receipts: Thai                  Tourism receipts: Foreigner
                 by 60%yoy with international tourists collapsing to                                                                                           YoY growth: Foreigner                   YoY growth: Thai
                                                                                                                                                       350                                                                     20
                 6.7 million visitors.

                                                                                                                     Tourism receipts (billion baht)
                                                                                                                                                       300                                                                     0
               • International tourist arrivals for 2020 will not be

                                                                                                                                                                                                                                      YoY growth (%)
                                                                                                                                                       250                                                                     -20
                 many more than 6.7 million (39 million last year)                                                                                     200                                                                     -40
                         • Travel bubbles are starting with international                                                                              150                                                                     -60
                           visitors such as businessmen, medical                                                                                       100                                                                     -80
                           tourists, education-related visitors, migrant                                                                                50                                                                     -100
                           workers, or long-stay tourists.                                                                                               0                                                                     -120

                                                                                                                                                               Feb

                                                                                                                                                               Apr

                                                                                                                                                                Oct

                                                                                                                                                               Jun
                                                                                                                                                                Jul

                                                                                                                                                               Nov

                                                                                                                                                               Jan
                                                                                                                                                               Jan

                                                                                                                                                               Aug

                                                                                                                                                               May
                                                                                                                                                               May

                                                                                                                                                               Dec

                                                                                                                                                               Mar
                                                                                                                                                               Mar

                                                                                                                                                               Sep
                                                                                                                                                                                 2019                              2020

                                                        Tourism revenue in ASEAN in 2018                                                                                                      Source: Ministry of Tourism and Sports
                                                         Toursin revenue (left axis)             Average growth in 2008-2018
                    70                                                                                                                                                                       50%
                           58.08
                    60                                                                                                                                                39.0%
                                                                                                                                                                                             40%
                    50
Billion US dollar

                    40                                                                                                                                                                       30%
                    30                 21.77          20.42                                                                                                                                  20%
                               10.5%                                 15.60               10.5%               11.4%                                     12.7%                         10.8%
                    20                                                       8.2%   10.08
                                                              6.4%                                    9.73                                                                                   10%
                    10                         1.3%                                                                        4.83                                1.67           0.76
                     0                                                                                                                                                                       0%
                           Thailand     Malaysia      Singapore       Indonesia        Vietnam        Philippines             Cambodia                         Myanmar        Lao PDR                 Source: World Bank
                                                                                                                                                                                                                                     11
Which businesses are
                                                               affected most during Covid-19?
                                                              NEGATIVE IMPACT ON BUSINESS                                             POSITIVE IMPACT
                                                       HIGH                        MODERATE                             LOW            ON BUSINESS
                   employees
                    >1 Million

                                                                           • Shopping malls
                                            • Hotels
                                                                           • Retail shops                                             • E-commerce (Food,
IMPACT ON EMPLOYMENT

                                                                                                                                        online Marketplace, etc.)
                                                                                                                                      • Delivery services &
                                            • Airlines                                                                                  packaging
                       100,00 – 1 Million

                                            • Wellness, Spa                                                                           • E-services (education,
                          employees

                                            • Hair salons, Barber          • Restaurants                                                banking, movies, etc.)
                                              shops                        • Construction                   • Electronics             • Digital services
                                            • Pubs & bars                                                                             • Telecom services
                                            • Automobile and parts                                                                    • Medical supplies (face
                                            • Garments                                                                                  mask, alcohol, vitamins,
                                                                                                                                        etc.)
                                            • Entertainment                •   Public transportation                                  • Insurance
                   employees

                                                                                                            • Electricity, gas
Almost 10 million are
                                            severely affected by covid-19
  • Jobs of 9.7 million people are severely affected by the lockdown from Covid-19 outbreak, with
    the largest group being retailers followed by cooks & waiters, hair dressers, tour guides and taxi,
    van and motorcycle drivers.
             Employed persons impact from COVID-19 by occupation (Million persons)                              Low impact
                                Low impact occupation*                                                          12.1      million persons
                                           Agriculturists                                           11.8        Moderate impact
                          High-skill Technicians, tailors
                                                Retailers
                                                                          3.9
                                                                                5.1
                                                                                                                15.6      million persons

               Cooks, waiters, hair dressers, tour guides           1.6
                         Taxi, van & motorcycle drivers           1.2
                                       Low-skill workers       0.6
                                          Street vendors      0.4
                          Hotel or restaurant managers       0.3                                                High impact
                                  General hired workers
                                          Assistant cook
                                                             0.3
                                                            0.1
                                                                                                                9.7    million persons
           Head chefs, museumand art center directors       0.1
                       Tourism operators and hotel staff    0.04
                                                  Singers   0.02
                               General customer service     0.02
Controllers, technicians on ships & airplanes and pilots    0.01
Source: BOT, Labor Force Survey Q3:2019 with TDRI calculation
Note: Low impact occupation include State employees, heath care workers, chemists, physicists, computer programmers, telecom workers and
high-skilled workers                                                                                                                     13
shift from full-time employment
                                               to part-time has been significant
                                                                                Number of part-time workers by industry (million persons)
                                                                            8
            • The number of part-time workers rose by                                      5.68                                          Apr-2019       Apr-2020
                                                                            6
              5 million in April 2020 compared to April                     4
                                                                                    4.20

              2019, while 2.6 million lost their overtime                   2                              0.94                         1.03               0.85
                                                                                                    0.31           0.18 0.58     0.34               0.21
              and 3.5 million lost their full-time jobs.                    0
                                                                                   Agriculture    Manufacturing   Construction   Wholesale           Hotel &
            • Sector wise, overtime was cut in all                                                                                & Retail          Restaurant

              sectors, while full time workers fell in all                      Number of overtime workers by industry (million persons)
              sectors except manufacturing. Workers                         3
                                                                                                                                         Apr-2019       Apr-2020
                                                                                                                                 1.77
              were reduced to part time in all sectors.                     2                       1.59
                                                                                                                                        1.26
                                                                                    1.01 0.87                                                       0.88
                                                                            1                              0.67                                            0.55
                                                                                                                   0.39
                                                                                                                          0.13
                       Number of workers                                    0
                  40                                                               Agriculture    Manufacturing   Construction   Wholesale           Hotel &
                                                 Part-time                                                                        & Retail          Restaurant
                  35     6.0                     (49 hrs. per week)        8
                  20                                                                                                                     Apr-2019       Apr-2020
                                                 Full-time                  6       4.99                   5.17
                  15                                                                       4.10     4.40                         4.32 3.87
                         24.7
                                                 (35-49 hrs. per week)
                                      21.2                                  4
                  10                                                                                               1.85 1.42                        1.92 1.37
                                               Source: Labor Force Survey   2
                   5
                                               with TDRI calculation
                   0                                                        0
                       Apr-2019     Apr-2020                                       Agriculture    Manufacturing   Construction   Wholesale           Hotel &
                                                                                                                                  & Retail          Restaurant 14
Farm incomes may recover in
               2020H2 but remains less than last year’s
• Farm incomes in the 5M2020 declined by 1.2%                                     YoY Growth of Farm income by Crops (5M2020)
                                                                                                 Price        Production        Farm income
  yoy from down in paddy and sugarcane                             30
  production.                                                      20
  • In 2020H1, Production of rice fell by 35.7%                    10

     and sugarcane by 14% from severe drought                       0

                                                     Percent
                                                                   -10
  • Rubber and sugar prices have declined with
                                                                   -20
     oil prices.
                                                                   -30
  • This is despite the Bt56 billion transfers
                                                                   -40
     under Price Insurance schemes for rice,                                    Total   Fruits    Fowl      Swine    Sugar Rubber Cassava Shrimp Paddy
     rubber, cassava , oil palm, maize from                                                                          cane

     Oct 2020 to July 2021.                                                                        Agricultural Production
                                                                                                            2019     2020 (Forecast)
• Farm incomes should recover in 2020H2 but                                       -0.7%
                                                                    100
  remain lower than last year’s as
                                                                     80           74.9 74.4
  • Production and prices recover, but will
     remain lower than last year’s                                   60                           -6.6%
                                                    Million tons

                                                                                                                    +3.0%
• Overall incomes of agriculture households will                     40                           31.3 29.3
                                                                                                                                     +1.4%       +8.4%
                                                                                                                    16.8 17.3
  fall this year as 65% of their incomes are from                    20
                                                                                                                                       4.8 4.9   4.3 4.7
  remittances & non-farm work which have                                 0
  collapsed after the COVID-19 outbreak.                                          Sugarcane          Rice           Oil Palm           Rubber     Maize
                                                                             Source: Office of Agricultural Economics with TDRI calculation
                                                                                                                                                           15
Public investments are on-going

            • The central government’s expenditures on
              infrastructure has not decreased much.
            • Factors that led to the lag in spending are
              usually related to complications that arise
              from putting plans into practice, not from
              COVID-19.
            • Projects in the pipeline, including those in
              the EEC, are on-going.

                                                             16
Eastern Economic Corridor (EEC)
                                     development is progressing
    • Except for the airplane maintenance and repair operations (MRO), other projects in the EEC are
      on-going.

                The Eastern Economic Corridor                          BOI-approved investments in EEC
        (Chachoengsao, Chonburi, and Rayong provinces)

                                                                           BOI-approved Foreign Direct
                                                                                  Investments

Source: Thailand Board of Investment                                                                     17
How much government cash transfers
                  so far to mitigate covid-19 impacts?
                                                                   Government Cash Transfers
                                                                        Welfare card Bt3.6bn
• Government has transferred Bt612 billion                Fragile groups Bt20.3bn
                                                                                      Water Bt2.8bn
  (4% of GDP) to almost 30 million Thais            Electricity Bt32.7bn
  from May to July.
• The largest number of transfers is for the    Agriculture
  ‘We Do Not Leave One Another’ program         Bt111.0bn                                                          Social Security
                                                                                                                     Bt229.0bn
  in which Bt15,000 were transferred to
  14.2 million informal sector workers,
  followed by transfers of Bt15,000 to 7.4                                 612.5
                                                                           Billion baht
  million agriculturists.
• So far, only Bt344 billion out of the Bt600
  billion loan amount are used for
  the transfers.
                                                Informal sector workers/ We Do Not Leave One Another Program
                                                                          Bt213.0bn

                                                              Source: Related ministries and government agencies

                                                                                                                                18
Less than BT50 has been
                              approved from the bt400 billion loan
  • Of the Bt1,448 billion (46,111 projects) proposed, Bt93 billion baht (195 projects) have passed NESDC’s
    screening, of which 70% are job creation and agriculture-sector projects, 26% are tourism related projects
    and only 2% are construction projects.
  • So far, only Bt38 billion or 0.25% of GDP (7 projects) have been approved for implementation by the Cabinet,
    of which Bt23 billion are tourism-related and the rest agriculture-related projects; most projects are nation-
    wide and can be disbursed within this September.
  • For the rest of the year, out of the projects that have passed the NESDC’s screening, those that can be
    quickly implemented will be prioritized such as in agriculture, job creation and SME business promotion
    (the latter is Bt2 billion).
                                                                                                                                                     EXPECTED 2020
                                                                                                             IMPLEMENTED              BUDGET         DISBURSEMENT
                  PROJECT NAME                                                ACTIVITY                          AREAS               (Billion Baht)    (Billion Baht)
 We Travel Together                                        Increase consumption and boost tourism sector     All provinces                 20                20
 Kumlungjai                                                Increase consumption and boost tourism sector     All provinces               2.4               2.4
                                                                                                             157 wildlife refuges
 Developing Potential in Wildlife Tourism                  Develop quality tourism                                                       7.4               0.4
                                                                                                             (57 provinces)
 Safe Tourism Zones                                        Develop quality tourism                           Potential provinces        0.15              0.06
 One Tambon 1 New Agricuture Theory                        Develop New Agriculture Theory: self-dependence   All provinces               9.8               3.9
 Developing model areas in promoting quality of life
 according to the new agriculture theory towards the       Develop New Agriculture Theory: self-dependence   All provinces               4.9               3.1
 “Kok Nong Na Model”
 Developing One Stop Service for Soil and Fertilizer for
                                                           Develop large and modern agriculture              All provinces               0.2              0.06
 Communities
Source: Compiled by TDRI; Disbursements calculated by TDRI                                                                                                             19
GOVERNMENT STILL HAS ROOM TO SPEND
                             The FY2021 Budget                                         • Total FY2021 Budget is Bt3.3 trillion (+3.1% from
                3.5
                           3.3                                                           FY2020); excluding debt repayment is Bt3.0
                            0.19        Interest Payment
                                                                                         trillion or 17.8% of GDP (+4.3% from FY2020)
                3.0         0.1         Principal Repayment
                                                                                          • Current Expenditure (excl. interest payment) 70.6%
                            0.67        Capital Expenditure                                 (+4.2% from FY2020)
                2.5
                                                                                          • Capital Expenditure 20.5% (+4.7%)
                2.0
                                                                                       • Central Fund in FY2021 Budget is Bt614.6 billion
Trillion bath

                                                                                         (Bt518.8 in FY2020) of which Bt40 billion are
                1.5
                                                                                         COVID19 pandemic-related expenses.
                                        Current Expenditure
                            2.33        (excl. Interest Payment)                       • Additional borrowing can be up to Bt1.9 trillion
                1.0
                                                                                         in Y2021 (12% of 2021 GDP) if public debt were
                                                 0.61          Other Central Fund        not to exceed the current 60% of GDP ceiling and
                0.5
                                                   0.48        Expenses for
                                                               the COVID-19 Outbreak
                                                                                         up to Bt2.7 trillion (17% of 2021 GDP) if the public
                                                    0.1        Contingency Fund          debt ceiling is lifted to 65% of GDP.
                0.0                                            for Emergencies
                      FY2021 Budget           Central Fund                             • Only Bt100 billion soft loans for SMEs have been
                Source: Budget Bureau                                                    extended (out of Bt500 billion).
                                                                                                                                           20
Sectoral trends
  post-COVID

                  21
Digitalization will continue
                               to sharply expand
ONLINE COMMERCE/SERVICE                            FROM-HOME ECONOMY
        MARCH 2020
                                                • From-home economy will drop from current level but
                                                  will continue as it saves money and helps attract
                                                  employees, and related infrastructure has already
                                                  been invested. As a result, there will be
                                                • demand for technology enablers (5G, platform, cloud
                                                  service, electronic device) and employment of IT
                                                  workers.
                                                • some shifts to suburban homes for WFH workers.

                                                   TELEMEDICINE
        JULY 2020
                                                • COVID-19 has migrated patients to telemedicine
                                                  • Ping An Good Doctor’s users grew 900% (Dec
                                                     2019
                      65/
                      35
                                                     to Jan 2020) and is eyeing on ASEAN market
                                                  • Doctor Raksa, partnered with Bamrungrad, saw its
                                                     registered online users increased from 300K to
                            Note: Data on            400K in April 2020 alone.
                            YouTube numbers
                            in July table are
                                                • ASEAN has potential for telemedicine due to low
                            as of March 2020      access to medical services.                       22
tourism will recover Post-COVID
Domestic tourism • Domestic tourism will start recovering in             Foreign tourism     • International tourism will start to
                      Q3/2020 with FIT, seminars, conferences,                                 slowly recover end-2020 with focus
                      and leisure travel; it will not fully recover                            on selected business and medical
                      to pre-COVID level until 2022.                                           travelers.
                    • Government’s domestic tourism stimulus                                 • Foreign tourists who are vaccinated
                      packages of Bt22.4 billion from July to                                  can start to come in 2022.
                      October 2020 will also help..                                          • Full recovery will not be until 2023

TRANSITION PERIOD                                                      POST-COVID
• Health consciousness will shift pattern of tourism                  • Pre-COVID patterns of tourism will return.
   • from mass tourism to FIT and mainly domestic tourists            • There will be opportunities in medical tourism and
   • from large hotels to boutique hotels                               health & wellness as Thailand has strengthened its
   • from long distance to shorter travel distance as long-             reputation from handling the pandemic e.g. Dusit
     distance flights are few and more expensive.
                                                                        Thani has partnered with a hospital to start a
• Air travel cost will be higher as there are fewer                     wellness facility in Hua Hin.
  flights and aviation rules require physical                         • Regional tourism will increase as international
  distancing in long flights.                                           tourists, especially from China, will reduced their
   • Air Asia, for example, may increase prices by 10-15%               travel budgets; Chinese tourists will prefer to travel
     to break even.                                                     to countries that do not have an anti-Chinese
• Many M&As in hotel and airline businesses are                         sentiment.
  expected.                                                           • AR/VR in tourism will not happen.
                                                                                                                                23
Opportunities for Manufacturing
                                          and Agriculture
                MANUFACTURING                                                AGRICULTURE / FOOD
TRANSITION PERIOD                                                           TRANSITION PERIOD & POST-COVID
• COVID-19 has confirmed the need for companies to                     • Demand for food falls as demand from
  balance cost effectiveness with risk management by                     tourists and export markets decline, and
  • relocating the production for non-Chinese markets out                some countries’ governments promote
    of China
                                                                         domestic production of staple foods.
  • diversifying sources for raw materials and parts
                                                                       • Some purchases will be diversified to
  • increasing stock levels
                                                                         Thailand to reduce supply disruptions.
POST-COVID
                                                                       • Demand for meats from Thailand will be
  Global supply chain for manufacturing could be in
  3 overlapping models:
                                                                         higher as many countries e.g. China fear
                                                DIVERSIFICATION
                                                                         animal disease outbreaks and contagion to
       IN CHINA,           RELOCATIO
       FOR CHINA           N/ON-                Sourcing of raw          humans.
       Production          SHORING              materials and parts
       that serves         Relocation of        are diversified        • Bio-products such as plant based meats and
       the Chinese         production           away from China.
       market will         for non-             Although the cost        bio-degradable products continues to be the
       remain in           Chinese              is higher but lowers
       China.              market out of        risks of supply          new trend and can make use of abundant
                           China.               disruption.
                                                                         agricultural produce in Thailand.
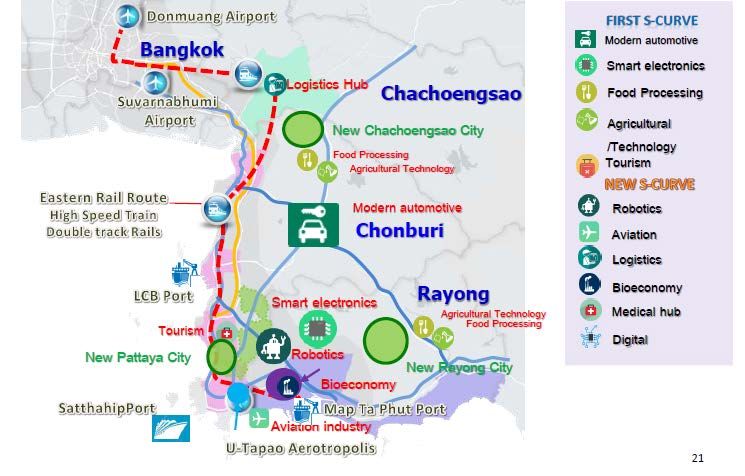
                                                                                                                  24
Companies from china
                                                       have relocated to Thailand
• To diversify risks, firms have been moving out of                                         Examples of relocation from China in 2019
  China.
  • Vietnam has received the majority of the
     relocation in labor-intensive to high-tech
     industries
  • Thailand is the second highest recipient of the
     relocation, with Japanese companies being the
     majority, particularly in automotive parts,
     electrical appliances, and electronics.

Source: TDRI EIS from various sources
Note:     Automotive & Parts       Computer & Parts       Electrical Appliances    Petro-chemical Products      Footwear   Machinery
                            are Japanese, American, South Korean, Chinese and Taiwanese companies, respectively                         25
Opportunities in Thailand’s
                                              real estate market
                     2020                                               Transition Period
• The total number of registered housing units fell
                                                       • Freeze new condo projects; finish existing projects
  since February both yoy and qoq as purchases
                                                       • Move to housing units
  from both Thais and foreigners (around 10% of
                                                       • Reduce cost e.g. bargains with suppliers and use digital
  annual purchases) fell.
                                                         technology for marketing.
• Property sales, particularly of condominiums, will
                                                       • Secure liquidity – many small developers & hotels that have
  remain subdued for the rest of the year, limiting
                                                         low liquidity will need to sell their projects or refinance their
  new property projects, while sale prices of units
                                                         corporate bonds at high interest rates.
  in existing projects are reduced.

                                                 Post-COVID-19
    • Mix of condos and houses in Bangkok will not change much; there may be small shifts to suburban
      houses for those who can afford transportation and can WFH.
    • Housing and condominiums in EEC and industrial estates will return as manufacturing production
      picks up.
    • Large hotels will be back in demand and so will co-working spaces.
    • High-end senior housing and facilities as well as wellness facilities will be in increasing demand.
                                                                                                                             26
Thank you

            27
You can also read