North America Market Snapshot - Capital Markets | Q3 2021 - Colliers
←
→
Page content transcription
If your browser does not render page correctly, please read the page content below

North America Capital Markets Snapshot | Q2 2021

    Capital Markets | Q3 2021

    North America
    Market Snapshot
North America Capital Markets Snapshot | Q3
                                         Q2 2021

Overview
Sales volume continues to accelerate across North America with impressive Q3 numbers.
Record quarterly volume in the U.S. was led by multifamily and industrial, though office is
making a comeback. In Q3, U.S. investors traded US$179.4 billion. Total volume in the U.S. is                                                                                                          Quarterly Pricing      Quarterly Pricing
on pace to set a new all-time high in 2021. The Canadian markets are lagging comparatively                                                                                                                Direction              Forecast
but are in full recovery mode. Canadian volume increased 181% over year-ago figures, with
                                                                                                                                                                                    Multifamily
CAD$10.1 billion in assets traded. Cap rate compression continues, and pricing has increased
nearly across the board.
                                                                                                                                                                                    Office
Headline makers in Q3 include inflation, rising energy        a North American focus is at rates not seen in decades.
prices, supply chain disruption, a return to the office,      Meanwhile, fundraising remains healthy, with investors                                                                Industrial
the economic slowdown in China, interest rate volatility,     like Starwood procuring record funds.
and Canada’s election. These disruptions captured the
                                                              Pricing is on the upswing across asset classes in
attention of real estate investors, driving capital to hard                                                                                                                         Retail
                                                              most of North America, with investors pouring more
assets. Impending tax law changes in the U.S., which
                                                              money than ever into multifamily assets. In the U.S.
will impact real estate owners, are expected to bring
                                                              alone, multifamily volume was roughly in line with                                                                    Hotel
additional sellers to market in Q4, further propelling
                                                              that of industrial and office combined. Year-end is
sales volume as the year closes out.
                                                              historically the single-largest sales quarter in any given
A record amount of capital is waiting to be deployed          year. With the current improvement in fundamentals
across North America, and investors are eager to tap          across property types, attractive yields, global capital                      Investors are targeting North American Assets
into these funds. While aggregate uninvested capital          allocations, potential tax law changes, and pent-up
declined globally, it has held steady in North America,       demand for assets after a year of disruption in 2020, Q4
                                                                                                                                                                              64%

                                                                                                                                Capital On Sideline Targeting North America
per Preqin data. The overall percentage of money with         is primed to be another record-setter.
                                                                                                                                                                              62%

                                                                                                                                                                              60%
            David Amsterdam                                               Lucas Atkins                                                                                        58%
            President, U.S. Capital Markets and                           President, Capital Markets | Canada
            Northeast Region                                              Lucas.Atkins@colliers.com                                                                           56%
            David.Amsterdam@colliers.com                                  +1 416 643 3424
            +1 212 716 3556                                                                                                                                                   54%

                                                                                                                                                                              52%
            Aaron Jodka                                                   Emeka Mayes
            Director of Research, Capital Markets | U.S.                  Partner, Head of Capital Markets Brokerage | Canada                                                 50%
            Aaron.Jodka@colliers.com                                      Emeka.Mayes@colliers.com                                                                                    07     08 009 010 011 012 013 014 015 016 017 018 019 020 YTD
                                                                                                                                                                                    20     20   2   2   2   2   2    2   2    2 2   2   2   2
            +1 617 330 8059                                               +1 514 764 2822                                                                                                                                                        21
                                                                                                                                                                                                                                              20
                                                                                                                                                                                                                  North America

                                                                                                                                            Source: Colliers, Preqin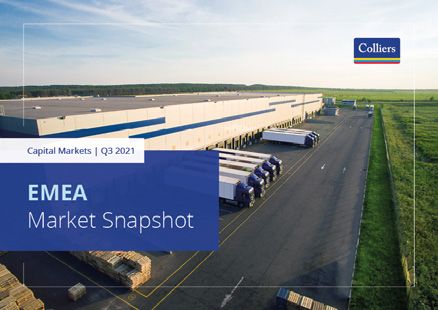
North America Capital Markets Snapshot | Q3
                                         Q2 2021

Contents

Click on the text below to view the specific asset classes

             U.S.                                  Canada        Contacts
           Multifamily                             Multifamily

               Office                                Office

            Industrial                              Industrial

               Retail                                 Retail

               Hotel                                  Hotel
North America Capital Markets Snapshot | Q2 2021

    Capital Markets

    U.S. Snapshot
North America Capital Markets Snapshot | U.S. | Q3 2021
Multifamily
$78.7 Billion
Multifamily is the clear-cut volume leader in 2021. Strong fundamentals, soaring rent growth,
and a capital pivot are driving prices to new heights. Investors are so enthusiastic about this Quarterly Volume
space that competition is stiff, and deals are highly competitive in every market.
16.3%
Double-digit rent growth is common in markets across Growth corridors contain the most concentrated
the country. Combined with solid occupancies, property volume. Dallas, Atlanta, and Phoenix were the top
incomes are thriving, pushing some of the most markets through Q3, but buyers are flocking in record
Year-Over-Year Price Change
substantial price growth (16.3%) of any asset class over numbers to markets in the Southeast and Southwest. At
the past year, per Real Capital Analytics. the same time, dense urban areas in the Northeast and
on the West Coast are becoming hotspots for activity.
Sales volume of $178.5 billion year-to-date puts
multifamily on track to shatter previous records. Cap rate compression continues, with investors Spring Creek Towers,
Brooklyn, New York
While overall sales volume across property types set comfortable underwriting healthy rent growth and
a new quarterly highwater mark, much of that is due stable occupancies. Still, cap rates are only one piece
to multifamily’s strength. This asset class accounts of the investment puzzle, and some markets seem
$1.8 Billion | 46 Buildings | 5,881 Units
for more than 40% of all investment dollars this year, mispriced today compared to historical values. This
driving the overall direction of commercial real estate suggests that opportunities still exist and that capital
pricing and volume. flows may
Multifamily Volume Continues pivot back to slower-growth markets in the
to Rise
quarters ahead.
Top Markets
Multifamily volume continues to rise
Dallas, Texas | Atlanta, Georgia | Phoenix, Arizona
45%
43%
41%
39%
What to Watch
Share
Share
37%
Portfolio Allocation | Pricing in Single-Family
Volume
35% Housing | Sustainability of Rent Growth
Volume
33%
31%
29%
Will Mathews | Multifamily Lead
27%
U.S. Capital Markets Board of Advisors
25% Will.Mathews@colliers.com
+1 404 877 9285
1
3
1
3
1
3
1
3
1
3
1
3
1
3
Q
Q
Q
Q
Q
Q
Q
Q
Q
Q
Q
Q
Q
Q
15
15
16
16
17
17
18
18
19
19
20
20
21
21
Sources: Colliers, Real Capital AnalyticsNorth America Capital Markets Snapshot | U.S. | Q3 2021
Office
Office sales volumes are back to typical levels. Q3 marked the strongest quarterly total since
$34.8 Billion
year-end 2019, in line with quarterly averages from 2015-2019. Capital is returning to core Quarterly Volume
coastal markets, particularly Manhattan. The debt markets continue to buoy cash-on-cash
returns.
Fundamentals are stabilizing, an optimistic sign for
office investors. National office absorption turned
across the country. Meanwhile, investors are
purchasing commodity office product in the suburbs
16.9%
positive in Q3, with more than half of all markets to demolish and convert into industrial space. Year-Over-Year Price Change
posting gains. Growth markets like Atlanta, South
Investors are starting to cash in on Manhattan’s
Florida, Austin, Nashville, Salt Lake City, Las Vegas,
office market, driving its recovery. The nation’s top
and Dallas led the charge. New York City and Boston
office market is still far from its historical average,
also turned positive in Q3. While physical occupancies
remain low in many markets, tenants are active,
but several important deals have been negotiated, a One Memorial, Cambridge,
suggesting that stabilization will transition to recovery
positive sign of what’s to come. Recent sales include
the Daily News Building, the Pfizer Building, and
Massachusetts
in the quarters ahead.
the yet-to-close purchase of St. John’s Terminal by $825.1 million | $2,015 / SF | 409,000 SF
Conversions are gaining traction, though there are Google for $2.1 billion. That deal follows the trend
differences market-to-market. Life science is a thriving of major tech companies acquiring physical assets.
demand driver, as venture capital investment has Sales and values remain strong for office assets that
never been higher in this space. These increased funds
are creating opportunities to reposition assets in
have stabilized tenancy. Properties with vacancy and
rollover risk continue to see uncertain pricing, and by
Top Markets
urban cores and the suburbs. The life science industry and large, sellers are unwilling to test the market. Boston, Massachusetts | San Jose, California |
is heavily concentrated in a few markets but expanding Seattle, Washington
Capital is migrating South and West
6%
4%
What to Watch
Investment Share Difference
2% Corporate Ownership | Growth Corridors | Conversions
0%
(2%)
(4%) Frank Petz | Office Lead
U.S. Capital Markets Board of Advisors
(6%) Frank.Petz@colliers.com
+1 617 330 8123
(8%)
Mid-Atlantic Midwest Northeast Southeast Southwest West
Sources: Colliers, Real Capital AnalyticsNorth America Capital Markets Snapshot | U.S. | Q3 2021
Industrial
$39.5 Billion
Industrial real estate is a hot investment target throughout the U.S. Seventeen of the top 25
Quarterly Volume
markets for investment sales year-to-date are on a record-setting sales pace.
Industrial performance is off the charts. Absorption portfolio trades, the largest being Oxford Properties’
records are being shattered quarter after quarter, rents
are rising, and new development is leasing quickly. It’s
acquisition of KKR’s industrial portfolio. In addition,
Black Creek acquired a 48-property portfolio from
16.9%
no wonder that cap rates are compressing to new lows, Prologis. Both deals had reported cap rates in the low Year-Over-Year Price Change
with several recent deals trading at sub-3% cap rates. 4% range. Torchlight Investors claimed the top spot for
the largest single-asset purchase, a Target distribution
Labor shortages are prompting companies to rethink
center in New Jersey. The 1.1 million square foot, newly
their distribution networks. Some groups are searching
built asset traded at a reported 3% cap rate.
for additional distribution centers to accommodate
drivers who want to make it home daily. This means With global supply chains kicking into gear, the need
KKR Portfolio Acquisition
opening centers 250 miles +/- apart. for additional industrial capacity is clear. Investors $2.2 Billion | 149 Properties | 14.5 Million SF
have room to run in this product type, and investment
Portfolio activity is picking up, driving investment sales
volumes are forecast to reach new highs in Q4.
volumes. Nine of the top 10 deals in the quarter were
Record YTD volume in numerous markets State City/Cities Top Markets
Arizona Phoenix Los Angeles, California | Dallas, Texas | Atlanta, Georgia
WA Los Angeles, Inland Empire,
California
San Diego, East Bay
MN Georgia Atlanta
MA
PA NJ
Massachusetts
Maryland
Boston
Baltimore
What to Watch
NV
CA MD Supply Chain Disruption | Cap Rate Compression |
Minnesota Minneapolis
MO Labor Shortages
Missouri St. Louis
TN
AZ
New Jersey Camden
GA Nevada Las Vegas
TX
Michael Kendall | Industrial Lead
Pennsylvania Philadelphia U.S. Capital Markets Board of Advisors
Tennessee Memphis Michael.Kendall@colliers.com
+1 949 724 5545
Texas Dallas, Houston
Washington SeattleNorth America Capital Markets Snapshot | U.S. | Q3 2021
Retail
$17.4 Billion
Retail investment is approaching a “normal” level. Between 2015-19, quarterly volume
Quarterly Volume
averaged $18.4 billion, and Q3 volume is now within range. Grocery-anchored centers
remain highly sought after, but shopping centers are trading with more regularity, a
promising sign for the future.
Retail fundamentals are on the mend, with another frequently. Both The Forum at Carlsbad and La 12.4%
quarter of positive absorption, the strongest seen Encantada in Tucson sold this quarter. The properties
since year-end 2017. In addition, the days of record- ranged in size from 246,000-265,000 square feet and Year-Over-Year Price Change
setting store closures appear to be behind us, with included an Apple store as an anchor.
retail once again supporting income streams and
Retailers continue adapting to consumer preferences,
attracting investors. Planned closures in 2021 are on
pace to be the lowest total in more than a decade.
including curbside pick-up, contactless shopping, Annaly Capital Grocery
Portfolio
and online ordering, while simultaneously testing
Retail posted strong Year-Over-Year increases in sales new store formats. Operational efficiency will be
volume, up 127%. However, its relative capture of paramount. Retailers will adopt more automation, and Acquisition | $390 million | 25 Properties |
investment dollars is below average, with about 10% we anticipate an increasing share of physical store 3.1 million SF
of all commercial investment sales in Q3, compared space to shift to online sales fulfillment. Intriguing
to 16% historically. In addition to Slate Grocery retail investment opportunities are set to take shape
REIT’s acquisition of a 25-property grocery-anchored
portfolio, shopping centers/malls are trading more
in the coming years, so keep a watchful eye on this
space. Top Markets
Los Angeles California | Atlanta, Georgia |
Phoenix, Arizona
Annual volume
Annual change
Volume Change by retail
By Retail investments
Investments
400% 384%
350%
What to Watch
Volume%% Change
300% 271%
Change
250% 223%
200%
Holiday Sales | Automation | New Store Formats
150% 127%
Volume
100%
50% 23%
7%
0%
(50%)
(9%)
El Warner | Retail Lead
U.S. Capital Markets Board of Advisors
El.Warner@colliers.com
+1 949 724 5690
Sources: Colliers, Real Capital Analytics
Drug Store Single Tenant Shops Retail Overall Unanchored Center Centers GroceryNorth America Capital Markets Snapshot | U.S. | Q3 2021
Hotel
$9.0 Billion
Hotel investment was up 289% over the past year. Hotel has been the most stressed of all Quarterly Volume
asset classes, but the market is rebounding. Investors are still on the hunt for discounts,
perpetuating a bid/ask spread.
Hotel fundamentals rebounded quicker than any rates remaining north of 11%, the highest of major 11.4%
other property type. According to data from Smith asset types. However, these rates have been cut in
Travel Research, occupancies improved by 14.3 half over the past year. Year-Over-Year Price Change
percentage points Year-Over-Year in September.
Midscale assets are dominating recent sales, thanks
Along with a rebound in room rates (ADR), RevPAR
Margaritaville Hollywood
to Apple Hospitality selling a 20-property portfolio
(revenue per available room) surged nearly 80%
totaling 2,133 rooms. Investors are also branching out
nationwide, bringing investors back to the market.
Occupancy rate gains were the most substantial in
into other market segments. Hotels in major hubs like
Washington, D.C., San Francisco, and New York, plus
Beach Resort, Hollywood,
luxury and upper-upscale properties. RevPAR saw
the strongest recovery in the hardest-hit markets,
resorts and luxury properties, are beginning to trade
more regularly. This suggests that liquidity is getting
Florida
$270 million | $732,000 / Room | 369 Rooms
including Boston, New York, Oahu, and Nashville. back to normal. Overall, hotel offers continued upside
Hotel is still no stranger to distress, with CMBS default as business and leisure travel bounce back.
Top Markets
RevPAR growth is rebuilding
Orlando, Florida | Seattle, Washington | Austin, Texas
Top 4 Markets - RevPAR Growth % YOY
#1 Boston #2 New York #3 Oahu #4 Nashville What to Watch
273.5% 269.9% 252.8% 220.7% Labor Market Recovery | Convention Activity |
Business and Leisure Travel
RevPAR Growth % YOY
Rich Lillis | Hotel Lead
119.5% 78.4% U.S. Capital Markets
Rich.Lillis@colliers.com
Top 25 markets average U.S. Average +1 561 353 3640
Sources: Colliers, STRNorth America Capital Markets Snapshot | Q2 2021
Capital Markets
Canada SnapshotNorth America Capital Markets Snapshot | Canada | Q3 2021
Summary
Investment activity is roaring back to life in Canada. With an impressive CAD$10.1 billion in sales volume, Q3 delivered one of the strongest totals on record.
However, unlike past CAD$10 billion-plus sales quarters, volume wasn’t driven by entity-level deals or massive portfolios.
Investors continue to bank on multifamily and industrial real estate. Each of these asset classes posted quarter-over-quarter gains in sales volume. Office investment is also trending upward,
more than tripling Q2 numbers. Retail and hotel activity eased, but on the upside, hotel volume in Q3 topped the 2018-19 quarterly average.
Multifamily CAD$3.5 Billion
Quarterly Volume
Multifamily was the top investment target in Q3, racking up nearly
CAD$3.5 billion in sales.
Capital allocations to the multifamily market are on pace to top 2020’s CAD$10.7
billion. Eleven deals surpassed CAD$100 million this quarter, the largest being
the 642-unit Island Park Towers in Ottawa, Ontario. Acquired by Homestead for
$214,000
CAD$267 million, this deal marked the largest single-asset sale in 2021. Investment $/Unit
is flowing into Ontario, where nine of the top 10 deals occurred. The lone exception
was Avenue Living’s CAD$145 million acquisition of a seven-property portfolio in
Edmonton, Alberta, including 874 units. The reported cap rate on the transaction
was 5.1%.
What to Watch
Migration Patterns | Record Capital Allocation | Rent Growth
Sources: Colliers, Real Capital AnalyticsNorth America Capital Markets Snapshot | Canada | Q3 2021
Office Industrial
Third-quarter office sales accelerated on the back of one major Investors’ insatiable demand for industrial product continued in Q3.
transaction: The Bow in Calgary, Alberta.
The 2-million-square-foot asset sold for CAD$1.2 billion, or CAD$593 per square foot, Sales volume hit CAD$3.2 billion, the second-strongest quarterly total on record. PIRET
to Oak Street Real Estate Capital, a U.S.-based investor. H&R REIT reportedly sold the and Ivanhoe Cambridge jointly acquired a 25-property portfolio totaling 2.2 million
property to reduce its exposure to the Calgary market. With energy prices on the rise, square feet in Ontario. The sale price was nearly CAD$700 million, marking the largest
Calgary is now the scene of some intriguing acquisition opportunities. The Bow sale deal of the quarter. Another landmark deal in Q3 was a 235,000 square foot Amazon-
aside, Q3 deal volume was light. Still, it outperformed the previous quarter, with two anchored property in Brampton, Ontario. This asset traded at CAD$397 per square
transactions posting north of CAD$50 million. Deals like these prove that liquidity is foot, reflecting the increasing valuation of Amazon facilities.
slowly returning to the office market.
CAD$2.3 Billion CAD$3.2 Billion
Quarterly Volume Quarterly Volume
$471 $262
$/SF $/SF
What to Watch What to Watch
Cap Rate Compression | Supply Chain Disruption |
Remote Work | Labour Migration | Rent Growth New Development
Sources: Colliers, Real Capital AnalyticsNorth America Capital Markets Snapshot | Canada | Q3 2021
Retail Hotel
Retail transactions remain heavily driven by grocery-anchored Investor sentiment for the lodging asset class continues to improve.
properties. However, unanchored centers are beginning to trade more
frequently, a positive sign for overall market liquidity.
Transaction volume through Q3 reached nearly CAD$1.1 billion, surpassing full-year
Nearly CAD$900 million traded in Q3. Year-to-date, investment volume totaling volume in 2020 (CAD$862 million) and pacing close behind comparable levels of
CAD$3.1 billion has already eclipsed last year’s figures and is on pace to match those pre-COVID activity in 2019 (CAD$1.25 billion through Q3). While it wasn’t a stand-out
from 2019. In the third quarter’s largest deal, Newman Blvd Development Limited quarter for overall volume, Q3 saw nearly CAD$300 million in hotel transactions,
Partnership acquired the 207,000 square foot Centre Carnaval in Montreal, Quebec. including the first handful of major market trades since the onset of the pandemic and
The Super C-anchored center traded for CAD$70 million. In Richmond Hill, Ontario, a significant majority of acquisitions for continued hotel use. Moving into Q4 2021 and
11300 Yonge Street sold for CAD$37.1 million, or CAD$1,855 per square foot. Royal early 2022, we anticipate liquidity in the hotel sector will continue to build as operating
Bath and Kitchen and the Salvation Army anchor this 20,000 square foot property. fundamentals and debt market conditions recover further.
CAD$874 Million CAD$288 Million
Quarterly Volume Quarterly Volume
$402 $141,000
$/SF $/Room
What to Watch What to Watch
Holiday Sales | Spending at Bars and Restaurants | Hotel Operating Fundamentals | Financing Availability |
E-Commerce and Omnichannel Retail Pipeline of Hotel Transactions
Sources: Colliers, Real Capital AnalyticsNorth America Capital Markets Snapshot | Q2 2021
Contacts
For more information please use the contact details below:
David Amsterdam Lucas Atkins
President, U.S. Capital Markets and Northeast Region President, Capital Markets | Canada
David.Amsterdam@colliers.com Lucas.Atkins@colliers.com
+1 212 716 3556 +1 416 643 3424
Aaron Jodka Emeka Mayes
Director of Research, Capital Markets | U.S. Partner, Head of Capital Markets Brokerage | Canada
Aaron.Jodka@colliers.com Emeka.Mayes@colliers.com
+1 514 764 2822
+1 617 330 8059
U.S. Capital Markets Board of Advisors
Will Mathews El Warner Frank Petz Rich Lillis
Multifamily Lead Retail Lead Office Lead Hotel Lead
Will.Mathews@colliers.com El.Warner@colliers.com Frank.Petz@colliers.com Rich.Lillis@colliers.com
+1 404 877 9285 +1 949 724 5690 +1 617 330 8123 +1 561 353 3640
Peter Nicoletti Michael Kendall Jeff Black
Portfolio Sales Lead Industrial Lead Debt & Equity Lead
Peter.Nicoletti@colliers.com Michael.Kendall@colliers.com Jeff.Black@colliers.com
+1 212 716 3620 +1 949 724 5545 +1 617 330 8049North America Capital Markets Snapshot | Q2 2021
The world of Colliers
View our other recent
Market Snapshots
by clicking on the
images:
Annualized Revenue Established in Managing APAC
$3.3B 66 2B
(US$) Countries (square feet)
EMEA
Lease/sale transactions Assets under management Comprised of
54,000 $45B 18,000
(professionals)
All stats are for 2020, are in U.S. dollars and include affiliates
Data Disclaimer
This report gives information based primarily on Colliers International data, which may be helpful in anticipating trends in the property sector. However, no warranty is given
as to the accuracy of, and no liability for negligence is accepted in relation to, the forecasts, figures or conclusions contained in this report and they must not be relied on for
investment or any other purposes. This report does not constitute and must not be treated as investment or valuation advice or an offer to buy or sell property.
For the latest news from Colliers, visit Colliers.com or follow us on Twitter: @Colliers and LinkedIn.
© 2021. All rights reserved
Colliers International
1114 Sixth Avenue
New York, NY 10036You can also read