Dave Flitman, CEO | Peter Jackson, CFO

Page created by Robert Lang
 
CONTINUE READING
Dave Flitman, CEO | Peter Jackson, CFO

    BLDR.com
Dave Flitman, CEO | Peter Jackson, CFO
Safe Harbor & Non-GAAP Financial Measures
   Cautionary Notice

   •   Statements in this presentation and the schedules hereto that are not purely historical facts or that necessarily depend upon future events, including statements
       about expected market share gains, forecasted financial performance or other statements about anticipations, beliefs, expectations, hopes, intentions or strategies
       for the future, may be forward-looking statements within the meaning of Section 21E of the Securities Exchange Act of 1934, as amended. In addition, oral
       statements made by our directors, officers and employees to the investor and analyst communities, media representatives and others, depending upon their
       nature, may also constitute forward-looking statements. All forward-looking statements are based upon currently available information and the Company’s current
       assumptions, expectations and projections about future events. Readers are cautioned not to place undue reliance on forward-looking statements. Forward-
       looking statements are by nature inherently uncertain, and actual results or events may differ materially from the results or events described in the forward-looking
       statements as a result of many factors. Builders FirstSource, Inc. undertakes no obligation to publicly update or revise any forward-looking statements, whether as
       a result of new information, future events or otherwise. Any forward-looking statements involve risks and uncertainties, many of which are beyond the Company’s
       control or may be currently unknown to the Company, that could cause actual events or results to differ materially from the events or results described in the
       forward-looking statements, including risks or uncertainties related to the continuing COVID-19 pandemic, the Company’s merger with BMC and other acquisitions,
       the Company’s growth strategies, including gaining market share, or the Company’s revenues and operating results being highly dependent on, among other
       things, the homebuilding industry, lumber prices and the economy. Builders FirstSource, Inc. may not succeed in addressing these and other risks. Further
       information regarding factors that could affect our financial and other results can be found in the risk factors section of Builders FirstSource, Inc.’s most recent
       annual report on Form 10-K filed with the Securities and Exchange Commission (“SEC”) and may also be described from time to time in the other reports the
       Company files with the SEC. Consequently, all forward-looking statements in this release are qualified by the factors, risks and uncertainties contained therein.

   Use of Non-GAAP Financial Measures

   •   This presentation includes financial measures and terms not calculated in accordance with accounting principles generally accepted in the United States (“GAAP”)
       in order to provide investors with an alternative method for assessing our operating results in a manner that enables investors to more thoroughly evaluate our
       current performance as compared to past performance. We believe these non-GAAP measures provide investors with a better baseline for modeling our future
       earnings expectations. Our management uses these non-GAAP measures for the same purpose. We believe that our investors should have access to the same set
       of tools that we use in analyzing our results. These non-GAAP measures should be considered in addition to results prepared in accordance with GAAP, but should
       not be considered a substitute for or superior to GAAP results. Our calculations of adjusted net income, adjusted net income per share, adjusted EBITDA, free cash
       flow and net leverage are not necessarily comparable to similarly titled measures reported by other companies. The company provided detailed explanations and
       reconciliations of these non-GAAP financial measures in the earnings release included in its Form 8-K filed with the Securities and Exchange Commission on
       August 5, 2021.

                                                                                                                                        2 | © 2021 Builders FirstSource. All Rights Reserved.
Dave Flitman, CEO | Peter Jackson, CFO
Benefitting From Favorable Industry Trends
10.0    Annual Average Rate on 30-year Fixed-Rate Mortgages           Market Trends Support Further Upside
 9.0
 8.0
 7.0                                                                                               Single-family
 6.0                                                                  Mortgage rates             housing starts and
%

 5.0                                                                    remain near                homes under
 4.0                                                                   January 2021                 construction
 3.0                                                                     record low              continue on robust
 2.0
                                                                                                   upward trend
 1.0

2,000                Single-Family Housing Starts (000’s)     1,000     Single-Family Homes Under Construction (000’s)
1,800                                                           900
1,600                                                           800
1,400                                                           700
1,200                                                           600
1,000                                                           500
  800                                                           400
  600                                                           300
  400                                                           200
  200                                                           100
    0                                                             0

             Source: U.S. census and Freddie Mac                                        3 | © 2021 Builders FirstSource. All Rights Reserved
Dave Flitman, CEO | Peter Jackson, CFO
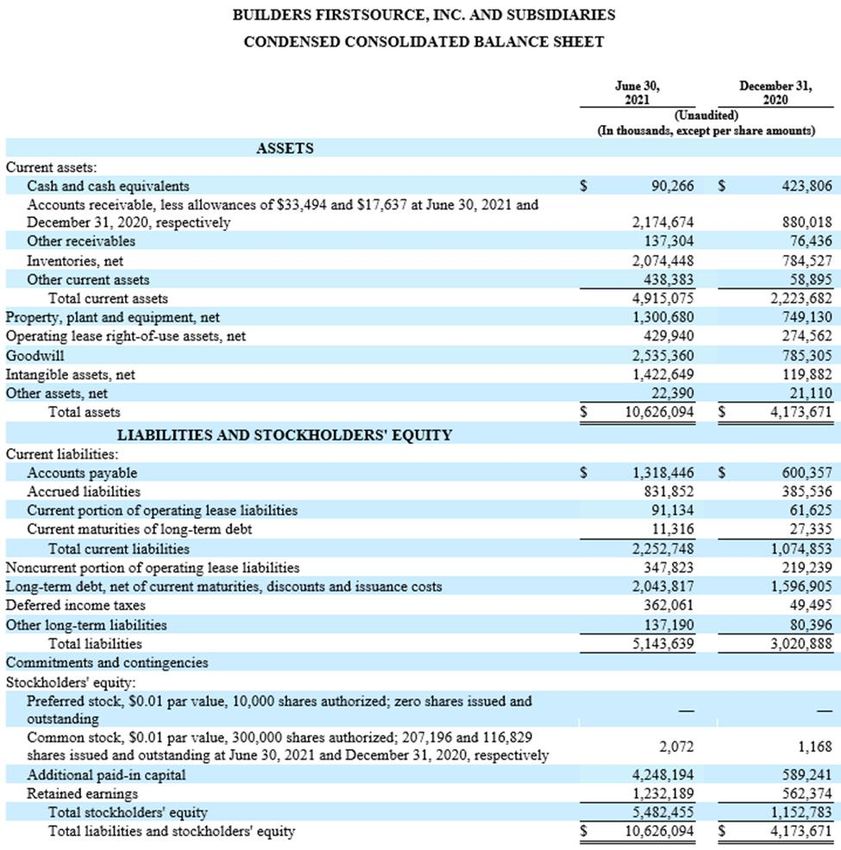
Highlights of Record Q2 2021 Results
                                                                                                    Record Sales Performance
    Net sales                        $5.6b                                                          •      Focused execution, accelerating demand, and increasing prices drove record results
                           +90.6% YoY                                                               •      Improving housing starts, low mortgage rates and strong demand for single family
                     (+35.3% Core Organic1)                                                                living remain tailwinds for our products and services.

                                                                                                    Operational Performance Drove Record Adjusted EBITDA and Adjusted
    Gross Profit                                                                                    EBITDA Margin
                                      $1.6b
                                                                                                    •      Established partnerships with customers, ability to deliver value, and an emphasis
                                 +105.4% YoY                                                               on cost management produced higher profitability
                                                                                                    •      Disciplined pricing process continued to support margins during volatile market
    Adjusted                                                                                               conditions
    EBITDA                      $835.8m                                                             •      BMC integration efforts and cost synergies ahead of schedule; delivered $36 million
                                                                                                           through Q2 and estimating $80 to $100 million in 2021
                                    +231.6%
                               15.0% Margin                                                         Value-Added Focus Creating Long-Term Value
                                                                                                    •      Strength and scale of value-added offerings led by 58% growth in manufactured
                                                                                                           products
                                                                                                    •      Strategic acquisitions with heavy value-added product mix contributed 3.5% to net
                                                                                                           sales, supporting value-added products growth
  1CoreOrganic compares Q2 2021 to combined non-GAAP pro forma first quarter 2020, and excludes other acquisitions, commodity price fluctuations and differences in selling days
  between periods.

                                                                                                                                                                                   4 | © 2021 Builders FirstSource. All Rights Reserved.
Dave Flitman, CEO | Peter Jackson, CFO
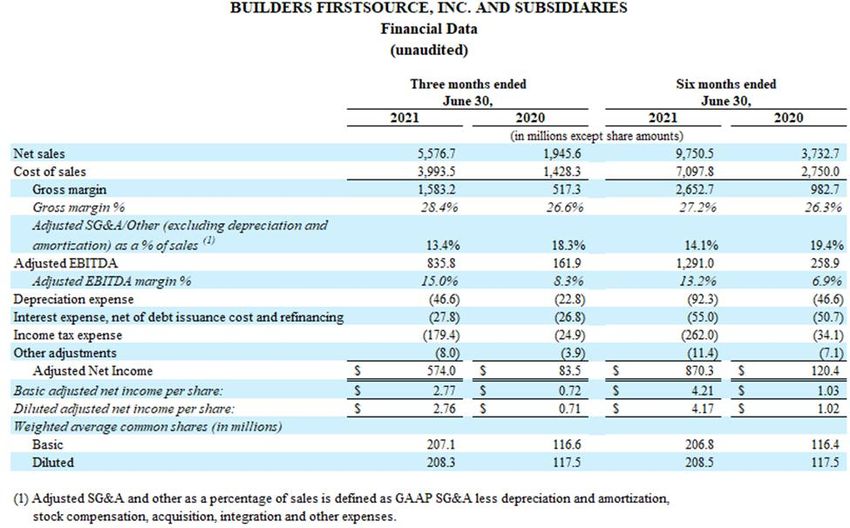
Expect to Deliver 10%+ Adjusted EBITDA Margin
  on 2021E Base Business1
                                                                                         …The Majority of our EBITDA Growth is Driven by Value-Added Products
Over 60% of BFS’s Base Business1 is Non-Commodity…                                               and Sustainable Operations Improvement / Synergy
   Windows, Doors & Millwork         Lumber & Lumber Sheet Goods                             Base business       Commodity $400mbf               Base Business CAGR
   Manufactured Product2             Specialized Products and Other
                                                                                                                                                          $18.5
                                                                                     Sales ($Bn)                                 $12.8                    $3.2
                                                                                                             $10.9                $0.3
                                                                                                                                                          $15.3                   15.4%
Value-Added          21%                          23%                                                         $11.5              $12.5
Product Mix:
                                                                                                              ($0.6)
  43%                       2021E Base                                                                                                                    $2.3
                          Business Product                                           Adj. EBITDA                                                          $0.7
                                                                                                                                 $1.1
                            Sales Mix at                                             ($Bn)                     $0.8              $0.0                                              32.0%
                                                                                                                                 $1.1                     $1.6
                             $400/mbf                                                                          $0.9
               22%                                                                                            ($0.1)
                                                              Commodity                                        2019              2020                    2021E
                                                 34%           Exposed2:
                                                                                     Implied adj.                                                                      Double digit
                                                                38%                  EBITDA                    7.7%               8.7%                    10.1%        Adj. EBITDA
                                                                                     margin on base                                                                    net of lumber
                                                                                     business                          +100bps           +140bps                       price effect
                     1. This estimate assumes $400/mbf lumber & sheet good pricing
                     2. Commodity exposure in manufactured products represents
                        an estimated 4% of 2021E net sales mix at $400/mbf
                                                                                                                                          5 | © 2021 Builders FirstSource. All Rights Reserved
Dave Flitman, CEO | Peter Jackson, CFO
Alliance Acquisition Aligned with Growth Strategy
Transaction Announcement: May 2021 | Purchase Price: ~$400 Million

    Geographic Footprint, Value-Added Offerings, and Market Leadership Create a
         Highly Strategic Fit for Builders FirstSource’s Integrated Network

                           Alliance Acquisition Overview
                                                                                                                                                            #1 in Arizona with
  • Largest supplier of building materials in Arizona; a market that BFS did
    not have a significant presence
                                                                                                                                                             over 45% market
                                                                                                                                                            share with the top
  • Experienced leadership team with ~500 dedicated employees across 9
    operating locations                                                                                                                                       home builders
                                                                                                                  Prescott MSA

                                       Strategic Rationale
                                                                                                                                                             #3 ranked single-
  ✓   Strong economy and population trend fuels a long runway for housing                                                        Phoenix MSA
                                                                                                                                                                family MSA;
      growth in the market                                                                                                                                   Fastest growing
                                                                                                                                                              county in U.S.(1)
  ✓   Strategically-located facilities enabling delivery throughout Arizona

  ✓   Personalized go-to-market approach to enhance the customer
                                                                                                                                     Tucson MSA                  Unparalleled
      experience and enable cross selling across business units
                                                                                                   150-mile primary
                                                                                                                                                                   delivery
  ✓   BFS value-added offerings expected to drive revenue synergies
                                                                                                   distribution radius                                            radius and
                                                                                                                                                                 dependability

               1Norada
                                                                                                                                    6 | © 2021 Builders FirstSource. All Rights Reserved
                         Real Estate Investments - Maricopa County Housing Market Report Q3-2020
Dave Flitman, CEO | Peter Jackson, CFO
Construction is Among Least Digitized Sectors
                                                 Industry Digitization Index

           Well-Positioned to Lead a Digital Transformation in Homebuilding
    1 McKinsey    estimates                                                    7 | © 2021 Builders FirstSource. All Rights Reserved
    2   Information & Communication Technology
Dave Flitman, CEO | Peter Jackson, CFO
Paradigm Acquisition1 Bolsters Digital Capabilities
  Transaction Announcement: June 2021 | Purchase Price: ~$450 Million | Est. 2021 Revenue: $50 Million

                                                                                                                                              The Company will pursue three key priorities with
               Strategic Rationale & Commentary
                                                                                                                                              Paradigm:
• Paradigm has proven capabilities and technology in digitizing Homebuilding
                                                                                                                                              1) Drive BFS productivity with Paradigm technology
• BLDR can invest in Paradigm’s technology to improve internal operational efficiency
                                                                                                                                              2) Utilize BFS platform to grow Paradigm adoption
• Combining the skills and capabilities of both teams will lead to increased market
  share, and a more efficient Homebuilding industry                                                                                           3) Expand use of Paradigm technology on behalf of BFS customers

             Our Operations &                                                                    Interactions With                                   Our Customers’
            Internal Processes                                                              Vendors and Our Customers                                  Business

                                                                                                                                                                                       Key Pillars in
                                                                                                                                                                                       Digital Strategy

      Automated Take-Off                                                         2D Plan Take-Off To 3D Revit Models                                Millwork Configuration

                                                                                                                                                                                       Key Paradigm
                                                                                                                                                                                       Capabilities
                                                                                                                                                                        8 | © 2021 Builders FirstSource. All Rights Reserved.
        1 The closing of the Paradigm acquisition remains subject to the satisfaction or waiver of certain customary conditions to closing.
Dave Flitman, CEO | Peter Jackson, CFO
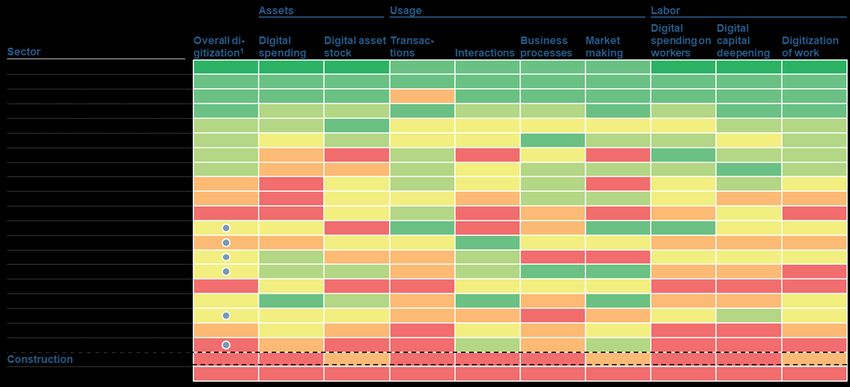
Paradigm Business Overview
                            Digital Capabilities                                                  Software Revenue Mix & Positioning
• Software development and consulting services that help industry participants
  boost sales and become more efficient                                                                                         • 2020 product launches:
• A simplified process for configuring, estimating, and manufacturing complex                                                            • Diversify revenue
  products with many options
                                                                                                                                         • Quickly gaining momentum
• BFS ownership provides:
                                                                                                                                         • Target different segments
      • Incremental investment to speed development                                                                                        with greater market size

      • Customer access that will accelerate adoption
                                                                                  Omni   Nexus   Estimate   Omni Builder   Vendo
      • Deep credibility with builders

                       A Growing Digital Platform                                     Improved Homebuilding Process Utilizing Digital Tools
                                                                                 • Whole house configuration and take-offs provide real-time user feedback
                                                                                 • Creates opportunities for improved adoption and capture rates of value-add

                                                        $50M
               $23M

                2018          2019         2020          2021E

                              Digital Capabilities Drive More Efficient Construction
                                                                                                                           9 | © 2021 Builders FirstSource. All Rights Reserved
Dave Flitman, CEO | Peter Jackson, CFO
Our Digital Platform will Fuel Long-Term Growth
                     Monetizing The Opportunity                                                             Strategic Direction
• $1B of revenue growth in the next 5 years                                   • Homebuilding and the sourcing of material is going digital
      • Increased Software Licensing revenue from                                   • $120B of annual material spend
        enhanced sales channel
                                                            Stepping
                                                            Stone to
      • Improved internal and market efficiencies                             • Provide digital solutions that solve builder pain points
                                                           ~$1 Billion
      • Increased wallet share with existing customers     Opportunity        • BLDR will be a key player in emerging digitally supported homebuilder space
      • Quoting and Specification of value-add products
      • Ability to attract new customers

      Our Operations & Internal                           Interaction With Our Vendors
                                                                                                                  Our Customer’s Business
            Processes                                            and Customers

             • Estimating and design efficiency                 • Improved stakeholder collaboration                        • Pre-construction time and cost savings

             • Automated order flow                             • Accurate whole house take-offs                            • Better control over the build process

             • Less visits to each job site                     • New Home Builder tools for                                • Reduced material and labor waste
                                                                  homebuyer engagement

                     Digital investment will deliver sustainable long-term Growth
                                                                                                                   10 | © 2021 Builders FirstSource. All Rights Reserved
Pursue Accretive Tuck-in M&A
                                                     500+ US Building Products Businesses Totaling ~$80B in Sales Mapped

                • Broaden product portfolio in target
 Geographic       markets
   Scale        • Deepen presence in existing service
                  areas by expanding product portfolios

                • Enhance opportunities to partner with
 Value Add        customers
 Products       • Increase higher margin value-added
                  products mix

                • Provide innovative solutions to build
Technological     more efficiently and address labor
Advancement       constraints

                                                                                                                                     Target acquisition criteria

                1Based on $81K assumed materials cost per home as of 2019 according to BAML cost of a home data, adjusted for 2020
                lumber prices and 973K single-family, 320K multi-family housing starts in 2020 according to the U.S. Census Bureau                                 11 | © 2021 Builders FirstSource. All Rights Reserved
                Source: U.S. census and Company estimates
Synergy Target One Year Ahead of Schedule
                                                               Estimated Run-Rate Cost Savings of ~$150m(1)
                                  Major Milestones             ($ in millions)

        Focus On Customers And Employees                                          $140m to $160m

  • Leadership changes finalized and turnover remains well
   managed and stable
  • First Wave of ERP conversions successfully completed                                                         Now expect to
                                                               $80m to $100m                                   realize savings of
                       Focus On Cost Synergies                                                                   ~$90m in 2021
                                                                                                                  growing to
  • ~$36 million of cost savings through Q2                                                                     ~$150m in 2022
  • Realized run-rate savings of $80m to $100m for full year
   2021
  • Now expect realized cost savings of ~$150m(1) through
   2022, compared to initial expectations of $130-$150m              2021              2022
   through 2023

          1Excludes   $125m - $145m costs to achieve.
                                                                                     12 | © 2021 Builders FirstSource. All Rights Reserved.
Q2 2021 - Broad Strength Across Product Portfolio
   Net sales by product category (Q2 2021 compared to combined pro forma Q2 2020)
    ($M/ % change)

                                                                                                                           Specialized Products:                                                   Lumber & Lumber
                                  Value-Added Products:
                                                                                                                                                                                                     Sheet Goods:
                       Manufactured                            Window, Doors &                               Siding, Metal &                           Gypsum, Roofing &
                         Products                                 Millwork                                      Concrete                                   Insulation                                                   $2,604

                                         $1,091                                                                                  $415
                                                                                  $838
                                                                $691                                          $305                                                              $192
                       $557                                                                                                                                 $158
                                                                                                                                                                                                      $851

                                         +96%                                    +21%                                            +36%                                          +21%                                    +206%

                   Q2 20                 Q2 21                 Q2 20             Q2 21                       Q2 20              Q2 21                      Q2 20              Q2 21                   Q2 20            Q2 21

   Net sales mix by product category                                                                                  Value-added core organic1 sales grew 35.4%
   (% of total net sales)                            Manufactured
                                                     Products
                                                                                                                       •     57.9% growth in Manufactured Products – Robust single family
    Product Mix ~35%

                                                                         Gypsum, Roofing
                              Windows,                   20%             & Insulation                                        demand drove significant growth despite material availability
      Value-Added

                              Doors &        15%                 3%         Siding, Metal
                                                                                                                             constraints
                              Millwork
                                                                            & Concrete
                                                                   7%
                                                                                                                       •     Solid windows, doors and millwork growth despite ongoing
                                                                    8%       Other                                           material availability challenges
                                                                                                                       •     Off-site assembly and other innovative solutions continue to help
                                                   47%
                                                                                                                             customer’s address labor challenges and jobsite productivity,
                                                                                                                             fueling profitable growth
                                             Lumber & Lumber
                                             Sheet Goods

                                                                                                                                                                                             13 | © 2021 Builders FirstSource. All Rights Reserved.
              1Core Organic compares Q2 2021 to combined non-GAAP pro forma Q2 2020, and excludes other acquisitions, commodity price fluctuations and differences in selling days between
              periods.
Q2 2021 Core Organic Sales Growth Across All End Markets
coupled with High EBITDA Conversion rate of Sales
           Net sales bridge2 (Q2 2021 compared to combined pro forma Q2 2020)
           ($M)
                                               Q2 2020                                Non-Commodity                                     Commodity                                        Q2 2021

                                                                                                                                              1,516

                                                                                              1,135                                                                                         5,577
                                                                                    +35.3% Core Organic
                                                 2,926                               +3.5% Acquisitions

  Repair &                                                                                                                                                                                                  EBITDA highlights:
  Remodel / Other                                       Core      organic1         sales highlights:
                                                                                                                                                          252                                               •   Non commodity Adjusted
                      17%                                                                                                             Q2 2020
                                                        •   Single family: +44.1% on broad market                                                                                                               EBITDA growth of ~75%
Multi-Family                                                recovery                                                                  Non
                6%                                                                                                                                                 ~191
                                                                                                                                      Commodity                                                             •   Approximately 17% EBITDA
                                                        •   R&R / Other: +16.3% with strength in                                                                                                                Conversion, excluding
                                           77%
                                                            most parts of the country                                                 Commodity                                   ~393                          commodity, demonstrates
                                                                                                                                                                                                                effective execution across the
Single-Family
                                                        •   Multi family: +6.0% on the timing of                                                                                                                P&L
                                                                                                                                      Q2 2021                            836
                                                            projects started in prior periods`
                                                                                                                                                                                                            •   Conversion rate of Commodity
    Net sales mix by end market                                                                                                          Adjusted EBITDA bridge2                                                inflation demonstrates effective
                                                                                                                                          ($M)                                                                  pricing in volatile environment
                  Sales mix: Q2 2021.
                  1Core Organic compares Q2 2021 to combined non-GAAP pro forma Q2 2020 as though the merger with BMC was completed on January 1 2020, and excludes other acquisitions, commodity 14 | © 2021 Builders FirstSource. All Rights Reserved.

                  price fluctuations and differences in selling days between periods.
                  2Adjusted EBITDA non commodity versus commodity mix based on management estimates.
Strong Balance Sheet and Liquidity Provide Financial
Flexibility
 Pro Forma Net Leverage1 Improvement                                                                                                  Balanced Capital Allocation Priorities
                                                        Debt upgraded by                                                              1.       Maintain a strong balance sheet; July $1 billion debt offering at 4 ¼%
                                                        Moody’s and S&P
                                                                                                                                      2.       Reinvest in our business to drive growth and productivity
                                                                                                                                      3.       Continue tuck-in M&A strategy
  4.2X                                                                                                                                4.       Return capital to shareholders
                  3.1X
                                        2.5X
                                                                1.3X                   1.0X

  2017            2018                  2019                   2020                 LTM Q2
                                                                                     2021
 Strong Pro Forma Free Cash Flow 2                                                                                                      Weighted Average Debt Maturity of ~10 Years3
                                                                                      ~$1,500                                                                                                                                      1,000

                                                                                                                                      Increased ABL to $1.4B and                           695
                                                                                                                                   extended maturity to January 2026
                                                                                                                                                                                                                   550

                                        $397.7
                                                               $286.3
  $119.1          $186.2
                                                                                                                                                 -             -    -     -     -     -             -        -                -

  2017            2018                   2019                    2020                  2021E                                                  '21        '22       '23   '24   '25   '26   '27    '28     '29 '30 '31                '32
  18.7%                                  17.7%                   18.0%
                                                                                                                                                                                                         Senior Notes
           1Pro forma as of 12/31/2020, including net proceeds from April 2020 offering of $350 million aggregate principal amount of senior notes due 2027.
           Net Leverage calculated as principal value of debt and lease obligations less cash and cash equivalents divided by LTM Adj EBITDA.
           2 Net of PPE.                                                                                                                                                                    15 | © 2021 Builders FirstSource. All Rights Reserved.
           3Excludes finance leases and other finance obligations.
Raised 2021 Outlook
                                                                                                      2021 Full Year Financial Expectations
Metrics                                                                                Current Guidance                                                                 Prior Guidance                                                    2020 Pro Forma Baseline
Sales1 (YoY Growth)                                                            $18.0 to $19.0 billion (+41% to +48%)                                         $16.0 to $17.0 billion (+25% to +33%)                                                            $12.8 billion
Adjusted EBITDA2 (YoY Growth)                                                  $2.2 to $2.4 billion (+105% to +124%)                                         $1.75 to $1.85 billion (+64% to +73%)                                                             $1.1 billion
Base Business Sales5                                                                               $15.3 billion                                                                        N/A                                                                   $12.5 billion
Base Business Adjusted EBITDA5                                                                      $1.6 billion                                                                        N/A                                                                    $1.1 billion
Free Cash Flow                                                                                 $1.4 to $1.6 billion                                                         $1.3 to $1.5 billion                                                               $286 million
Capital Expenditures3                                                                   $200 million to $220 million                                                   1.4% to 1.6% of net sales                                                               $181 million
Interest expense                                                                             $130 to $140 million                                                          $110 to $115 million                                                                $158 million
Effective tax rate                                                                               23.0% to 25.0%                                                               23.0% to 25.0%                                                                       23.4%
Depreciation & amortization expense 4                                                        $525 to $535 million                                                          $540 to $550 million                                                                $198 million

                                                                                                                  2021 Full Year Assumptions
Metrics                                                                                Current Guidance                                                                 Prior Guidance
Single family starts growth (BLDR geographies)                                               Up mid to high teens                                                         Up low-double digits
Multi-family starts growth (BLDR geographies)                                                Up high-single digits                                           Down high-single to low-double digits
R&R starts growth (BLDR geographies)                                                    Up low- to mid-single digits                                                 Up low- to mid-single digits
Commodity pricing impact (BLDR demand mix)                                                      Up +18% to 28%                                                               Up +10% to 20%
Realized cost synergy savings (BMC integration)                                               $80 to $100 million                                                           $60 to $70 million
                     1.   2021 Sales include the following acquisitions: Bianchi & Company, Kansas Building Supply Company & TW Perry.
                     2.   Adjusted EBITDA is a Non-GAAP financial measure. See the Non-GAAP (Adjusted) Financial Measures slide in this presentation for a definition thereof and a discussion of certain matters regarding non-GAAP guidance.
                     3.   The 2021 capital expenditure expectation is net of proceeds from the sale of property, equipment and real estate.
                     4.   Depreciation expense forecast includes depreciation accounted for within cost of sales.
                     5.   Assumes a $400/mbf commodity price for all periods and maintained for the full year
                                                                                                                                                                                                                                               16 | © 2021 Builders FirstSource. All Rights Reserved.
Differentiated Market Leader Positioned for Above
Market Growth and Expanding Profitability
                      Leadership in a highly fragmented industry

                         Exceptional geographic, customer, and end market
                         diversity

                           Strategic investment in value-added capacity, driving
                           share gains and margin expansion

                            Focus on maintaining strong balance sheet and liquidity

                           Expanding cash flow generation and maintaining leverage

                         Operational excellence and cost management initiatives
                         driving gains in efficiency, productivity, and customer value

                      Experienced management team

                                                             17 | © 2021 Builders FirstSource. All Rights Reserved.
Question
A n swe r
Session

            18 | © 2021 Builders FirstSource. All Rights Reserved
Michael Neese
SVP, Investor Relations
Michael.Neese@bldr.com

214-765-3804
                                         19 | © 2021 Builders FirstSource. All Rights Reserved.
                          www.bldr.com
Base Business 1 Sales and Adj. EBITDA projection
by commodity price

        Illustrative FY 2021E                                                   Assumptions:
                                                                AEBITDA         • Provided a grid with various commodity cost assumptions and
                              Sales ($Bn)                       ($Bn)             the corresponding profits if you assume static commodity prices.
                                                                                  Please keep in mind that shorter term price fluctuations can
                                                                                  result in materially different results than in a static commodity
         $400                 $14.5-16.1                        $1.5-1.6          environment.
                                                                                • Margin rates for each product category is maintained at each
         $500                 $16.1-17.7                        $1.7-1.9          commodity price tier/sensitivity
                                                                                • Total margin changes with commodity tier driven by sales mix
$/mbf

         $600                 $17.5-19.3                        $2.0-2.2          changes
                                                                                • Expenses associated with commodity price changes are included
         $700                 $18.9-20.9                        $2.2-2.4        • Includes Acquisitions and 2021 expectation of realized market
                                                                                  participation
         $800                 $20.3-22.5                        $2.5-2.7        • Price at each tier is static for the full year
                                                                                • Price tiers reflect BFS species/region composite
                                                                                • Low/High ranges for sales set at -/+ 5%

                                                                                                                20 | © 2021 Builders FirstSource. All Rights Reserved
                1. This estimate assumes $400/mbf lumber & sheet good pricing
Reconciliations

                  21 | © 2021 Builders FirstSource. All Rights Reserved.
Reconciliations

                  22 | © 2021 Builders FirstSource. All Rights Reserved.
Reconciliations
                                            BUILDERS FIRSTSOURCE, INC. AND SUBSIDIARIES
                                         CONDENSED CONSOLIDATED STATEMENT OF CASH FLOWS
                                                                                                            Six Months Ended
                                                                                                                 June 30,
                                                                                                     2021                      2020
                                                                                                              (Unaudited)
                                                                                                             (In thousands)
            Cash flows from operating activities:
            Net income                                                                           $      669,815       $               87,691
               Adjustments to reconcile net income to net cash (used in) provided by operating
               activities:
               Depreciation and amortization                                                            261,553                       57,875
               Deferred income taxes                                                                    (32,753 )                      2,248
               Stock-based compensation expense                                                          18,867                        6,720
               Other non-cash adjustments                                                                 3,534                        6,748
            Changes in assets and liabilities, net of assets acquired and liabilities assumed:
               Receivables                                                                             (867,143 )                 (69,991 )
               Inventories                                                                             (840,283 )                 (53,685 )
               Other current assets                                                                     (53,672 )                   2,987
               Other assets and liabilities                                                              10,201                    39,452
               Accounts payable                                                                         448,527                   108,152
               Accrued liabilities                                                                      177,578                   (18,311 )
                   Net cash (used in) provided by operating activities                                 (203,776 )                 169,886
            Cash flows from investing activities:
               Purchases of property, plant and equipment                                               (98,293 )                 (54,809 )
               Proceeds from sale of property, plant and equipment                                        9,321                     1,451
               Cash acquired in BMC Merger                                                              167,490                        —
               Prepayments for acquisitions                                                            (225,000 )                      —
               Cash used for acquisitions                                                               (24,833 )                 (15,893 )
                   Net cash used in investing activities                                               (171,315 )                 (69,251 )
            Cash flows from financing activities:
               Borrowings under revolving credit facility                                             1,769,000                   791,000
               Repayments under revolving credit facility                                            (1,233,000 )                (818,000 )
               Proceeds from long-term debt and other loans                                                  —                    895,625
               Repayments of long-term debt and other loans                                            (470,330 )                (557,964 )
               Payments of debt extinguishment costs                                                     (2,475 )                 (22,686 )
               Payments of loan costs                                                                    (4,272 )                 (13,800 )
               Exercise of stock options                                                                    335                       708
               Repurchase of common stock                                                               (17,707 )                  (4,153 )
                   Net cash provided by financing activities                                             41,551                   270,730
            Net change in cash and cash equivalents                                                    (333,540 )                 371,365
            Cash and cash equivalents at beginning of period                                            423,806                    14,096
            Cash and cash equivalents at end of period                                           $       90,266       $           385,461
                                                                                                                                               23 | 2021 Builders FirstSource. All Rights Reserved.
Reconciliations

                  24 | © 2021 Builders FirstSource. All Rights Reserved.
Reconciliations

                  25 | © 2021 Builders FirstSource. All Rights Reserved.
Reconciliations

                  26 | © 2021 Builders FirstSource. All Rights Reserved.
Reconciliations

                  27 | © 2021 Builders FirstSource. All Rights Reserved.
Reconciliations

                  28 | © 2021 Builders FirstSource. All Rights Reserved.
You can also read