CECONOMY On-Site Event - Ingolstadt, 08 June 2017 - Metro Group
←
→
Page content transcription
If your browser does not render page correctly, please read the page content below
CECONOMY On-Site Event

Ingolstadt, 08 June 2017

                           Date: 08.06.2017   // 1
DISCLAIMER                                                                three-month periods ended March 31, 2017 and
                                                                          December 31, 2016.
                                                                          The combined financial statements of CECONOMY have not been
                                                                                                                                               To the extent that statements in this presentation do not relate to
                                                                                                                                               historical or current facts they constitute forward-looking

AND NOTES
                                                                          audited and may also deviate substantially from (segmental or        statements. All forward-looking statements herein are based on
                                                                          other) information in the consolidated financial statements of the   certain estimates, expectations and assumptions at the time of
                                                                          METRO Group and, thus, may not be fully comparable to such           publication of this presentation and there can be no assurance
                                                                          financial statements. In addition, the historical financial and      that these estimates, expectations and assumptions are or will
                                                                          operative information included in this presentation does not         prove to be accurate. Furthermore, the forward-looking
                                                                          necessarily fully reflect changes that will occur when we, the       statements are subject to risks and uncertainties including
                                                                          prospective CECONOMY business, operate as a separate                 (without limitation) future market and economic conditions, the
BY ACCESSING THIS PRESENTATION YOU AGREE TO THE                           company. Accordingly, such information is not necessarily            behaviour of other market participants, investments in innovative
FOLLOWING RESTRICTIONS                                                    indicative for the future consolidated results of operations,        sales formats, expansion in online and multichannel sales
                                                                          financial position or cash flows of the prospective CECONOMY         activities, integration of acquired businesses and achievement of
This document and the presentation to which is relates is
                                                                          business on a stand-alone basis. All numbers shown are before        anticipated cost savings and productivity gains, and the actions of
intended for information only, does not constitute a prospectus
                                                                          special items, unless otherwise stated. All amounts are stated in    public authorities and other third parties, many of which are
or similar document and should not be treated as investment
                                                                          million euros (€ million) unless otherwise indicated. Amounts        beyond our control, that could cause actual results, performance
advice. It is not intended and should not be construed as an offer
                                                                          below €0.5 million are rounded and reported as 0. Rounding           or financial position to differ materially from any future results,
for sale, or as a solicitation of an offer to purchase or subscribe to,
                                                                          differences may occur.                                               performance or financial position expressed or implied in this
any securities in any jurisdiction. Neither this presentation nor
                                                                                                                                               presentation. Accordingly, no representation or warranty (express
anything contained therein shall form the basis of, or be relied
                                                                          This presentation contains certain supplemental financial or         or implied) is given that such forward-looking statements,
upon in connection with, any commitment or contract
                                                                          operative measures that are not calculated in accordance with        including the underlying estimates, expectations and
whatsoever. This presentation may not, at any time, be
                                                                          IFRS and are therefore considered as non-IFRS measures. We           assumptions, are correct or complete. Readers are cautioned not
reproduced, distributed or published (in whole or in part) without
                                                                          believe that such non-IFRS measures used, when considered in         to place reliance on these statements. We do not undertake any
prior written consent of CECONOMY AG (“CECONOMY”).
                                                                          conjunction with (but not in lieu of) other measures that are        obligation to publicly update any forward-looking statements or
                                                                          computed in accordance with IFRS, enhance the understanding of       to conform them to events or circumstances after the date of this
Historical financial or operative information contained in this
                                                                          our business, results of operations, financial position or cash      presentation.
presentation, if not taken or derived from our accounting records
                                                                          flows. There are, however, material limitations associated with
or our management reporting or unless otherwise stated, is taken
                                                                          the use of non-IFRS measures including (without limitation) the
or derived from the unaudited combined financial statements of
                                                                          limitations inherent in the determination of relevant adjustments.
CECONOMY for the financial years ended September 30, 2016,
                                                                          The non-IFRS measures used by us may differ from, and not be
2015 and 2014 and not from the consolidated financial
                                                                          comparable to, similarly-titled measures used by other               .
statements of the METRO Group, and from the interim
                                                                          companies.
consolidated financial statements of METRO Group for the

                                     On-Site Event Ingolstadt                                                                                  Public                             Date: 08.06.2017            // 2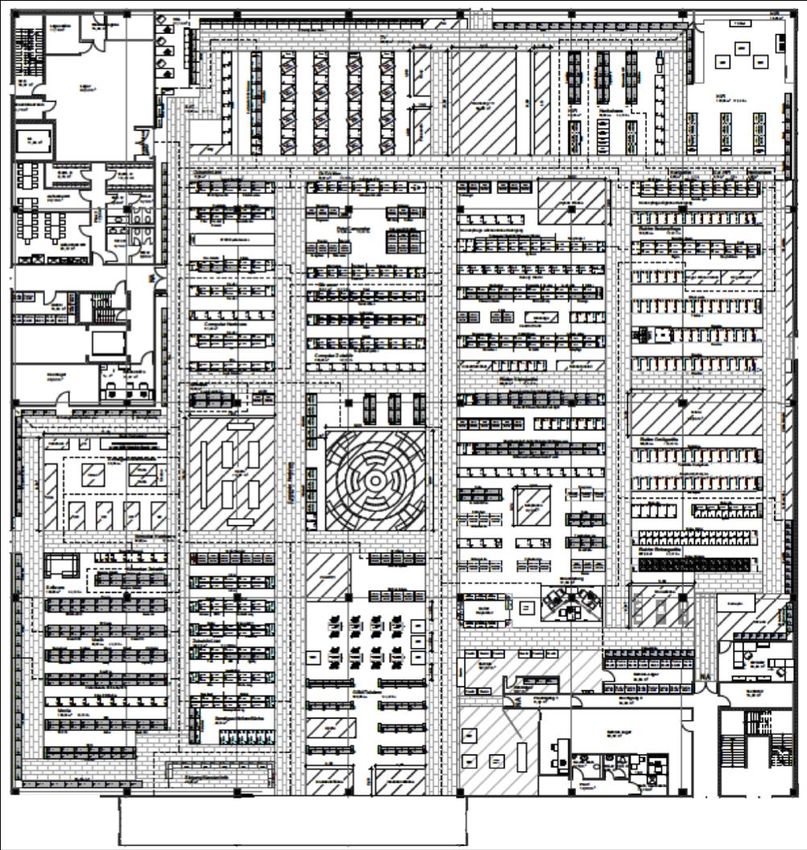
Disclaimer and Notes (cont’d)
This presentation contains forecasts, statistics, data and other        solely relied on as market studies are often based on information      decisions taken by us, you or any third parties that receive this
information relating to markets, market sizes, market shares,           and assumptions that may be inaccurate or inappropriate, and           information. Neither we nor any third party give any
market positions and other industry data on the Company’s               their methodology is inherently predictive and speculative. We         representations as to the accuracy of the market data included in
business and markets (together the “market data”) provided by           have no reason to believe that such information is false or            this presentation. The third parties whose data is cited in this
third party sources as interpreted by us. This market data is, in       misleading or that any material fact has been omitted that would       presentation are neither registered broker-dealers nor financial
part, derived from published research and additional market             render such information false or misleading. Our own estimates         advisors and the permitted use of any market research data does
studies prepared primarily as a research tool and reflects              have not been checked or verified externally. They may differ          not constitute financial advice or recommendations.
estimates of market conditions based on research methodologies          from estimates made by competitors of our group or from future
including primary research, secondary sources and econometric           studies conducted by market research institutes or other               Any information on the intended demerger only reflects the
modelling. We want to point out that part of the market data            independent sources. Information prepared by third parties has         current status and targeted measures / structure, all of which
used has been collected in the framework of a market survey             not been independently verified by us or any other party.              may be subject to changes in the course of the future process.
carried out as a panel observation. The panel is a regular survey
monitoring sales of specific products and product categories,           Therefore you acknowledge that the market data presented is
using a range of distribution channels including internet, retail       based on statistical methods and extrapolation and so due to the
outlets (e.g. high street, mail order) and companies (e.g.              nature of such data no guarantee for completeness and accuracy
resellers). The market data does not represent actual sales figures     can be given by us or any third party. Neither we nor any third
globally or in any given country; rather, the market data               party, including those third parties whose data is cited in this
represents a statistical projection of sales in a given territory and   presentation, warrant that the data collected, processed and
is subject to the limitations of statistical error and adjustments at   analyzed by it in accordance with the rules and methods of
any time (e.g. reworks, changes in panel structure). The                market and social research, will be able to be used by in a specific
representativeness of the market data may be impacted by                way, in particular not in the legal sense of an expert report. It
factors such as product categorization, channel distribution and        should be noted that all liability for completeness and correctness
supplier universe identification and statistical sampling and           of the information provided by us or any third party is explicitly
extrapolation methodologies. The market data presented is based         excluded. Under no circumstance shall a third party whose data is
on statistical methods and extrapolation.                               cited in this presentation be liable for damages incurred through
                                                                        or in connection with your or our interpretation of the provided
CECONOMY operates, in part, in industries and channels for              information. Neither we nor any third party shall be responsible
which it is difficult to obtain precise market data. Such market        for any loss or damage arising out of your or our use or reliance
data should therefore be considered with caution and not be             upon the information contained herein, or for actions of and

                                    On-Site Event Ingolstadt                                                                                   Public                            Date: 08.06.2017           // 3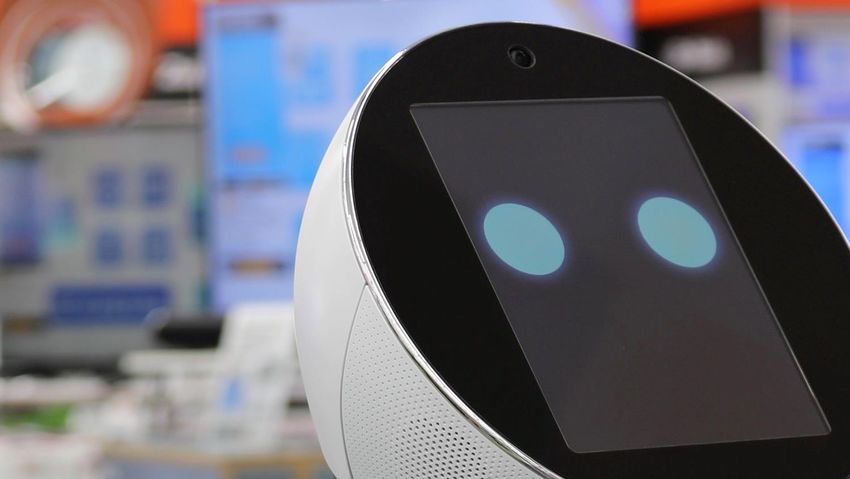
Contents

// Demerger rationale & timing

// Q2 2016/17 update

// Strategic update

// Introduction to store visits

               On-Site Event Ingolstadt   Public   Date: 08.06.2017   // 4
//
Demerger rationale & timing

                              Date: 08.06.2017   // 5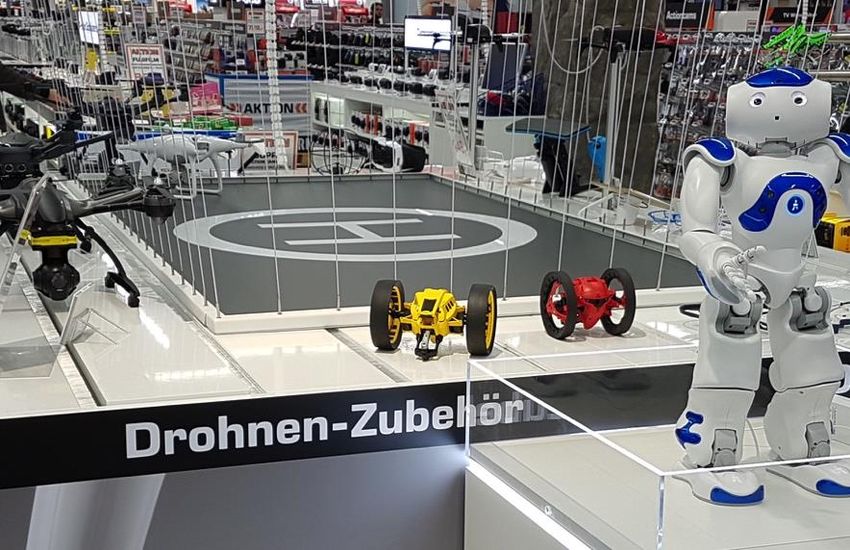
Rationale for creating a pure “Consumer Electronics platform”

                                             ALL FREE CASH FLOW INVESTED IN
     INDEPENDENCE                            CECONOMY

                                             FULL MANAGEMENT FOCUS ON
     FOCUS                                   CREATING VALUE FOR CECONOMY

                                             FULL TRANSPARENCY AND
     SIMPLICITY                              VISIBILITY

             On-Site Event Ingolstadt             Public         Date: 08.06.2017   // 6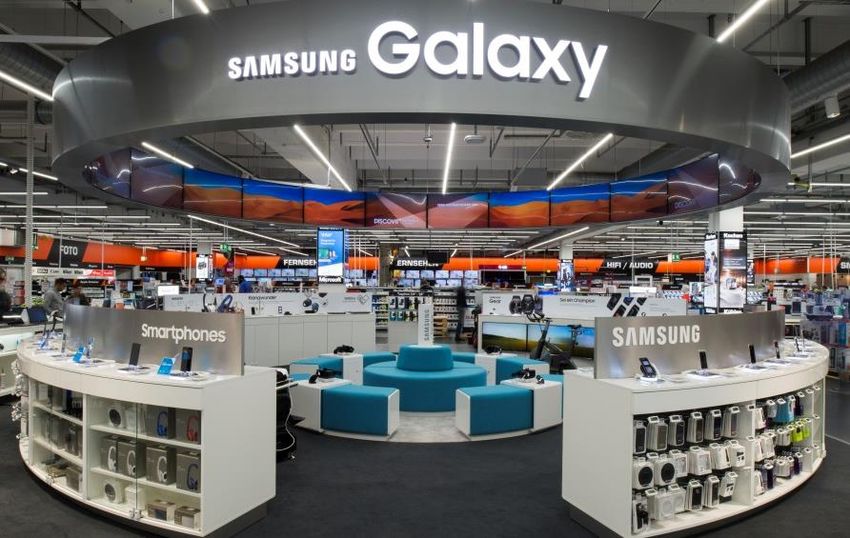
CECONOMY is ready for independence, having completed a significant
part of the change process in Consumer Electronics

                                      RATIONALISATION

                                          DIGITALISATION

                                              CONSOLIDATION

                                                  TRANSFORMATION

           On-Site Event Ingolstadt                        Public   Date: 08.06.2017   // 7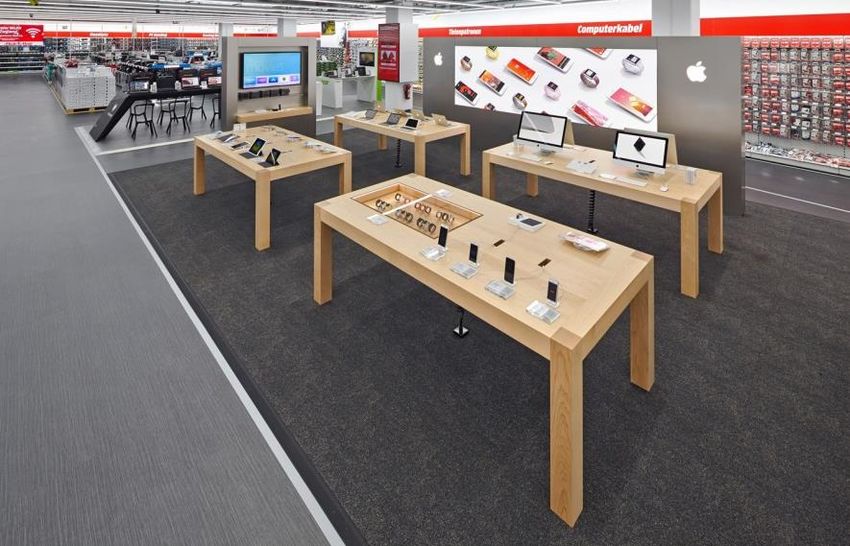
//
Q2 2016/17 update

                    Date: 08.06.2017   // 8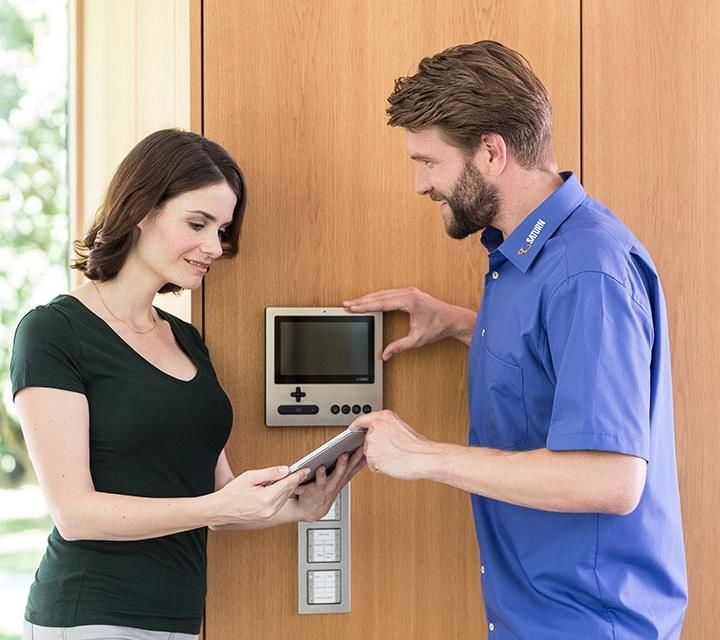
Q2 summary

                                    POSITIVE SALES TREND

                                    GROWTH DRIVEN ESPECIALLY BY
                                    STRONG ONLINE SALES

                                    EBIT LOWER DUE TO INVESTMENTS TO FURTHER
                                    STRENGTHEN MARKET POSITION

                                    CECONOMY GUIDANCE: SALES AND EBIT
                                    HIGHER THAN PY

         On-Site Event Ingolstadt                                 Public       Date: 08.06.2017   // 9
Q2 2016/17 Update – Total and lfl sales growth

Total Sales Development (in %, excl. redcoon)                             _Slightly higher total and lfl sales in Q2 16/16
    3.4%                                                                   (total: +0.7, lfl: +0.5%, both excl. redcoon)
                  3.1%

                                                                          _Strong growth especially in Germany and Turkey
                                                     0.7%       0.7%
                                                                          _Negative developments in mainly Italy and Russia
                                    -0.1%
  Q2 15/16      Q3 15/16          Q4 15/16          Q1 16/17   Q2 16/17   _Market share gains in 10 out of 15 countries (excl. redcoon)

Lfl Sales Development (in %, excl. redcoon)                               _Further rise in total market share to new all-time high over
                  2.8%                                                     the past 6 months
    2.2%

                                                     0.2%       0.5%

                                    -1.1%                                            POSITIVE SALES TREND
  Q2 15/16      Q3 15/16          Q4 15/16          Q1 16/17   Q2 16/17

                         On-Site Event Ingolstadt                                               Public                   Date: 08.06.2017   // 10
Q2 2016/17 Update – Online and services & solutions
Online Generated Sales (in € million & total sales share) _Unbroken strong sales momentum of the online business
10.5% 11.6%
9.1% 9.3% 9.3%
727 _Online sales of MediaMarkt and Saturn grew more than
611 40% helped by seamless pick-up option
478 435 466
_Online share approaching 12% of total sales
Q2 15/16 Q3 15/16 Q4 15/16 Q1 16/17 Q2 16/17 _Services & solutions sales increased by 4% yoy excl. RTS
Services & Solutions Sales (in € million & total sales share) _Service “smart bars” already implemented in 510 stores
6.4% 6.8% 5.6% 5.2%
5.0% 385
340
299 271
261
…UNDERLINES COMPELLING
MULTI-CHANNEL AND SERVICES
Q2 15/16* Q3 15/16 Q4 15/16 Q1 16/17 Q2 16/17* & SOLUTIONS OFFER
* Excluding RTS due to first-time consolidation in Q2 15/16
On-Site Event Ingolstadt Public Date: 08.06.2017 // 11Q2 2016/17 Update – EBIT & EBITDA
EBIT before special items (Delta vs. PY, in € million) _EBIT negatively impacted by
+46
_high comparison base
+4
_measures to further strengthen market position
_one-time negative impact in the Netherlands
-57 -53
_focused spend in IT and CRM
FY 15/16 Q1 16/17 Q2 16/17 H1 16/17
_start-up investments in Retail Media Group
EBITDA before special items (Delta vs. PY, in € million) _build-up of holding structures on CECONOMY level
+56
+5
-56 -51 EBIT LOWER THAN PY
FY 15/16 Q1 16/17 Q2 16/17 H1 16/17
On-Site Event Ingolstadt Public Date: 08.06.2017 // 12FY 2016/17 outlook for CECONOMY
Guidance FY 2016/17 _Positive lfl sales growth expected
_CECONOMY EBIT before special items (EBIT for continued
operations) to be slightly better than PY’s level of €466
Lfl sales growth >0% million1,2
_Increased contributions from our suppliers
_Improvement in Redcoon-related losses
_Continued turnaround of Turkish operations
EBIT before special items:
_First results of restructuring efforts in Russia and
EUR >466m1 Sweden
_Tight cost control measures in place and executed
_Investments to go back to levels of EUR 300-350m
Investments: EUR 300-350m compared to EUR 406m in FY 2015/162
CECONOMY GUIDANCE: SALES
AND EBIT HIGHER THAN PY
1 Based on constant foreign exchange rates. 2 As per Combined Financial information for CE Group and related supplementary information.
On-Site Event Ingolstadt Public Date: 08.06.2017 // 13//
Strategic update
Date: 08.06.2017 // 14The business model is transforming… CECONOMY is now positioning itself
as a “CE customer community”
1 .
CATEGORY KILLER CE CUSTOMER
COMMUNITY
Phase 1 Phase 2 Phase 3 Phase 4
ELECTRONICS MULTI-CHANNEL
RETAILER RETAILER
On-Site Event Ingolstadt Public Date: 08.06.2017 // 15Key value drivers and enablers
#1 #2 #3 #4
#4 #5 Category
Value
Online, Services & Customer Selective
driver
Management
Mobile, Solutions Data / CRM expansion / Pricing
Multi-channel new formats Supply Chain
UPDATE UPDATE UPDATE UPDATE
Redefine central vs. decentral
Enabler
#6 #7 #8 Net #9 People #10 Digital &
Portfolio Competitive trans- technology
Working
Cost Base Capital formation leadership
UPDATE
On-Site Event Ingolstadt Public Date: 08.06.2017 // 16Multi-channel is the winning model
Where do German consumers buy CE products? _Total online sales of more than EUR 2.2 billion LTM
Revenue share in Germany (in %)
_Around 300,000 SKUs online, further expansion of online
5% 6% 7% assortment ongoing
8% 10% 11%
_Wide range of delivery services, including express and same-
day delivery
16% 17% 17%
17% 17% _Unmatched pick-up option (> 40% of online orders)
17%
_Product in-store availability can be checked online
_More responsive website increasing conversion
78% 77% 76% 74% 73%
72%
2011 2012 2013 2014 2015 2016 CECONOMY has become one of
Online business of brick&mortar retailers the largest CE online/mobile
Online Pure Player players in Europe and still
Brick&mortar shops - convenience & specialised (w/o online business) headroom to grow online
Source: GFK Handelspanel.
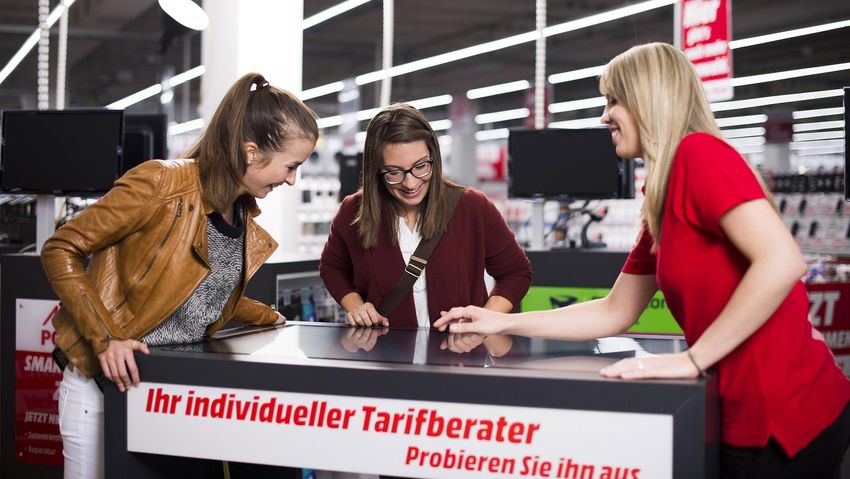
On-Site Event Ingolstadt Public Date: 08.06.2017 // 17Focus on services & solutions to meet increasing consumer demand
_Smart bars offering instant mobile repair services like
screen repairs, battery replacement, personalisation of
Roll-out of smart bars products and data transfer
_Rolled out to 510 stores across Europe
_Acquired majority stake in ZES Goes (NL) specialised in
optimizing service processes, complementing in-store
Acquisition of ZES Goes service offering with the necessary software & processes
_ZES processes already integrated in MediaMarkt NL
value chain; roll out to all countries planned
RELENTLESS FOCUS ON STRENGTHENING SERVICE VALUE PROPOSITION,
IN STORE, REMOTE & AT THE HOMES OF OUR CUSTOMERS
On-Site Event Ingolstadt Public Date: 08.06.2017 // 18In-depth customer knowledge as the basis for the monetisation of our
customer base
MediaMarkt Club Germany (in m) 29% Store restructuring
Revenue & focused expansionAll local loyalty
penetration
Germany programs (in m)
2.30 25% >12
1.78
Mar ’17 Mar ’17
0.81
Just fully rolled out to
0.24 all SATURN stores
across Germany
Feb ’16 Jun ’16 Dec ’16 Mar ’17
CONTINUOUS RISE IN NUMBER OF MEMBERS, GAINING DEEPER
KNOWLEDGE OF OUR CUSTOMERS
On-Site Event Ingolstadt Public Date: 08.06.2017 // 19Selective expansion of CECONOMY’s store network also remains a key
growth driver
Number of stores Q1 16/17 _Selective expansion with 20 openings in H1 16/17
20 -9 Q2 16/17 (average sizeRecap CMD: Significant potential to increase margins by either improving
or exiting “question-mark” countries
Core Peers (Listed) CECONOMY
EBITDA Margin12 (LTM) EBITDA Margin2 (2015/16)
6.2% 5.4%
5.7% direction 5%
+5%p 4.3%
3.3%
3.9%
-1.6%
Lowest 5 Group Best 5 Mid-term Best country
countries countries ambition
PEER LTM MARGINS RANGE EBITDA MARGIN TO IMPROVE
FROM 3.9-6.2% TOWARDS 5%
1 Company filings for LTM data as of Nov. 2016, numbers calendarised to September year end. 2 EBITDA before special items. Note: Darty part of FNAC.
On-Site Event Ingolstadt Public Date: 08.06.2017 // 21Restructuring of redcoon almost completed
_Discontinuation of selected unprofitable wholesale
businesses
Country Exits
_Decision taken to close redcoon operations in Austria,
Spain, Portugal, Benelux
_redcoon Germany & Poland continue operations
Full integration _Full integration of redcoon Germany into the
MediaMarkt Germany organisation
_Leveraging redcoon logistics for Saturn online business
BENEFITS OF RESTRUCTURING MEASURES EXPECTED BY YEAR-END
On-Site Event Ingolstadt Public Date: 08.06.2017 // 22Country portfolio measures to improve earnings initiated
_Full scope restructuring program to reach break-even
initiated
Russia _Continued roll-out of shop-in-shop concept with
METRO Cash & Carry
_Positive results of ongoing operational and
restructuring efforts expected
Sweden _All strategic options remain under review
_Internal business turnaround remains well on track
Turkey _Major improvement in the past 2 quarters
_Full implementation of centralised category
management and pricing
FIRST RESULTS OF THESE EFFORTS EXPECTED BY YEAR-END
On-Site Event Ingolstadt Public Date: 08.06.2017 // 23//
Introduction to store visits
Date: 08.06.2017 // 24Two of Europe’s most modern, fully multi-channel and digitally enabled
electronic retail stores
MEDIA MARKT Ingolstadt
// ~3.500 sqm
// EUR c. 35m sales
// Highlights: Drive-in area, MediaMarkt club info point,
smartphone repair service, e-bike area
SATURN Ingolstadt
// ~4.200 sqm
// EUR c. 34m sales
// Highlights: Service smart bar, 24/7 pick-up station,
Galaxy World, drone flight area
On-Site Event Ingolstadt Public Date: 08.06.2017 // 25Date: 08.06.2017 // 26
MEDIAMARKT INGOLSTADT
Factsheet, 08 June 2017
Snapshot

Market Data                                          Operational KPIs                                    Managing Directors
MediaMarkt Ingolstadt                                2016
›   Opening date                        June 1982     ›   Turnover                             ~35 m€    › Wolfgang Bachesz
                                                      ›   Space productivity          ~9,900 € per sqm
›   Last modernisation             September 2014                                                        › Josef Heinl
                                                      ›   Conversion rate                          41%
›   Sales area                         ~3,500 sqm     ›   Online pick-up rate (nat. avg.)          46%
›   FTEs                                        76    ›   Department share (top 6):
›   Market Share (10km Catchment area)        17%         White goods ~19%, computer hardware ~14%,
                                                          TV ~13%, accessories ~12%, GSM ~11, SDA ~8%

                                                                                                                              2
Store plan
1. Information
2. Smartphone instant repair
3. Service centre
(e. g. online pick-up, financial service)
4. Check out area
5. E-bikes
6. Photo
7. Accessories
8. Smartphones
9. Entertainment
10. Household appliances
11. Small domestic appliances (SDA)
12. IT hardware
13. Hi-fi
14. TV
15. White goods
3SATURN INGOLSTADT Factsheet, 08 June 2017
Snapshot

Market Data                                           Operational KPIs                                    Managing Directors
Saturn Ingolstadt                                     2016                                                Dirk Huffert Gertraud Haslauer
›   Opening date                       October 1999    ›   Turnover                             ~34 m€
                                                       ›   Space productivity          ~8,100 € per sqm
›   Last modernisation                 October 2016
                                                       ›   Conversion rate                          40%
›   Sales area                          ~4,200 sqm     ›   Online pick-up rate (nat. avg.)        ~35%
›   FTEs                                         81    ›   Department share (top 6):
›   Market Share (10km Catchment area)         17%         Computer hardware ~15%, white goods~14%,
                                                           accessories ~14%, GSM ~13%, TV ~13%, SDA ~9%

                                                                                                                                           5
Store plan
1. Lounge
2. Information and service centre
(e. g. online pick-up, instant service, financial service)
3. Check out area
4. Entertainment
5. Gaming incl. VR
6. Accessories
7. Innovation area
8. Smartphone accessories
9. Smartphones incl. Galaxy World
10. IT Hardware
11. Photo incl. drone flight area
12. TV
13. Hi-fi
14. Smart home
15. Small domestic appliances (SDA)
16. White goods
6Recommended store tour
Orientation
1. Orientation / ESL / Robotics
Experience
First-class
service
5 2. Service / personalisation
Experience
3. Samsung Galaxy World
3
4
Experience
End
2 4. Gaming / VR area
1 Experience
5. Drone flight area
7Highlights – Deep dive
Orientation
Electronic Shelf Labels (ESL) PVC floor & LED lightning Imagery on three lines
› The ESL rollout to all the stores and thus › All core format stores are continuoulsy › It is an emotional and also visual tool to
enabling to fully align on- & offline pricing upgraded and remodeled. guide the customer through the product
in any given moment. › This includes: new LED lighting, flooring, categories.
› Rollout finished in 2016. new corporation design, digital shelf › Therefore, we implement a system with
labels, digitalization @ POS, etc. three different zoom levels: people
interacting with products, products in the
limelight and details of products.
8Highlights – Deep dive
Experience
Robotics Virtual reality / Galaxy World Drone flight area
› Paul is a mobile service robot who can › New technologies & innovations are at › Drones are a growing market segment
navigate customers to a specific the core of the Saturn brand with the aim and should be presented accordingly.
department and / or product and provide to inspire customers. › An example of a presentation with its
information › Test phase for the presentation in terms main focus on customer experience.
› Nao is an interactive humanoid robot that of customer experience, improvement › A place to try products in an extraordinary
can be used for welcoming, executing and roll-out. way and have a playful time.
satisfaction surveys, promote products › Cooperation with suppliers to present
and entertain customers. exclusive / high-end products.
9Highlights – Deep dive
First-class service
Standard services “Sofort-Service” / instant service 24/7 pick-up station
› Companion for the customer throughout the › Services as an increasingly important › 24/7 pick-up lockers make orders
customer journey: pre-buy, set-up, use & profit pool for MediaMarktSaturn. available independently from opening
repair.
› Instant services with focus on hours as an extension to delivery and
› Saturn offers a wide range of services, from pick-up in store services.
(express) delivery and installation up to smartphones, tablets and notebooks.
repairs. › Product personalization as an additional › Cooperation with shipping companies are
› 3rd party services as add-ons to core service. in being evaluated.
products (energy & connectivity contracts,
digital content) › Roll-out in progress.
1011
You can also read