NYISO Grid in Transition Study
←
→
Page content transcription
If your browser does not render page correctly, please read the page content below

NYISO Grid in Transition
                Study
                DETAILED ASSUMPTIONS AND MODELING
                DESCRIPTION

                PRESENTED TO
                NYISO ICAP/MIWG/PRLWG
                STAKEHOLDERS

                PRESENTED BY
                Roger Lueken
                Samuel A. Newell
                Jurgen Weiss
                Jill Moraski
                Stephanie Ross
                March 30, 2020

Copyright © 2020 The Brattle Group, Inc.
Disclaimer

Thi s re po rt w as pre pare d by The B rattl e Group for NYIS O’s e x cl usi ve use ; i t doe s not re pre se nt
i nve stme nt advi ce , and t he re are no thi rd pa rty be ne fi ci ari e s. The Br attl e G roup doe s not ac ce pt
any l i abi l i ty for any l os se s s uffe re d, whe the r di re c t or con se que nti al , i n re spe ct of the conte nts of
thi s re port or any a cti ons t ake n o r de ci si ons made as a con se que nce the re of. If you are not N YISO,
or a re ci pi e nt au thori ze d by N YISO and The Br attl e Gr oup to a c ce ss thi s re por t, your re vi e w sh al l be
on a non-re l i ance basi s onl y.

The anal yse s and m arke t ove rvi e w pre se nte d he re i n are ne ce ss ari l y b ase d on assu mpti ons wi th
re spe ct to c ondi ti ons whi ch may e x i st o r e ve nts whi ch m ay oc cur i n the future . Pl e ase app re ci ate
that ac tual futu re re sul ts may di ffe r, pe rhaps m ate ri al l y, from those i ndi c ate d. It i s al so i mport ant
to a cknowl e dge tha t the me th odol ogi e s use d t o de vi se The B rattl e Group’s an al yse s and marke t
ove rvi e w si mpl i fy and may not ac cur ate l y re fl e ct the re l ati ons hi p be twe e n assu mpti ons and
outcome s. The Brattl e G roup doe s not m ake , no r i nte nds t o make , n or shoul d N YISO or any o the r
party i n re ce i pt of thi s re port i nfe r, any re pre se ntati on wi th re spe ct t o the l i ke l i hood of any future
outcome . The anal yse s and m arke t ove rvi e w are v al i d onl y for the e x pl i ci t purp ose for whi ch the y
we re pre pare d and as of the d ate of thi s re por t. Any de ci si ons m ade i n conne cti on wi th thi s re po rt
or the subje ct m atte r he re of, o r use of any i nform ati on contai ne d i n thi s re p ort, are the sol e
re sponsi bi l i ty of the re ade r.

                                                                                                                      brattle.com | 2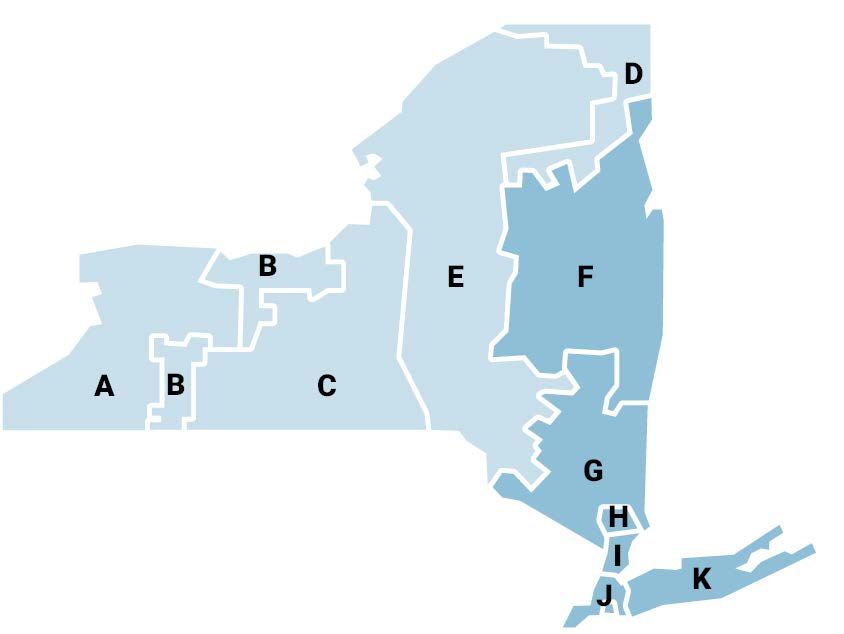
Introduction
                  Agenda

                  –         Introduction

                  –         Regulations, Policies, and Market Design Assumptions

                  –         Supply Assumptions

                  –         Demand Assumptions

                  –         Transmission Assumptions

                  –         Modeling Approaches

                                                                           brattle.com | 3
See Disclaimer on Slide 2
Introduction
                  Project purpose and scope

                 NYISO has retained Brattle to develop simulations of NYISO
                 markets through 2040 to inform the Grid in Transition effort.

                     –      New York has established aggressive clean energy and decarbonization mandates,
                            codified in the Climate Leadership and Community Protection Act (CLCPA).
                     –      NYISO’s Grid in Transition effort seeks to understand the reliability and market
                            implications of the State’s plans to transition to clean energy sources.
                     –      NYISO has retained Brattle to simulate NYISO market operations and investment
                            through 2040 to inform NYISO staff and stakeholders on market evolution.

                   Study design makes several simplifying assumptions, such as:
                     –      Zonal, “pipe and bubble” transmission topology
                     –      Stylized representation of generators
                            • Aggregated generators by zones and types
                            • Economic additions and retirements in continuous increments, not “lumpy”
                     –      Implementing current market rules and policies.

                                                                                                               brattle.com | 4
See Disclaimer on Slide 2
Introduction
                  Project key questions to address

                     – How many and what types of renewable resources and storage will be
                            needed to achieve the CLCPA standards?

                     – What types of flexible resources and storage will be needed to match
                            variable renewable output and load?

                     – What is the future of current New York generation (e.g., nuclear and gas)?
                     – How might electrification affect market operations and investments?
                     – What is the role of a flexible and market-engaged demand side?

                                                                                              brattle.com | 5
See Disclaimer on Slide 2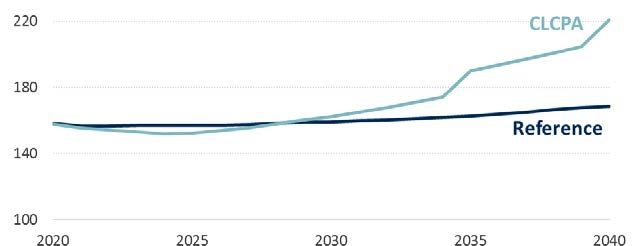
Introduction
                  Purpose of this presentation

                 This presentation is a continuation of the March 6 MIWG
                 Presentation and describes the key assumptions and modeling
                 decisions to be used in the Grid in Transition Study

                     – Modeling the New York power system through 2040 requires informed assumptions
                            regarding regulations, market design, supply, demand, and transmission

                     – This presentation outlines the initial assumptions         Brattle has developed in
                            conjunction with NYISO

                     – The presentation also outlines initial proposals for key modeling decisions, including:
                            • How to select and weigh representative days
                            • How to determine the UCAP value of wind, solar, and storage at high deployment levels
                            • How to model new supply technologies such as flexible load and renewable natural gas

                            We are requesting stakeholder feedback on these
                                  assumptions and modeling decisions
                                                                                                             brattle.com | 6
See Disclaimer on Slide 2
Introduction to GridSIM
GridSIM model framework
Inputs GridSIM Outputs
Supply Optimization Annual Investments
Existing resources
Fuel prices
Engine and Retirements
Investment/fixed costs
Variable costs Objective Function Hourly Operations
Demand Minimize NPV of Investment &
Operational Costs
Representative day hourly System and
demand
Capacity needs Customer Costs
Transmission Constraints Supplier Revenues
Zonal limits Market Design and Co-Optimized
Intertie limits Operations
• Capacity Emissions and Clean
Regulations, Policies, • Energy Energy Additions
Market Design • Ancillary Services
Regulatory & Policy Constraints
Capacity market
Carbon pricing
Resource Operational Constraints Market Prices
Transmission Constraints
Procurement mandates
brattle.com | 7
See Disclaimer on Slide 2Regulations, Policies, and
Market Design Assumptions
brattle.com | 8
See Disclaimer on Slide 2Regulations, Policies, and Market Design Assumptions
Modeled clean energy policies
Description of Key Policies Policy Timeline
• Renewable generation: 70% of NY annual electricity
supplied from renewables (solar, wind, hydro) by 2030 2009 RGGI: First control period
• 100% zero emissions by 2040
• Solar: 6,000 MW distributed solar by 2025
CLCPA
• Offshore wind: 9,000 MW by 2035 2016 ZEC: Program in effect
• Storage: 3,000 MW by 2030
• Economy-wide emissions: 85% reduction by 2050 and 40%
reduction by 2030 from 1990 levels Solar: 6,000 MW mandate
2025
NOX Rule: In full effect
• Northeast regional cap-and-trade program
RGGI
• Avg. 2019 price: $5.4/ton; expected to reach $12.6 by 2030
2029 ZEC: Program expires
• Zero emission credit payments to New York nuclear plants CLCPA: 70% renewable electricity
ZEC Program 2030
• Program expires March 2029 Storage: 3,000 MW mandate
• DEC rule to reduce NOX emissions from peakers 2035 OSW: 9,000 MW mandate
DEC NOX rule • Peakers built pre-1986 will most likely retire instead of
retrofit to meet emissions requirements (this assumption 2040 CLCPA: 100% zero emissions
may be refined based on Generators’ compliance plans) electricity
2050 CLCPA: 85% NY economy-wide
Sources and Notes:
RGGI Auction Allowance Price and Volumes Results
decarbonization
New York Public Service Commission Order Adopting a Clean Energy Standard. August 1, 2016
New York DEC Adopted Subpart 227-3
New York Senate Bill S6599 brattle.com | 9
See Disclaimer on Slide 2Regulations, Policies, and Market Design Assumptions
70% Renewable Portfolio Standard
Modeled Annual RPS Requirement
% of Load
Assume RPS target
remains at 70% after 2030
Assume linear growth
between 2020 and
2030 70% target
Eligible renewable technologies:
– Wind (onshore & offshore)
– Solar (utility scale & BTM)
– Hydro
Sources and Notes:
New York Senate Bill S6599
brattle.com | 10
See Disclaimer on Slide 2Regulations, Policies, and Market Design Assumptions
100% zero emissions mandate
Eligible “zero emissions” generation Modeled Annual Zero Emissions
technologies Requirement
– Renewables % of load
– Nuclear
– Renewable natural gas
Interpretation of mandate: Net annual
carbon emissions must equal zero
– Allows some emissions from NY generators
or imports Assume 70% zero carbon
requirement in 2030,
– But all emissions must be offset ton-for-ton consistent with 70% RPS
by exports that reduce emissions in
neighboring systems
Assume intermediate carbon
reduction targets in 2030-40,
although not specified in the CLCPA
Sources and Notes:
New York Senate Bill S6599
brattle.com | 11
See Disclaimer on Slide 2Regulations, Policies, and Market Design Assumptions
Technology-specific mandates
We model the technology-specific mandates of the CLCPA, with
intermediate targets from multiple sources (more may be
economically built to satisfy other constraints).
Annual Installed Capacity Requirement (MW)
Offshore Wind
3,000 MW by 2023
Distributed Solar
NYSERDA Strategic
1,500 MW by 2025
Outlook 2020-2023
NYISO 2019 Grid in
Transition Report
Energy Storage
2,400 MW by 2030
NYSERDA Strategic
Outlook 2020-2023
Sources and Notes:
New York Senate Bill S6599
Reliability and Market Considerations for a Grid in Transition. NYISO. May 2019
Toward a Clean Energy Future: A Strategic Outlook 2020-2023. NYSERDA.
brattle.com | 12
See Disclaimer on Slide 2Regulations, Policies, and Market Design Assumptions
ICAP market
ICAP market modeled consistent with current design, including nested
capacity zones, sloped demand curves, and summer/winter clearing.
2020 Summer Capacity Demand Curves
Price ($/UCAP MW-yr)
J
K
NYCA
G-J
NYCA
G-J
J K
Sources and Notes:
NYISO ICAP/UCAP Translation of the Demand Curve – Summer 2018 Capability Period
Quantity (UCAP MW)
NYISO ICAP/UCAP Translation of the Demand Curve – Winter 2018-2019 Capability Period brattle.com | 13
See DisclaimerDemand
on Slide 2curve represents modeled 2020 demand curve, derived from 2018 demand curve parameters and adjusted to reflect 2020 demand and resource costsRegulations, Policies, and Market Design Assumptions
Ancillary service requirement
– We model 3 A/S products: 10-min reserves, 30-min reserves, regulation
– We specify separate system-wide and Downstate (EAST/SENY) requirements
– Quantities and shortage pricing consistent with NYISO guidance
Simplified Reserve Zones Model Reserve Assumptions
NYCA EAST/SENY (G-K)
Shortage Shortage
East/SENY Quantity Price Quantity Price
Product (MW) ($/MWh) (MW) ($/MWh)
10-Minute
NYCA Reserves 1,310 $750 1,200 $775
30-Minute
Reserves 1,310 $750 100 $500
Regulation 225 $775 N/A N/A
Sources and Notes:
30 minute reserve requirement reflects incremental requirement from 10
minute reserves. Reserve requirements derived from below sources and
discussions with NYISO:
NYISO Locational Reserve Requirements
Establishing Zone J Operating Reserves. NYISO. January 2019.
brattle.com | 14
See Disclaimer on Slide 2Supply Assumptions
brattle.com | 15
See Disclaimer on Slide 2Supply Assumptions
Existing supply resources
We model all existing generators in New York, consistent
with the 2019 Gold Book and other sources of data.
2018 Installed Capacity
– 2019 Gold Book primary source of MW
generator data 50,000
– Most generators aggregated by zone and 40,000
Wind
Hydro &
type (e.g., gas CC & CT, nuclear, OSW) pumped storage
Capacity Imports
30,000
– Subset of generators modeled Bio
independently due to unique 20,000
characteristics
Gas
– Generator characteristics (e.g., heat rate, 10,000 Oil
Coal
VOM) developed w/ NYISO input
Nuclear
brattle.com | 16
See Disclaimer on Slide 2Supply Assumptions
Planned builds and retirements
We model all planned additions and retirements Cumulative Planned Capacity
Changes 2020-2030
of generators including:
Change in Capacity (MW)
– Downstate peaker (gas CT and oil/kerosene)
NOx rule retirements (2025):
• Downstate peakers built before 1986 retire Gas
• All frame units built after 1986 retire
• Aero-derivative units built after 1986 may choose Coal
to economically retrofit
• These assumptions may be refined based on Oil
Generators’ compliance plans
– Indian Point nuclear retirement (2020-21) Nuclear
– Remaining coal retirements (2020)
– Planned gas build is Cricket Valley (2020)
Sources and Notes:
ABB Velocity Suite. NOx retirement assumptions derived from NYDEC NOx Revised Regulatory Impact Statement Summary and conversations with NYISO
NYISO Grid in Transition Report. 2019
brattle.com | 17
See Disclaimer on Slide 2Supply Assumptions
Fuel price assumptions
Gas Price Forecasts Oil Price Forecasts
2019$/MMBtu 2019$/MMBtu
Iroquois Zone 2 (Zones F-I Existing Units) FO2
Zone K
Zone J TETCO M3 (Zones F-I New Units)
Zone A-E
FO6
Sources and Notes:
Gas price forecast based on blend of NYMEX futures and EIA growth rates
Oil prices based on 2019 NYMEX futures; taken from ABB Velocity Suite
brattle.com | 18
See Disclaimer on Slide 2Supply Assumptions
New resources
Supply Resource Description
• Combined cycles (CCs) and simple-cycle combustion turbines (CTs)
Gas-fired
• Can burn natural gas or more expensive, zero emissions renewable natural
generators gas
• Model battery storage with two-hour and four-hour durations
• Long-duration storage (e.g., flow batteries or thermal) may be considered in
Storage a 1-off “representative week” sensitivity
• Seasonal storage (e.g., via HQ) not considered, other than via RNG
Small modular • Model as producing zero emissions (but not renewable) energy
nuclear
• Model controllable EV charging and HVAC loads
• Amount of participation assumed (not endogenously determined)
Load flexibility
• Modeling flexibility over 24-hour period. 1-off “representative week”
sensitivity may test if value increases over a longer horizon
Renewable • Assume supply from interstate pipelines at a price of $20-$30/MMBtu
natural gas (RNG) • Model potential in-state RNG production from excess renewable energy
brattle.com | 19
See Disclaimer on Slide 2Supply Assumptions
New generators and storage
– Natural gas generators can be fueled with 2019 Upstate Annual cost decline
installed cost rate (real)
zero carbon renewable natural gas $/kW 2020 – 2040
– Offshore wind connected to either zone J or K Natural Gas
– Utility-scale PV and onshore wind cannot be Combined cycle $1,800 -1%
built in zones J or K Combustion turbine $900 -1%
Battery Storage
– Sources of installed cost: 2 hour duration $700 -4%
• Natural gas: 2019 costs from DCR, cost decline
4 hour duration $1,400 -4%
rate from 2019 NREL ATB
Solar PV
• Wind, solar, storage: 2019 costs and cost decline
rate from 2019 NREL ATB Utility scale $1,100 -2%
• Small Modular Nuclear: 2019 costs from EIA Behind the meter $2,700 -5%
– Downstate costs higher, per EIA and DCR Wind
Offshore $4,500 -3%
– Detailed assumptions in appendix (technical
Onshore $1,700 -2%
parameters, variable and fixed costs)
Small Modular Nuclear $6,200 -1%
Sources and Notes:
Includes interconnection and network upgrade costs. NREL 2019 ATB, NYISO DCR Model 2019-2020
EIA Capital Cost and Performance Characteristic Estimates for Utility Scale Electric Power Generating Technologies, 2020
brattle.com | 20
See Disclaimer on Slide 2Supply Assumptions
New generators and storage costs over time
Investment Cost (2019$/kW)
SMR
Offshore Wind
Gas CC
Solar BTM
Onshore Wind
Solar
Gas CT
Storage (4hr)
Storage (2hr)
Sources and Notes:
NREL 2019 ATB
NYISO DCR Model 2019-2020
EIA Capital Cost and Performance Characteristic Estimates for Utility Scale Electric Power Generating Technologies, 2020 ‘
Costs do not include network upgrades or interconnection costs, with the exception of offshore wind brattle.com | 21
See Disclaimer on Slide 2Demand Assumptions
brattle.com | 22
See Disclaimer on Slide 2Demand Assumptions
Load forecasts
We will model two load growth cases, per Climate Change Phase I study.
– Reference Case: Gold Book assumptions plus 0.7 oF warming per decade
– CLCPA Case: Aggressive electrification and energy efficiency
Gross Load Forecast Components of 2040 Gross Load
Annual Peak (GW) Annual Energy (TWh)
Reference
CLCPA Case
Case
Base load (excluding
156 175
energy efficiency)
EV adoption 13 16
Annual Energy (TWh) Additional
-- 76
electrification
Energy efficiency -- -46
Total 2040 gross load 169 221
Sources and Notes:
Load forecasts from Climate Change and Resilience Study - Phase I, ICAP WG December 17, 2019. brattle.com | 23
See Disclaimer on Slide 2 Gross load forecasts exclude BTM solar generation.Demand Assumptions
Load shapes
Electrification and climate change are forecast to affect load shapes.
Hourly Load (MW)
NY becomes winter peaking
due to heating electrification
Summer peaks rise with
electrification and climate change
Increased daily load variation
due in part to EV charging
2040
CLCPA
2020
CLCPA
Sources and Notes:
brattle.com | 24
See Disclaimer on Slide 2 Load forecasts from Climate Change and Resilience Study - Phase I, ICAP WG December 17, 2019.Transmission Assumptions
brattle.com | 25
See Disclaimer on Slide 2Transmission Assumptions
Transmission topology
In conjunction with NYISO, Brattle developed a 5-zone
“pipe-and-bubble” representation of the New York grid.
F 50% NE-NY
3600 ISO
HQ Central Capital- -NE
East HUDV
4600 Group 2
3600 5500 6500
50% NE-NY
5500
Group 1 4600
ON A-E M arcy South
GHI CSC & 1385 We are considering a one-
Northport
1900 1900 30 off sensitivity on benefits
of increased transmission.
2000 Y49/Y50
Sprain Brook-
32% PJM -NY 68% PJM -NY Dunw oode South Group 3
Interface 3900 0 1200
Interface Group HTP & VFT J
300/300 Limits 300 900
Jamaica K
Neptune Ties (J-K) 0
PJM
Off Shore
Wind brattle.com | 26
See Disclaimer on Slide 2Transmission Assumptions
Imports and exports
We model New York interties consistent with historical flows, but
reflect some ability of neighboring systems to help balance NY
renewable generation.
Treatment of New York Interties
Hydro Quebec modeled as flexible
– Reflects HQ’s hydro storage potential F
50% NE-NY ISO
-NE
– In all hours, allow flows up to line limit
HQ 50% NE-NY
(1500 MW import, 1000 MW export)
CSC & 1385
Others modeled as less flexible GHI Northport
– Reflects similar balancing challenges in ON A-E 68%
PJM-NY
neighboring systems
– Lock hourly exports at 2018 levels 32%
– Hourly imports allowed to flex between PJM-NY
J K
zero and 2018 levels (e.g. model can HTP
& VFT
reduce imports if uneconomic) PJM
Neptune
Off Shore
Wind
brattle.com | 27
See Disclaimer on Slide 2Modeling Approaches
brattle.com | 28
See Disclaimer on Slide 2Modeling Approaches
Selection of representative days for 2022
We select and weight representative days for each year to
reflect NYISO’s forecasted hourly net demand. Here we show
2022 as an example.
Representative Days in 2022
Identify 10 days to represent a year’s variety of conditions CLCPA Load Forecast
– 10 stand-alone days can effectively represent a full year if
Day Weight
selected and weighted carefully
Jul 20 1 Summer
– We validate the representative days by comparing the resulting peak days
net load duration curve to that of the 8760-hours forecast Jul 8 10
5 Extreme
Jan 13 1
– Modeling stand-alone days increases computational efficiency Days Winter
peak days
and flexibility Feb 10 10
Minimum
– Sequential days may be considered in a sensitivity analysis Apr 24 1
load day
Jul 28 39
Selection process
Mar 3 78
– Days selected based on net load to ensure extreme conditions 5 General Oct 1 51
are captured (e.g., high load and low renewable generation) Days
Oct 13 90
– Pre-select summer peak, winter peak, and minimum load days
Dec 21 84
– Remaining days selected and weighted with a k-means
clustering algorithm, which clusters similar days together and
selects best representative
brattle.com | 29
See Disclaimer on Slide 2Modeling Approaches
Representative days across years
Each year, we select and weight new representative days to
capture evolving net load shapes.
Net load duration curves
2020, 2030, 2040
Net Load (GW)
Net load shapes evolve from 2020 to Actual forecast
2040 with electrification and renewables Modeled forecast
2040
growth
Close match between
– Electrification assumptions from NYISO modeled load duration curve
load forecasts and that of actual forecast
– Renewable growth forecast with
2020
preliminary GridSIM runs
2030
This approach enables close
representation of net load in all years Net load lower in 2030 than 2020 due
to CLCPA renewable additions
Hours in Year
brattle.com | 30
See Disclaimer on Slide 2Modeling Approaches
Modeling the declining capacity value of
wind, solar, and storage
We have developed an approach to approximate the marginal
UCAP value of wind, solar, and storage as more are deployed.
High-level approach
1. For the technology in question, vary the amount installed, holding all else equal
2. Assess the capacity value of the last MW added (see next slide)
3. Quantify relationship between penetration and marginal capacity value
4. This relationship is an input into GridSIM
This simplified approach does not replace a full probabilistic effective load
carrying capability (ELCC) study and may overstate capacity value
– Does not account for variability in conditions across many years, like GE MARS
– Does not account for impacts of internal transmission constraints
brattle.com | 31
See Disclaimer on Slide 2Modeling Approaches
Modeling the declining capacity value of
wind, solar, and storage
Supply Resource Concept Methodology
1. Across 8760 hours, identify 20-100 top NYCA net load hours
Generation of new wind and solar
additions is correlated with previously 2. Calculate wind UCAP value as avg. output in those hours
Wind and deployed resources. 3. Repeatedly change the MW of wind installed, holding all
Solar else equal
New resources therefore provide less
Resources marginal capacity value than
4. Each time, find top 100 net load hours and the avg. output
previously added resources. 5. Repeat process for offshore wind and solar; for each one,
hold other variable technologies at likely 2030 levels
Energy storage can change the 1. Across 8760 hours, analyze MW of storage required to
“shape” of peak net load periods, reduce NYCA net peak load by 1 MW
flattening and elongating peak 2. Calculate UCAP value as 1 MW peak reduction / MW
Storage periods. storage required
Resources As more storage is deployed, longer
3. Increase amount of storage assumed, holding all else equal.
Simulate effect of increased storage on net peak load
discharge durations are therefore
required to provide the same capacity 4. Repeat steps 1 – 3 across many storage deployment levels
value. 5. Repeat process for storage of different durations
brattle.com | 32
See Disclaimer on Slide 2Modeling Approaches
Capacity value of wind and solar
Marginal Capacity Value of Solar and Wind
Summer Marginal Capacity Value Winter Marginal Capacity Value
Offshore
Wind
Offshore
Wind
Solar
Onshore
Wind
Onshore Solar
Wind
Installed Capacity (MW) Installed Capacity (MW)
brattle.com | 33
See Disclaimer on Slide 2Modeling Approaches
Capacity value of storage
Marginal Capacity Value of Energy Storage
Marginal Capacity Value
8-hr
6-hr
4-hr
2-hr
1-hr
brattle.com | 34
See Disclaimer on Slide 2Modeling Approaches
Modeling flexible load
– Flexible loads can adjust their consumption in
response to market prices
– We model a subset of electric vehicles and
HVAC systems as flexible Example of Electric Vehicle Flexibility
Load (MW)
– Treatment of flexible loads in GridSIM
• In any hour, loads can flex their consumption
Baseline EV
(increase or decrease) from a baseline level
charging
• Flexibility varies by technology, hour, and season
• Total flex is net-zero on a daily basis Shifted EV
• Unlike battery storage, no efficiency losses charging Decrease
– We will make assumptions regarding:
• Fraction of EV and HVAC load that is flexible
• Degree of flexibility in any given hour Increase
• Reservation price (e.g. expected profits) required
for a load to flex its consumption
Hours in Day
– We will not capture load shifting across days,
except possibly as one-off sensitivity
brattle.com | 35
See Disclaimer on Slide 2Modeling Approaches
Renewable natural gas (RNG)
We consider RNG as a potential future zero emissions
technology.
– In this context, RNG refers to gas created via electrolysis + methanation
• Can also refer to methane from agriculture or landfills
– Producing RNG is a multi-step process
• Electrolysis utilizes grid electricity (likely curtailed renewables) to create hydrogen
• Direct air capture uses electricity and heat to capture CO2 from ambient air
• Methanation combines hydrogen and air-captured CO2 to create methane, or RNG
– Burning RNG emits no net carbon emissions
• Ignoring any release of methane in production and transport, which we will assume
can be controlled to be small
– Increasingly viewed as an important part of future zero-carbon system
brattle.com | 36
See Disclaimer on Slide 2Modeling Approaches
Modeling RNG in GridSIM
We dynamically model RNG supply, production, and consumption.
– Assume RNG supply is available via the interstate Treatment of RNG in GridSIM
gas pipeline system
Modeled dynamically
– Assume some RNG produced in-state by using Renewable in GridSIM
renewable generation that would otherwise be generation
Assumed
curtailed
– Assume all gas-fired plants can consume either In-state RNG Interstate
RNG or natural gas. As carbon constraints tighten, production pipeline supply
plants become willing to burn RNG
– Assume an RNG market price (~$20 - $30/MMBtu), Market Price
informed by the costs of production and with a
buy/sell price spread to account for transmission RNG consumption
and pipeline charges in gas plants
– Will test sensitivities since significant uncertainty
about production cost of RNG
brattle.com | 37
See Disclaimer on Slide 2Stakeholder Input
We are requesting stakeholder feedback on
these assumptions and modeling decisions
We would also like to hear stakeholder interests in the different
sensitivities, including those discussed today:
– 1-off “representative week” sensitivity
• Would capture Long-duration storage (e.g. flow batteries or thermal)
• Would test if value of load flexibility increases over a longer time frame (may
capture load shifting over multiple days)
– One-off sensitivity on benefits of increased transmission
What other sensitivities should we consider?
brattle.com | 38
See Disclaimer on Slide 2Appendix
brattle.com | 39
See Disclaimer on Slide 2Appendix
Detailed generator assumptions
Type New/Existing EFORd Heat Rate Minimum Generation Level Startup Cost Variable O&M Fixed O&M
(%) (MMBTU/MWh) (% of ICAP) $/MW-start ($/MWh) ($/kW-year)
Biogen Existing 5% 9.7 - 10.8 31% $21 $3.00 $111 - $149
Gas CC Existing 6% 6.8 - 7.6 47% $11 - $18 $1.81 $40 - $76
Gas CT Existing 6% 10.6 - 16.2 15% $1 - $2 $5.60 $21 - $51
Gas ST Existing 6% 10.3 - 10.7 31% $24 - $41 $8.50 $66 - $140
Nuclear Existing 15% 10.6 - 10.9 100% $0 $2.41 $0
Oil CT Existing 17% 14.3 - 14.3 15% $12 $5.60 $33 - $52
Oil ST Existing 17% 10.6 - 10.6 31% $90 $8.50 $66
Pumped Storage Existing 4% 0 0% $0 $9.00 $32
Solar Existing 0% 0 0% $0 $0.00 $17
Solar - BTM Existing 0% 0 0% $0 $0.00 $21 - $44
Storage Existing 0% 0 0% $0 $5.00 $23
Wind - Offshore Existing 0% 0 0% $0 $0.00 $0
Wind - Onshore Existing 0% 0 0% $0 $0.00 $43 - $52
Hydro Existing 0% 0 0% $0 $0.00 $30 - $37
Gas CC New 6% 6.8 47% $11 - $18 $1.81 $194 - $367
Gas CT New 6% 10.3 40% $1 - $2 $0.76 $104 - $180
Solar New 0% 0 0% $0 $0.00 $129 - $143
Solar - BTM New 0% 0 0% $0 $0.00 $77 - $321
Storage New 0% 0 0% $0 $5.00 $125 - $326
Wind - Offshore New 0% 0 0% $0 $0.00 $630
Wind - Onshore New 0% 0 0% $0 $0.00 $207
Sources and Notes:
NYISO Grid in Transition Report 2019
NREL 2019 ATB
NREL Power Plant Cycling Costs
Variable O&M Costs for storage and pumped storage resources reflect efficiency losses brattle.com | 40
See Disclaimer on Slide 2Appendix
Gas hub assumptions
We map generators to a blend of hubs, with input from NYISO.
Fuel Blend
Zone Existing/New Dominion Iroquois Iroquois Transco
Dawn TETCO-M3
South Waddington Zone 2 Zone 6
Zone A-E Existing 70% 20% 10% 0% 0% 0%
Zone F Existing 0% 0% 0% 100% 0% 0%
Zone GHI Existing 0% 0% 0% 100% 0% 0%
Zone J Existing 0% 0% 0% 0% 5% 95%
Zone K Existing 0% 0% 0% 65% 0% 35%
Zone A-E New 70% 20% 10% 0% 0% 0%
Zone F New 0% 0% 0% 0% 100% 0%
Zone GHI New 0% 0% 0% 0% 100% 0%
Zone J New 0% 0% 0% 0% 5% 95%
Zone K New 0% 0% 0% 65% 0% 35%
brattle.com | 41
See Disclaimer on Slide 2Presented By
Sam Newell Jurgen Weiss Roger Lueken
Principal, Boston Principal, Boston Senior Associate, Washington, D.C.
+1.617.234.5725 +1.617.234.5739 +1.202.955.5050
Sam.Newell@brattle.com Jurgen.Weiss@brattle.com Roger.Lueken@brattle.com
The views expressed in this presentation are strictly those of the presenter(s) and do not necessarily state or reflect the views of
The Brattle Group, Inc. or its clients.
brattle.com | 42
See Disclaimer on Slide 2About Brattle
The Brattle Group provides consulting and expert testimony
in economics, finance, and regulation to corporations, law
firms, and governments around the world. We aim for the
highest level of client service and quality in our industry.
OUR SERVICES OUR PEOPLE OUR INSIGHTS
Research and Consulting Renowned Experts Thoughtful Analysis
Litigation Support Global Teams Exceptional Quality
Expert Testimony Intellectual Rigor Clear Communication
brattle.com | 43
See Disclaimer on Slide 2Our Offices
BOSTON BRUSSELS CHICAGO LONDON
MADRID NEW YORK ROME SAN FRANCISCO
SYDNEY TORONTO WASHINGTON
brattle.com | 44
See Disclaimer on Slide 2Our Practices and Industries
ENERGY & UTILITIES LITIGATION INDUSTRIES
Competition & Market Accounting Electric Power
Manipulation Analysis of Market Financial Institutions
Distributed Energy Manipulation Infrastructure
Resources Antitrust/Competition Natural Gas & Petroleum
Electric Transmission Bankruptcy & Restructuring Pharmaceuticals
Electricity Market Modeling Big Data & Document Analytics & Medical Devices
& Resource Planning Commercial Damages Telecommunications,
Electrification & Growth Environmental Litigation Internet, and Media
Opportunities & Regulation Transportation
Energy Litigation Intellectual Property Water
Energy Storage International Arbitration
Environmental Policy, Planning International Trade
and Compliance
Labor & Employment
Finance and Ratemaking
Mergers & Acquisitions
Gas/Electric Coordination
Litigation
Market Design Product Liability
Natural Gas & Petroleum Securities & Finance
Nuclear Tax Controversy
Renewable & Alternative & Transfer Pricing
Energy Valuation
White Collar Investigations
& Litigation
brattle.com | 45
See Disclaimer on Slide 2You can also read