International Journal of Chemical Sciences - Trade Science Inc
←
→
Page content transcription
If your browser does not render page correctly, please read the page content below
International Journal of Chemical Sciences
 Research | Vol 19 Iss S1

 New Methodology to Determine the Surface Energy, Specific Interactions
 and Acid-Base Properties of Titanium Dioxide by Inverse Gas
 Chromatography
 Tayssir Hamieh1,2*, Fatima Al-Ali2, Ali Ali-Ahmad2, Khaled Chawraba2, Joumana Toufaily2, Zahraa
 Youssef3, Nabil Tabaja2, Thibault Roques-Carmes4, Jacques Lalevée5,6
 1
 Satie-Ifsttar, Université Gustave Eiffel, Campus de Marne-La-Vallée
 2
 Department of Sciences, Lebanese University, Hadath, Lebanon
 3
 Institut de Chimie des Substances Naturelles, ICSN, CNRS-UPR 2301, Bâtiment 27, Gifsur-Yvette Cedex, France
 4
 Université de Lorraine, Laboratoire Réactions et Génie des Procédés, UMR 7274 CNRS, Nancy, France
 5
 CNRS, IS2M UMR 7361, Université de Haute-Alsace, F-68100 Mulhouse, France
 6
 Department of Sciences, Université de Strasbourg, Strasbourg, France.

 *
 Corresponding author: Tayssir Hamieh, Satie-Ifsttar, Université Gustave Eiffel, Campus de Marne-La-Vallée, E-mail:
 tayssir.hamieh@ul.edu.lb
 Received: February 10, 2021; Accepted: February 24, 2021; Published: March 03, 2021

 Abstract
 Inverse gas chromatography was used to characterize the thermodynamic surface and interfacial properties of
 titanium dioxide catalyst. The dispersive component of the surface energy of TiO2 was determined by using the
 various models of surface areas of n-alkanes. An excellent linear relation correlating the differential enthalpy and
 entropy change of adsorption to the carbon atom number was obtained. A new method to separate the polar and
 non-polar contributions of the enthalpy of adsorption was proposed. The values of polar contributions of differential
 enthalpy of the probes were classified in increasing order: Benzene
[1-3]. In addition, the powder form of TiO2 possesses a hydrophilic character [3,4]. Titania embraces various merits and
 certain optical, electronic and physiochemical properties which makes it convenient for a wide range of applications. TiO2
 is of low cost, available, biologically and chemically inert, stable and corrosion resistant. It is a material of good
 biocompatibility and strong oxidizing power. In addition, it is efficient as an anti-bacterial agent, in the environmental
 purification due to its high photocatalytic activity and in the UV protection [2-6]. It seems very interesting to study the
 physicochemical properties of the Titania catalyst known as Degussa P25. TiO2 P25 has been extensively used thanks to
 its high photocatalytic activity. In fact, it was mentioned that it is not easy to find a photocatalyst of greater photoactivity
 as compared to P25. Based on such information, P25 is described as the ‘de-facto standard titania photocatalyst’ and has
 been commonly employed as a ‘benchmark’ for photocatalysts. It has been also demonstrated that in several reactions, this
 mixed-phase Titania exhibited a higher photoactivity than pure anatase. Many papers have been issued on the
 photocatalytic reactions involving Degussa P25 TiO2 since 1990 [7-9]. We propose in this paper to determine the surface
 properties of commercial Degussa P25 TiO2 particles constituted of 80% anatase and 20% rutile; more particularly, we are
 interested in the determination of specific interactions of adsorption, Lewis acid base and surface energy of this catalyst by
 inverse gas chromatography (IGC) at infinite dilution. Organic model molecules were used in this study such as n-alkanes
 (from n-pentane to n-nonane) and some polar adsorbates such as benzene, chloroform, acetonitrile, nitromethane, ethyl
 acetate, acetone and tetrahydrofuran. These molecules adsorbed on Titania catalyst allow obtaining by IGC the dispersive
 component of the surface energy, specific enthalpy and entropy of adsorption and the acid base constants in Lewis terms
 of TiO2.

 IGC technique, methods and materials
 IGC is the most important technique to characterize the surface properties of solid substrates such as oxides, polymers or
 copolymers in bulk or adsorbed phases IGC. This powerful technique first used by Conder and Young in 1970’s [10-14]
 took an important development after 1980 where many researches were devoted to the physicochemical determination of
 oxides, glass fibers and polymers [15-23].

 Polar molecules and n-alkanes of known properties are injected in the column containing the solid. The retention times of
 these probes, measured at infinite dilution, allow us to determine the interactions between the organic molecules and the
 solid, if we suppose that there are no interactions between the probe molecules themselves. Measurements were carried out
 with a DELSI GC 121 FB Chromatograph equipped with a flame ionization detector of high sensitivity. The retention data
 were obtained with a stainless-steel column of length 20 cm and 2 mm internal diameter packed with 1 g of titania
 powders. The net retention volume Vn was calculated by following the same methodology used in other papers [24-26].
 On the other hand, the method used to obtain specific enthalpy of interaction between a probe and a solid is that developed
 by Saint-Flour and Papirer [17-19] who obtained a straight line when plotting RTlnVn against lnP0 where P0 is the vapour
 pressure of the probes. In the case of polar probes injected into the column, specific interactions of adsorption ∆Gsp can be
 calculated by using this method.

 Polar molecules used to determine the specific interactions with the solid substrates are characterised by their donor (DN)
 and acceptor (AN) numbers [27]. The acidic K A and basic KD constants characterising the solid substrate were calculated
 by using Papirer et al. method [27]. The dispersive component of the surface energy of solids was determined by using
 the well-known relationship of Fowkes [28,29].

 We used another relation proposed by Dorris and Gray [30] for the calculation of of a solid.

 Materials and Solvents

 Titania
 The titania catalyst was obtained from Degussa in powder form. The titania analysed here, had a specific surface area
 obtained by BET method by adsorption of nitrogen on titania, 59 m 2/g.

© 2021 Trade Science Inc. 2
Model organic molecules
 Classical organic molecules, characterized by their donor and acceptor numbers [25,29], were used in this study. Corrected
 acceptor number AN'=AN-ANd, given by Riddle and Fowkes [31] who subtracted the contribution of Van der Waals
 interactions (or dispersion forces), was used in this paper. We used here the values of AN' and AN' of different polar
 molecules adopted by Hamieh et al. [24-26].
 The different solvents used for IGC measurements were chosen for acid, base and amphoteric properties necessary to
 determine the acid-base characteristics of the titanium dioxide. All probes (Aldrich) were highly pure grade (i.e., 99%).
 The probes used were n-alkanes (pentane, hexane, heptane, octane, and nonane); amphoteric solvents: acetonitrile,
 acetone; basic solvents: ethyl acetate, tetrahydrofuran (THF) and acidic solvent: chloroform and nitromethane.

 GC Conditions
 The IGC measurements were performed on a DELSI GC 121 FB chromatograph equipped with a flame ionization
 detector. Dried nitrogen was the carrier gas. The gas flow rate was set at 20 mL/min. The injector and detector
 temperatures were maintained at 200 ºC during the experiments. To achieve infinite dilution, each probe was injected with
 1 µL Hamilton syringes taken from the vapor above the liquid solvent surface and emptied into air, in order to approach
 linear condition gas chromatography, equipped with a split system. In such a way that the interactions between probe
 molecules can be considered to be negligible and only the interactions between the surface of the solid and an isolated
 probe molecule are important. The column temperatures were 40 to 120 ºC, varied in 10 ºC steps. Each probe injection was
 repeated three times, and the average retention time, tR, was used for the calculation. The standard deviation was less than
 1% in all measurements. In all experiments, the real retention time was systematically calculated based on the first order
 retention time taking into account the peak asymmetry. The packed columns were then preconditioned (at a temperature
 equal 130 ºC and under a nitrogen flow rate) overnight to remove any residual solvent left in the packing material.

 Results and Discussion

 Determination of of various solvents adsorbed on the titanium dioxide
 Experimental results obtained by IGC measurements allowed giving the values of of nalkanes and polar solvents
 adsorbed on the titanium dioxide (Table 1).

 TABLE 1. Values of (kJ/mol) of n-alkanes and polar molecules adsorbed on titanium dioxide as a function
 of the temperature

 Temperature (K)
 313.15 323.15 333.15 343.15 353.15 363.15
 Molecule 373.15 383.15 393.15
 C6 4.081 3.257 2.435 1.614 0.794 -0.025 -0.843 -1.660 -2.477
 C7 7.986 7.162 6.339 5.517 4.696 3.876 3.058 2.240 1.423
 C8 10.768 9.914 9.060 8.208 7.357 6.506 5.657 4.809 3.961
 C9 13.735 12.816 11.899 10.982 10.067 9.152 8.239 7.326 6.415
 Benzene 6.396 4.939 3.484 2.029 0.576 -0.876 -2.328 -3.778 -5.228
 Chloroform 3.020 1.692 0.365 -0.961 -2.286 -3.610 -4.933 -6.255 -7.576
 Nitromethane 7.260 5.841 4.423 3.006 1.590 0.175 -1.239 -2.653 -4.065
 Acetonitrile -3.654 -5.384 -7.113 -8.840 -10.57 -12.29 -14.02 -15.74 -17.46
 Acetone 0.027 -1.535 -3.096 -4.657 -6.216 -7.77 -9.33 -10.89 -12.44
 Ethyl acetate 3.399 1.858 0.319 -1.220 -2.757 -4.294 -5.829 -7.364 -8.897
 Tetrahydrofuran 17.432 16.594 15.758 14.922 14.088 13.254 12.422 11.590 10.760

© 2021 Trade Science Inc. 3
The values given on Table 1 will allow evaluating the dispersive component of the surface energy and the acid-base
 properties of Titania.

 Thermodynamic measurements of adsorption parameters
 We calculated the thermodynamics parameters of adsorption of different organic molecules on the titanium dioxide
 surface. The differential heat of adsorption ∆H a0 and the standard entropy change of adsorption ∆S_a^0 of the probe can be
 obtained from the thermodynamic relations (1) and (2):

 ( )
 ∆ 0 = − 1 (1)
 ( )

 ( )
 ∆ 0 = − ( ) (2)

 The obtained straight lines of lnVn=f(1/T) were presented on Fig. 1. A general linear equation was applied (Eq. 3):

 = ( ) + (3)

 Where α and β are constants depending on the probe nature.
 One deduced ∆H0 and ∆S0 from equation (3):

 ∆ 0 = − ; ∆ 0 = − (4)

 8
 C6
 6
 C7
 4 C8
 C9
 2 Benzene

 Chloroform
 0 Nitromethane
 Acetonitrile
 -2 Acetone
 Ethylacetate
 -4
 Tetrahydrofuran
 -6
 2.5 2.6 2.7 2.8 2.9 3.0 3.1 3.2
 1000/T (K)

 Fig. 1. Values of lnVn versus of 1000/T of different organic molecules adsorbed on TiO 2 surface.

 By using equations (1 to 4), the curves of Fig. 1 allowed to obtain the results presented on Table 1 the differential heat and
 the entropy change of adsorption.

 TABLE 2. Values of the differential enthalpy∆ ( / ), entropy change ∆ ( − − ) and the equations of
 free enthalpy ∆ ( ) ( / ) of different probes adsorbed on TiO2 particle surface.

 Molecules ∆ ( / ) ∆ ( − − ) ∆ ( ) ( / )
 C6 -29.747 -82.0 -29.747+8.20 x10⁻² T

© 2021 Trade Science Inc. 4
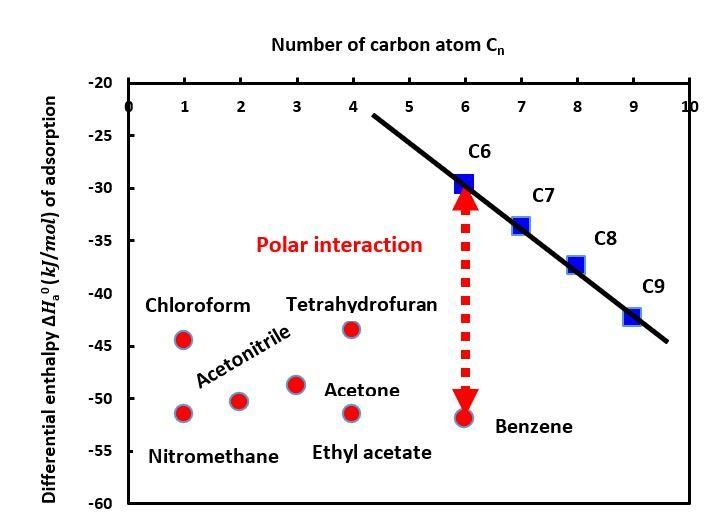
C7 -33.677 -82.1 -33.677+8.21 x10⁻² T
 C8 -37.411 -85.1 -37.411+8.51 x10⁻² T
 C9 -42.388 -91.5 -42.388+9.15 x10⁻² T
 Benzene -51.897 -145.3 -51.897+14.53 x10⁻² T
 Chloroform -44.496 -132.5 -44.496+13.25 x10⁻² T
 Nitromethane -51.589 -141.6 -51.589+14.16 x10⁻² T
 Acetonitrile -50.394 -172.6 -50.394+17.26 x10⁻² T
 Acetone -48.840 -155.9 -48.840+15.60 x10⁻² T
 Ethyla cetate -51.532 -153.7 -51.532+15.37 x10⁻² T
 Tetrahydrofuran -43.550 -83.4 -43.550+7.34 x10⁻² T

 The differential enthalpy and entropy change of adsorption can be correlated to the carbon atom number . We obtained
 relations 5 and 6:
 ∆ 0 ( / ) = −4.166 − 4.564 (5)

 ∆ 0 ( −1 −1 ) = −3.164 − 61.426 (6)

 ∆ 0 and ∆ 0 increase negatively when the carbon atom number in the probe increases (Table 2). This increase is due to the
 increase in the boiling points of n-alkanes and to the stronger interaction between the solute and TiO 2 catalyst surface.
 The specific interactions between benzene’s π electrons and the TiO 2 surface lead to more negative value of ∆ 0 than the
 corresponding values for n-alkanes with the same carbon atom number. This more important enthalpy is due to the larger
 interaction between benzene and TiO2 surface.
 The ∆ 0 values of polar probes increase from tetrahydrofuran to benzene:

 Tetrahydrofuran
When considering equation (4) and the values of polar probes from Table 2, on can deduce the polar and non-polar
 contributions of every molecules (Table 3).

 . − .
 TABLE 3. Values of polar and non-polar enthalpies ∆ ( / ) and ∆ ( / ) of different probes
 adsorbed on TiO2 particle surface.

 . − .
 Probes ∆ ( / ) ∆ ( / ) ∆ ( / )
 C6 -29.747 0 -29.747
 C7 -33.677 0 -33.677
 C8 -37.411 0 -37.411
 C9 -42.388 0 -42.388
 Benzene -51.897 -23.75 -28.147
 Chloroform -44.496 -31.779 -12.716
 Nitromethane -51.589 -42.860 -8.729
 Acetonitrile -50.394 -41.843 -8.551
 Acetone -48.840 -36.338 -12.502
 Ethyl acetate -51.532 -30.306 -21.226
 Tetrahydrofuran -43.550 -28.887 -14.663

 .
 The values of polar contributions of the enthalpy of adsorption ∆ of polar probes can be classified in increasing order:

 Benzene
Fig. 3 showed a perfect linear relation given by:

 .
 ∆ = −51.121 × . . −18.337; R²=0.9992 (7)

 The IGC technique is advantageously proved to be an excellent and simple tool that describes more accurately the
 physicochemical properties of nanoparticles.

 Determination of the dispersive component of the surface energy of titanium dioxide
 In order to calculate the dispersive component of the surface energy of TiO 2, we used the various surface areas of n-alkanes
 using different models the values of the dispersive component of the surface tension ( ) of n-alkanes as a function of the
 temperature [32-35].

 By plotting RTlnVn as a function of 2 √ of n-alkanes at various temperatures, we obtained the values of dispersive
 component of the surface energy of TiO2 for the chosen molecular model. The obtained results are given in Fig. 4 for the
 different surface area models.

 160
 Dispersive component of the surface energy

 140
 VDW
 120 Kiselev

 100 Cylindrical
 Redlich-Kong
 80
 Spherical
 60
 geometric
 40

 20

 0
 300 320 340 360 380 400
 Temperature in K
 Fig. 4. Variations of the dispersive component of the surface energy ( / ) of TiO2 as a function of the
 temperature T (K) using the different molecular models of n-alkanes surface areas (VDW: Van der Waals model).

 The results obtained by IGC using the various molecular models of the dispersive component of the surface energy ( /
 2 ) of TiO2 and showed in Fig. 4 can be also given as a function of the temperature by the equations in the Table 3.

 TABLE 3. Equations ( ) of TiO2 for the different molecular models of n-alkanes surface areas, the slope and the
 extrapolated values ( ).

 ( = ) (in Regression
 Molecular model ( ) (in mJ/m2)
 (in mJ m-2 T-1)
 mJ/m2) coefficient
 VDW =-0.14T+94.84 -0.14 94.84 R²=0.9979

© 2021 Trade Science Inc. 7
Kiselev =-0.13T+90.34 -0.13 90.34 R²=0.9975
 Cylindrical =-0.10T+79.29 -0.10 79.29 R²=0.9953
 Redlich-Kwong =-0.24T+159.84 -0.24 159.84 R²=0.9977
 Spherical =-0.46T+281.67 -0.46 281.67 R²=0.9987
 geometric =-0.04T+43.36 -0.04 43.36 R²=0.9958

 These above equations of ( ) were obtained for a temperature interval (313.15 K, 393.15 K). We observed an important
 difference in the behavior of ( ) of titanium dioxide depending on the various molecular models. We can see this net
 difference by observing the different values of the slope of ( ) relative to the molecular model. The most used model by
 the scientists is that relative to Kiselev results (equivalent to Fowkes method). Van der Waals and Kiselev models here
 showed similar results of ( ) with identical slopes followed by the results of the cylindrical model, the different values of
 ( ) of TiO2 catalyst in such cases are comprised between 40 and 52 mJ/m2. However, these results are very different from
 those obtained by the other models (Redlich-Kwong, spherical and geometric models). By extrapolating to the 0 K absolute
 temperature, we found the extrapolated values of (0 ) of TiO2 catalyst for VDW and Kiselev models approaching 90 to
 95 mJ/m2 whereas they reached 282 mJ/m2 for spherical model. It is not surprising that the spherical model is one of the
 models which is out of trend, because clearly molecules such as alkanes have rather cylindrical than spherical geometry. That
 is why the cylindrical model is the best-applied model.

 These results again proved that the ( ) values of solids obtained by IGC are not true in a quantitative way but they can be
 considered interesting as qualitative results by comparison between the different molecular models as we proved it in other
 studies [24,25].

 One of the above results was to choose another method to evaluate the specific interactions and acid-base constants in Lewis
 terms of TiO2 catalyst. The Saint-Flour and Papirer method was used to determine the physicochemical properties of the
 above solid catalyst.

 Determination of the specific interactions and acid-base properties of TiO2 catalyst
 The variations of the specific free energy on Fig. 5 we plotted the variations of the specific free energy (-∆Gsp) of TiO2
 catalyst surface in interaction with the different adsorbed polar probes as a function of the temperature T.
 150

 100
 Benzene
 Specific free energy -DGsp (kJ/mol)

 50
 Chloroform
 Temperature T (K)
 0 Nitromethane
 300 320 340 360 380 400 Acetonitrile
 -50
 Acetone

 -100 Ethyl acetate
 THF
 -150

 -200
 Fig. 5. Evolution of the specific free energy (-∆Gsp) of adsorption of polar molecules on TiO2 surface as a function of
 the temperature.

© 2021 Trade Science Inc. 8
Fig. 5 clearly showed linear dependency of (-∆Gsp) of TiO2 as a function of the temperature. We deduced from the above
 different straight lines the values of the specific enthalpy ∆H sp and entropy ∆Ssp of adsorption of polar molecules on TiO2
 catalyst. The obtained results are given on Table 4.

 TABLE 4. Values of the specific enthalpy ∆Hsp and entropy ∆Ssp of adsorption of polar molecules on TiO2 catalyst
 surface.

 Polar probes -∆Hsp (kJ mol-1) -∆Ssp (kJ K-1 mol-1)
 Benzene 359.49 1.066
 Chloroform 313.61 0.995
 Nitromethane 354.18 1.031
 Acetonitrile 371.79 1.333
 Acetone 352.48 1.187
 Ethyl acetate 364.31 1.148
 THF 261.66 0.518

 Determination of the acid base constants of TiO2 catalyst surface
 To determine the acid-base constants KA and KD of TiO2 catalyst surface, we plotted on Fig. 6 the variations of -∆Hsp/AN' as
 a function of DN'/AN' of different polar molecules adsorbed on TiO 2 surface.
 160

 140 -DHsp/AN' = 4.57(DN'/AN') + 18.12
 R² = 0.9952
 120

 100
 -DHsp/AN'

 80

 60

 40

 20

 0
 0 5 10 15 20 25 30
 DN'/AN'

 Fig. 6. Variations of -∆Hsp/AN' as a function of DN'/AN' of different polar molecules adsorbed on TiO2 surface.

 The curve of Fig. 6 is a straight line with an excellent linear regression coefficient (R²=0.9952) and the following relation
 gives the corresponding equation (8):

© 2021 Trade Science Inc. 9
-∆Hsp/AN'=4.57(DN'/AN')+18.12 (8)

 From equation (8), we deduced the acid-base constants KA and KD of TiO2 surface:

 KA=4.57 kJ/mol and KD=18.12 kJ/mol

 The constants KA and KD can be given in dimensionless parameters by:

 KA=2.73, KD=10.82 and KD/KA=3.97

 This study showed the amphoteric acid base character of TiO2 catalyst with a strong basicity that is equal about fourth times its
 acidity force.

 Comparison with acid-base properties of Titania dispersions in organic media
 In a previous paper [36], we studied the acid-base properties of the dispersion of TiO2 particles in organic medium by using
 the data obtained by zetametry in organic liquid medium. The method used determines the electron acceptor number and
 electron donor number of TiO2 catalyst was that developed by Siffert et al. [37]. Based on this study, Hamieh et al. [36]
 obtained the following acceptor ANS´ and donor number DNS´ of the Titania catalyst: DNS´=46, ANS´=11 and
 DNS´/ANS´=4.18. The comparison of these results with those obtained by IGC leads to the following findings:
 DNS´/KD=4.25, ANS´/KA=4.03. It is interesting that both, the acid and base character as well are 4 times bigger in liquid
 medium than in infinite gas dilution. By comparing the ratio DNS´/ANS´=4.18 to that of KD/KA=3.97, we deduced that the
 ratio of the basic character on the acid character in both cases are comparable.

 Other methods to determine the acid base properties of TiO 2
 Donnet et al. method of deformation polarizability In order to resolve some difficulties in the determination of the acid base
 properties of solid substrates, Donnet et al. [38] proposed an original method taking into account the deformation
 polarizability 0 for the determination of specific interactions between adsorbate and adsorbent. They plotted the variation of
 as a function of (ℎ )1/2 0, for all used probes, where the electronic frequency of the probe is and h the
 Planck’s constant. Donnet et al. [38] proved the expression (9):
 = (ℎ )1/2 0, [(ℎ )1/2 0, ] + (9)

 Where is the electronic frequency of the solid, 0, its polarizability and K a constant given by expression (15):

 6
 3 1
 = ( ) (10)
 4 (4 0 )2 ,

 With 0 the permittivity of the vacuum and , the distance of adsorbate-adsorbent interaction, assumed constant for all
 probes studied as 0.3 nm. This method is represented by the function = [(ℎ )1/2 0, ] and allowed to obtain the
 specific enthalpy of interaction [38].

 By applying the Donnet et al. method, we obtained Fig. 7 showing the evolution of the specific enthalpy of interaction as a
 function of the temperature of the different polar molecules adsorbed on the titania surface.

© 2021 Trade Science Inc. 10
Fig. 7. Variation of the specific free energy (-∆Gsp) (kJ/mol) of adsorption of polar molecules on TiO2 surface as a
 function of the temperature by using Donnet et al. method.
 Figure showed that THF exhibits the larger interaction with the Titania particle surface, followed by nitromethane and
 acetone.

 The representation of the variations of (-∆Hsp/AN') as a function of DN'/AN' of different polar molecules adsorbed on TiO 2
 surface (Fig. 8) by using the deformation polarizability of molecules led to the values of acid base constants.
 16

 14

 12
 (-DHsp/AN' ) in kJ/mol

 10

 8

 6

 4

 2

 0
 0 5 10 15 20 25 30
 DN'/AN'

 Fig. 8. Variations of -∆Hsp/AN' as a function of DN'/AN' of different polar molecules adsorbed on TiO2 surface.

© 2021 Trade Science Inc. 11
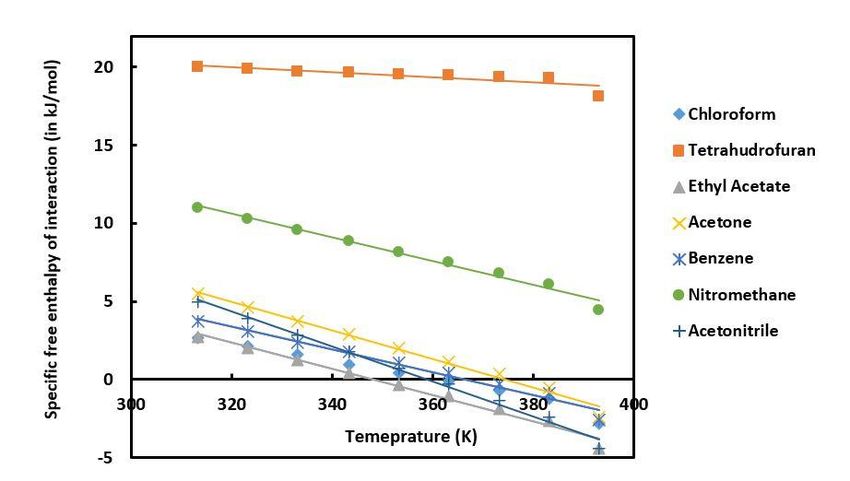
The straight line obtained in Fig. 8 gave relation (11):

 -∆Hsp/AN'=0.444 DN'/AN'+1.719; R²=0.9947 (11)

 From the relation (16), we obtained the acid base constants of TiO 2 by the method of the deformation polarizability:

 KA.dp.=0.444 kJ/mol; KD.dp.=1.719 kJ/mol; KD dp./KA dp.=3.872

 The problem of this method is that the values of and 0, of n-alkanes and polar molecules are not known with good
 accuracy and consequently the obtained values of acid base constants cannot be accurately calculated. However, by
 comparing this method with the previous method of the vapor pressure of molecules, we observed that the ratio KD/KA is
 almost the same in the two cases.

 Brendlé-Papirer method of topological index
 Brendlé and Papirer [39] proposed another method based on the use of the topological index of probes represented the
 variation of = ( ) of n-alkanes, polar molecules, branched alkanes and cycloalkanes. By using the various values
 of the topological index of n-alkanes and polar molecules [39,40], we obtained the specific interactions and the acid-base
 constants. By applying this method on the titanium dioxide particles, we obtained the results presented on Fig. 9.
 20
 Specific free enthalpy of interaction (in kJ/mol)

 15 Chloroform

 Tetarhydrofuran
 10 Ethyl Acetate

 Acetone
 5 Benzene

 Nitromethane
 0
 Acetonitrile
 310 330 350 370 390

 -5 Temperature (K)

 -10

 Fig. 9. Variation of the specific free energy (-∆Gsp) (kJ/mol) of adsorption of polar molecules on TiO 2 surface as a
 function of the temperature by using Brendlé-Papirer method.

 Fig. 9 also showed a larger value of the specific free enthalpy for tetrahydrofuran followed by nitromethane. The three used
 methods gave approximately the same tendency of the comparison between the different polar molecules.

 By using the topological index (ti.) of polar molecules, we obtained relation (12):

 -∆Hsp/AN'=0.319 DN'/AN'+1.746; R²=0.9942 (12)

© 2021 Trade Science Inc. 12
and the acid base constants

 KA.ti.=0.319 kJ/mol; KD.ti.=1.746 kJ/mol; KD.ti./KA.ti.=5.473

 The ratio KD/KA is quite different from the values obtained by the two previous methods. There is no universal method to
 determine the acid base constants of a solid substrate. However, the method using the concept of vapor pressure seems until
 know the more appropriated method that takes into account the variation of the vapor pressure versus the temperature and the
 resulting effect on the calculation of the specific thermodynamic variables of adsorption of n-alkanes and polar probes.
 Whereas, the other proposed methods do not take into consideration the effect of the temperature on the deformation
 polarizability or on the topological index.

 Analysis of the results
 Lanin et al. [41] determined the adsorption properties of titanium dioxide and obtained for TiO 2 surface the acid base
 constants KA=0.18, KD=1.19 and KD/KA=6.61. These values are very close to those obtained by the present study when
 using the topological index method [39]. Lee et al. [42] determined the relative acidity KA/KD of non-treated titanium
 dioxide but the ratio was expressed in mol/kcal, because of the use of the classical method with KA (unitless) and KD
 (kcal/mol). They obtained KA/KD=0.90 mol/kcal. This value can be converted to unitless ratio by using the following
 relation [43]:
 40 ( / )
 ( / ) = (unitless) (13)
 100

 Therefore, the unitless ratio KA/KD (from the values given by Lee et al. [42] is equal to KA/KD=0.36 or KD/KA=2.78. This
 result approaches the result that we obtained by using the vapor pressure method (KD/KA=3.97) but it is very different from
 the last method using the topological index. Bogillo and Voelkel [44] also studied the surface properties of the titanium
 dioxide with is modified forms. By using the vapor pressure method they obtained KA/KD=-0.138 mol/kcal and with the
 polarizability method the ratio was KA/KD=0.464 mol/kcal. These values can be converted to the following unitless ratios
 KD/KA=-18.16 and KD/KA=5.40. The negative value obtained by Bogillo and Voelkel cannot be admitted and probably
 they committed a mistake in their calculations. However, the second value obtained by the polarizability method, can be
 approached to the value obtained by our study.

 It can be conclude that the acid-base surface properties of titanium dioxide strongly depend on the chosen methods of the
 determination of the specific free enthalpy of interaction between the polar molecules and the solid substrate. The method
 using the vapor pressure of molecules gives the more accurate values of KA and KD. However, the various results obtained
 by the different IGC methods can be only considered as qualitative. In this study, we deduced that the titanium dioxide
 exhibits more basic than acidic surface.

 Conclusion

 In this study, we determined the acid base interactions and the surface properties of titanium dioxide catalyst by inverse gas
 chromatography at infinite dilution. The curves of lnVn=f(1/T) allowed to obtain the differential heat, the enthalpy and
 entropy of adsorption of different organic probes adsorbed on the titanium oxide surface. We separated the two polar and
 dispersive contributions of polar molecules adsorbed on the Titania surface. For the first time, we gave a linear relation
 between the polar enthalpy of adsorption of probes and their relative polarities with an excellent accuracy. The different
 molecular models of the surface areas of n-alkanes were applied to calculate the dispersive component of the surface
 energy of TiO2 catalyst. The obtained results clearly showed a linear dependency of against the temperature for all used
 model of surface area of n-alkanes. The application of Saint-Flour and Papier method allowed determining the specific free
 energy of adsorption as a function of the temperature and then to deduce the specific enthalpy and entropy of polar probes
 adsorbed on titania surface. It was proved that titanium dioxide surface is an amphoteric surface with stronger basic

© 2021 Trade Science Inc. 13
character. The acid KA and base KD constant of this catalyst were determined KA=2.73, KD=10.82 and KD/KA=3.97. The
 results obtained by zetametry for the dispersion of titania particles in organic liquids allowed to obtain the acceptor ANS´and
 donor DNS´ numbers of the titania catalyst: DNS´=46, ANS´=11 and DNS´/ANS´=4.18. These results proved that
 DNS´=4.25 KD and ANS´=4.03 KA showing an acid base character of TiO 2 catalyst in organic liquid medium obtained in
 zetametry, larger than that obtained in inverse gas chromatography at infinite dilution. The comparison of the method based
 on the vapor pressure to those using the deformation polarizability and the topological index led to conclude that all method
 gave an identical order of the interaction force of the various polar probes and similar acid base constant ratio KD/KA. The
 method using the vapor pressure seems to be the best one, because it is based on the dependency of the vapor pressure of
 molecules on the temperature and the obtained results by this method are more accurate.
 Funding
 There is no funding

 Conflicts of Interest/Competing Interests

 There is no conflict of interests/Competing interests

 Availability of Data and Material

 Non

 Code Availability

 Non

 Authors' Contributions

 Tayssir Hamieh, PhD, PhD, HDR, ENG (Conceptualization: Equal; Formal analysis: Equal; Funding acquisition: Equal;
 Investigation: Lead; Methodology: Lead; Project administration: Lead; Resources: Equal; Supervision: Equal; Validation:
 Equal; Writing-original draft: Lead; Writing review and editing: Lead)
 Fatima Al-Ali, PhD (Conceptualization: Equal; Formal analysis: Equal; Investigation: Supporting; Methodology: Supporting;
 Validation: Supporting; Writing original draft: Supporting)
 Ali Ali Ahmad, PhD Student (Formal analysis: Equal; Investigation: Supporting; Methodology: Supporting; Validation:
 Equal; Writing original draft: Supporting)
 Khaled Chawraba, PhD Student (Formal analysis: Equal; Investigation: Supporting; Methodology: Supporting; Validation:
 Equal; Writing original draft: Supporting)
 Joumana Toufaily, PhD, HDR (Conceptualization: Equal; Formal analysis: Equal; Funding acquisition: Supporting;
 Investigation: Supporting; Methodology: Supporting; Resources: Equal; Validation: Equal; Writing original draft:
 Supporting)
 Zahraa Youssef, PhD (Conceptualization: Supporting; Formal analysis: Supporting; Investigation: Supporting; Methodology:
 Supporting; Validation: Supporting; Writing original draft: Supporting)
 Nabil Tabaja, PhD (Conceptualization: Supporting; Formal analysis: Supporting; Investigation: Supporting; Supervision:
 Supporting; Validation: Supporting; Writing original draft: Supporting)
 Thibault Roques-Carmes, PhD, HDR (Conceptualization: Equal; Formal analysis: Equal; Investigation: Supporting;
 Methodology: Supporting; Project administration: Supporting; Supervision: Equal; Validation: Equal; Writing original draft:
 Supporting)
 Jacques Lalevée, PhD, HDR (Conceptualization: Equal; Formal analysis: Equal; Investigation: Supporting; Methodology:
 Supporting; Project administration: Supporting; Supervision: Equal; Validation: Equal; Writing original draft: Supporting).

© 2021 Trade Science Inc. 14
References
 1. Gázquez MJ, Bolívar JP, Garcia-Tenorio R, et al. A review of the production cycle of titanium dioxide pigment.
 Mater Sci Appl. 2014; 5 (7):441-458.
 2. Lan Y, Lu Y, Ren Z. Mini review on photocatalysis of titanium dioxide nanoparticles and their solar applications,
 Nano Energy 2013; 2(5):1031-1045.
 3. Karmakar A, Zhang Q, Zhang Y. Neurotoxicity of nanoscale materials. J Food Drug Anal 2014; 22(1):147-160.
 4. Kumar SG, Devi LG. Review on modified TiO2 photocatalysis under UV/visible light selected results and related
 mechanisms on interfacial charge carrier transfer dynamics. J Phys Chem A. 2011; 115(46):13211-13241.
 5. Wang G, Xu L, Zhang J, et al. Enhanced photocatalytic activity of powders (P25) via calcination treatment. Int J
 Photoenergy. 2012:1-9.
 6. Zhao J, Milanova, Warmoeskerken MMCG, et al. Surface modification of TiO2 nanoparticles with silane coupling
 agents. Colloids Surf Physicochem Eng Asp. 2012; 413:273-279.
 7. Rui Z, Wu S, Peng C, et al. Comparison of TiO2 Degussa P25 with anatase and rutile crystalline phases for methane
 combustion. Chem Eng J. 2014; 243:254-264.
 8. Ohtani B, Prieto-Mahaney OO, Li D, et al. What is Degussa (Evonik) P25? Crystalline composition analysis,
 reconstruction from isolated pure particles and photocatalytic activity test. J Photochem Photobiol Chem. 2010;
 216(2-3):179-182.
 9. Ohno T, Sarukawa K, Tokieda K, et al. Morphology of a TiO2 Photocatalyst (Degussa, P-25) consisting of anatase
 and rutile crystalline phases. J Catal. 2001; 203(1):82-86.
 10. Conder JR, Locke DC, Purnell JH. Concurrent solution and adsorption phenomena in chromatography. I J Phys
 Chem. 1969; 73:700-8.
 11. Conder JR, Purnell JH. Gas chromatography at finite concentrations. Part 2: A generalized retention theory. Trans
 Faraday Soc. 1968; 64:3100-11.
 12. Conder JR, Purnell JH. Gas chromatography at finite concentrations. Part 3: Theory of frontal and elution techniques
 of thermodynamic measurement. Trans Faraday. 1969; 65:824-38.
 13. Conder JR, Purnell JH. Gas chromatography at finite concentrations. Part 4: Experimental evaluation ofmethods for
 thermodynamic study of solutions. Trans Faraday Soc. 1969; 65:839-48.
 14. Conder JR, Young CL. Physical measurements by gas chromatography. Eds: Wiley J and Sons, New York. 1979;
 978-94.
 15. Papirer E, Balard H, Rahmani Y, et al. Characterization by inverse gas chromatography of the surface properties of
 silicas modified by poly (ethylene glycols) and their models (oligomers, diols). Chromatographia. 1987; 23:639-47.
 16. Vidal A, Papirer E, Jiao WM, et al. Modification of silica surfaces by grafting of alkyl chains. I-Characterization of
 silica surfaces by inverse gas-solid chromatography at zero surface coverage. Chromatographia, 1987; 23:121-8.
 17. Saint Flour C, Papirer E. Gas-solid chromatography. A method of measuring surface free energy characteristics of
 short glass fibers. 1. Through adsorption isotherms. Ind Eng Chem Prod Res Dev. 1982; 21:337-341.
 18. Saint Flour C, Papirer E. Gas-solid chromatography: Method of measuring surface free energy characteristics of
 short fibers. 2. Through retention volumes measured near zero surface coverage. Ind Eng Chem Prod Res Dev.
 1982; 21:666-669.
 19. Papirer E, Balard H, Vidal A. Inverse gas chromatography: A valuable method for the surface characterization of
 fillers for polymers (glass fibres and silicas). Eur Polym J. 1988; 24:783-90.
 20. Voelkel A. Inverse gas chromatography: characterization of polymers, fibers, modified silicas, and surfactants. Crit
 Rev Anal Chem. 1991; 22:411-39.
 21. Schuster RH, Gräter H, Cantow HJ. Thermodynamic studies on polystyrene-solvent systems by gas
 chromatography. Macromolecules. 1984; 17:619-25.
 22. Öner M, Dincer S. Thermophysical properties of polymer-probe pairs by gas chromatography. Polymer, 1987;
 28:279-82.
 23. Guillet JE, Romansky M, Price GJ, et al. Studies of polymer structure and interactions by automated inverse gas
 chromatography. Inverse gas chromatography. Washington, DC: Characterization of Polymers and Other Materials,
 American Chemical Society 1989; 20-32.

© 2021 Trade Science Inc. 15
24. Hamieh T, Schultz J. New approach to characterise physicochemical properties of solid substrates by inverse gas
 chromatography at infinite dilution. J of Chromatography. 2002: 969(1-2):17-47.
 25. Hamieh T, Rezzaki M, Schultz J. Study of the transition temperatures and acid-base properties of poly (methyl
 methacrylate) adsorbed on alumina and silica, by using inverse gas chromatography technique. Colloids and
 Surfaces A: Physicochemical and Engineering Aspects.2001; 189(1-3):279-291.
 26. Hamieh T. Determination of the transition phenomena of poly (α-n-alkyl) methacrylates Adsorbed on Silica by
 Inverse Gas Chromatography (IGC). J Polym Res. 2011; 18:1159-1168.
 27. Gutmann V. The donor-acceptor approach to molecular interactions, Plenum. New York. 1978.
 28. Fowkes FM. In: Surface and interfacial aspects of biomedical polymers, Vol. I, pp. 337-372, Ed: J. D. Andrade,
 Plenum Press, New York. 1985.
 29. Schultz J, Lavielle L, Martin C. The role of the interface in carbon fibre-epoxy composites, J Adhesion.
 1987;23(1):45-60.
 30. Dorris GM, Gray DG. Adsorption of normal-alkanes at zero surface coverage on cellulose paper and wood fibers.
 Journal of Colloid and Interface Science. 1980; 77:353-362.
 31. Riddle FL, Fowkes FM. Spectral shifts in acid-base chemistry. Van der Waals contributions to acceptor numbers,
 Spectral shifts in acid-base chemistry. Van der Waals contributions to acceptor numbers. J. Am. Chem. Soc.
 1990;112 (9). 3259-3264.
 32. Hamieh T, Rageul-Lescouet M, Nardin N, et al. Schultz, Etude des interactions spécifiques entre certains oxydes
 métalliques et des molécules organiques modèles. J Chim Phys. 1997;94:503-524.
 33. Jensen WB. The lewis acid base concepts. Wiley, New York. 1980.
 34. Jasper JJ. The Surface Tension of Pure Liquid Compounds, J. Phys. Chern. Ref. Data, J Phys Chem Ref Data.
 1972;1(4):841-1010.
 35. Grigoryev BA, Nemzer BV, Kurumov DS, et al. Surface tension of normal pentane, hexane, heptane, and octane, Int
 J Thermophy 1992;13(3):453-464.
 36. Hamieh T, Toufaily J, Alloul H. Physicochemical Properties of the Dispersion of Titanium Dioxide in Organic
 Media by Using Zetametry Technique. J Dispersion Science Technology.2008;29(9):1181-1188.
 37. Papirer E, Kuczynski J, Siffert B. Characterization of the surface properties of heavy residues of oil distillation by
 inverse gas chromatography, Chromatographia. 1987;23:401-406.
 38. Donnet JB, Park S, Balard H. Evaluation of specific interactions of solid surfaces by inverse gas chromatography,
 Chromatographia. 1991;31:434-440.
 39. Brendlé E, Papirer E. A new topological index for molecular probes used in inverse gas chromatography for the
 surface nanorugosity evaluation, 1. Method of Evaluation, J. Colloid Interface Sci. 1997;194:207-216.
 40. Brendlé E, Papirer E. A new topological index for molecular probes used in inverse gas chromatography for the
 surface nanorugosity evaluation, Application for the Evaluation of the Solid Surface Specific Interaction Potential, J.
 Colloid Interface Sci. 1997; 194:217-2224.
 41. Lanin SN, Vlasenko EV, Kovaleva NV, et al. The adsorption properties of titanium dioxide. Russian J Physical
 Chem. 2008;82(12):2152-2155.
 42. Lee YJ, Fekeb DL, Manas-Zloczower I. Dispersibility maps for treated titanium dioxide powders, Colloids and
 Surfaces. 1992;64(3-4):235-244.
 43. Hamieh T, Ahmad AA, Roques-Carmes T, et al. New approach to determine the surface and interface
 thermodynamic properties of H-β-zeolite/rhodium catalysts by inverse gas chromatography at infinite dilution,
 Scientific Reports. 2020;10(1):1-27.
 44. Bogillo VI, Voelkel A. Surface properties of rutile and its modified form Part 1. Surface characteristics studied by
 means of inverse gas chromatography, J. Adhesion Sci. Technol. 1997;11(12):1513-1529.

© 2021 Trade Science Inc. 16
You can also read