The zero-emissions cost of energy: a policy concept - IOPscience
←
→
Page content transcription
If your browser does not render page correctly, please read the page content below
Progress in Energy

PERSPECTIVE • OPEN ACCESS

The zero-emissions cost of energy: a policy concept
To cite this article: Colin M Beal and Carey W King 2021 Prog. Energy 3 023001

View the article online for updates and enhancements.

                              This content was downloaded from IP address 46.4.80.155 on 14/04/2021 at 01:04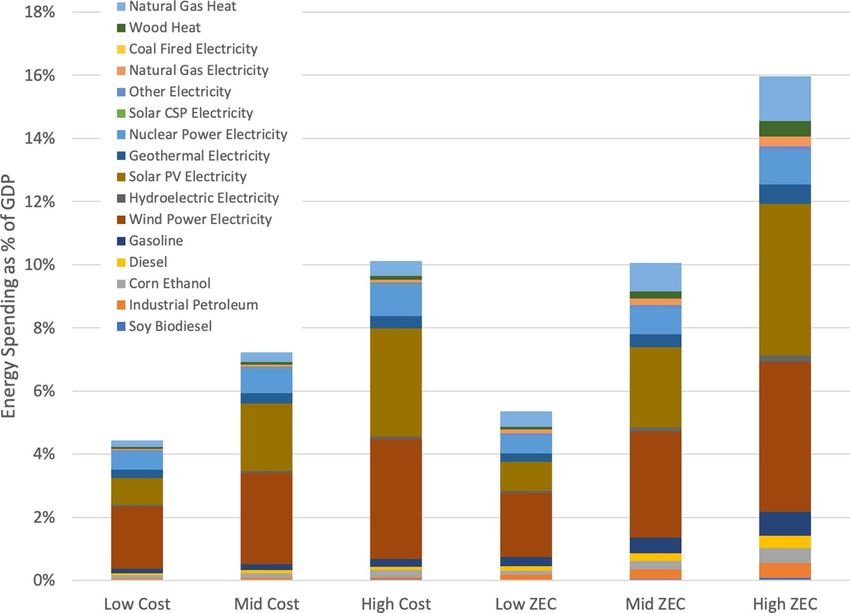
Prog. Energy 3 (2021) 023001 https://doi.org/10.1088/2516-1083/abef1f
Progress in Energy
PERSPECTIVE
The zero-emissions cost of energy: a policy concept
OPEN ACCESS
Colin M Beal1,2,∗ and Carey W King3
RECEIVED 1
10 September 2020 B&D Engineering and Consulting LLC, Lander, WY, United States of America
2
University of Hawaii at Hilo, College of Agriculture, Forestry, and Natural Resource Management, Hilo, HI, United States of America
REVISED 3
13 March 2021
Energy Institute, University of Texas at Austin, Austin, TX, United States of America
∗
Author to whom any correspondence should be addressed.
ACCEPTED FOR PUBLICATION
16 March 2021 E-mail: colinmbeal@gmail.com
PUBLISHED
6 April 2021 Keywords: climate change, energy economics, greenhouse gas emissions, energy spending, carbon tax, negative emissions
Original content from
this work may be used Abstract
under the terms of the
Creative Commons The energy sector generates over 70% of global greenhouse gas (GHG) emissions, but existing
Attribution 4.0 licence.
energy-climate policies do little to reduce GHG emissions to prevent climate change. We present a
Any further distribution
of this work must new carbon tax policy concept in which energy users would be taxed an amount equal to the cost
maintain attribution to of cleaning up the emissions that they create, wherein the tax revenues would be used to operate
the author(s) and the title
of the work, journal negative emissions technologies. The policy is based on applying the zero-emissions cost (ZEC)
citation and DOI.
metric to energy prices, which includes the ‘regular’ cost of an energy source plus the cost of
sequestering its emissions. Using the ZEC, (a) the energy sector would be emissions-neutral, (b)
biofuels would be cheaper than petroleum fuels, and (c) renewable electricity would be cheaper
than fossil-fuel electricity. We calculate the energy spending as a fraction of gross domestic product
for ‘regular’ and ZEC cost scenarios. Implementing the ZEC carbon-tax policy would enable a
monumental shift to a net-zero emissions energy sector, but carries a significant risk of causing an
economic recession. The summary point of this commentary is to demonstrate a pathway to
achieve net-zero GHG emissions from the US energy sector, and to contemplate the associated
economic impacts on our society.
1. Introduction
Energy consumption generates over 70% of global greenhouse gas (GHG) emissions (WRI 2020) with
primary contributions from liquid transportation fuels, electricity generation, and heat generation.
Emissions taxes have been proposed for decades (Pigou 1920, Nordhaus 1977, Rockström et al 2017) and a
variety of emissions taxes and alternative fuel subsidies have been implemented worldwide (Sumner et al
2011, Goulder and Schein 2013, Kotchen et al 2017, Fuss et al 2018). However, these initiatives do not negate
emissions; the associated revenues are not used to sequester GHG from the atmosphere. Even integrated
assessment models (IAMs) often assume that carbon tax revenues are ‘redistributed to households in lump
sum fashion’ (Wilkerson et al 2015). As a result, these efforts have made little impact on global GHG
emissions, which have continued to rise, nearing 50 GtCO2 e yr−1 (IPCC 2014). To date, GHG emitters have
not been required to pay for the emissions that we generate. Meanwhile, a variety of negative emissions
technologies have been developed to capture and store GHG from the atmosphere, including afforestation,
bioenergy with carbon capture and storage, and direct air capture (Sanz-Pérez et al 2016, Smith et al 2016),
but deploying these environmental efforts has been limited due to high costs, early stage of development, and
a lack of accountability. Who is responsible for cleaning up the waste?
In this commentary we present a metric that quantifies the cost of ‘cleaning up’ GHG emissions from
100% of the United States’ (US) energy consumption by allocating that cost directly to the original fuel
source. As such, the zero-emissions cost (ZEC) metric represents the full cost of net-zero-emissions energy
sources. If the US implements the ZEC as a carbon-taxed market price of energy, and subsequently uses the
tax revenues to negate the associated energy-sector emissions, the country could create an emissions-neutral
© 2021 The Author(s). Published by IOP Publishing Ltd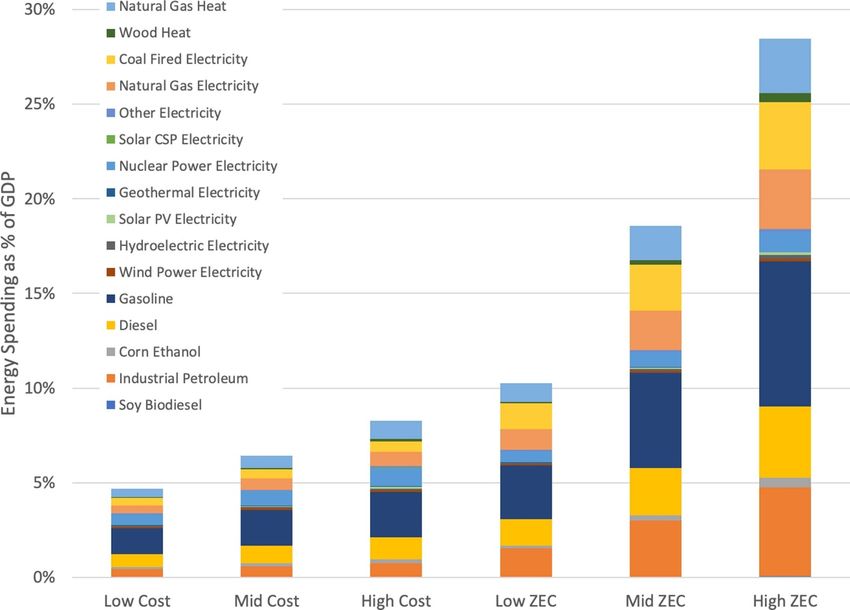
Prog. Energy 3 (2021) 023001 C M Beal and C W King
Figure 1. Control volumes for zero-emissions cost accounting.
energy system. To estimate the macroeconomic feedback of this cost, we evaluate the impact that
implementing the ZEC in retail markets would have on the United States’ economy.
2. Methods
The ZEC is defined according the equation (1),
[ ] [ ] [ ] [ ]
$ $ kgCO2 e $
ZEC = XF + GHGN · XN (1)
GJ GJ GJ kgCO2 e
where XF is the price of fuel for an end-user, GHGN is the amount of negative emissions required to offset the
lifecycle GHG impact of consuming the fuel, and XN is the cost of negative emissions. Equation (2) defines
GHGN as the sum of the direct emissions from the fuel’s end-use (GHGD ) and the indirect emissions
associated with fuel production (i.e. upstream or embedded emissions) (GHGI )
[ ]
kgCO2 e
GHGN = GHGD + GHGI . (2)
GJ
As shown in figure 1, the ZEC metric combines the cost of purchasing a fuel for an end user with the cost
of negating the associated lifecycle GHG emissions. Data for the variables in equation (1) are listed in
appendices A1–A3 and were obtained from the following sources: XF (Lazard 2018, DOE 2019, EIA 2019),
GHGN (Wernet et al 2016, ANL 2018), and XN (Sanz-Pérez et al 2016, Smith et al 2016).
The ZEC of any specific amount of fuel depends on the corresponding fuel price, lifecycle GHG
emissions, and cost of negative emissions—all of which can vary not only among fuel types (e.g. gasoline vs.
solar power), but also between fuels of the same type (e.g. gasoline produced from Saudi Arabian crude oil
vs. gasoline produced from Canadian tar sands) (Masnadi et al 2018). As such, our objective is not to specify
which fuel types are ‘best,’ but instead to demonstrate the utility of the ZEC metric as a tool for comparing
the energy-emissions nexus of a variety of fuels within a common framework.
3. Results, discussion, and policy implications
3.1. ZEC results
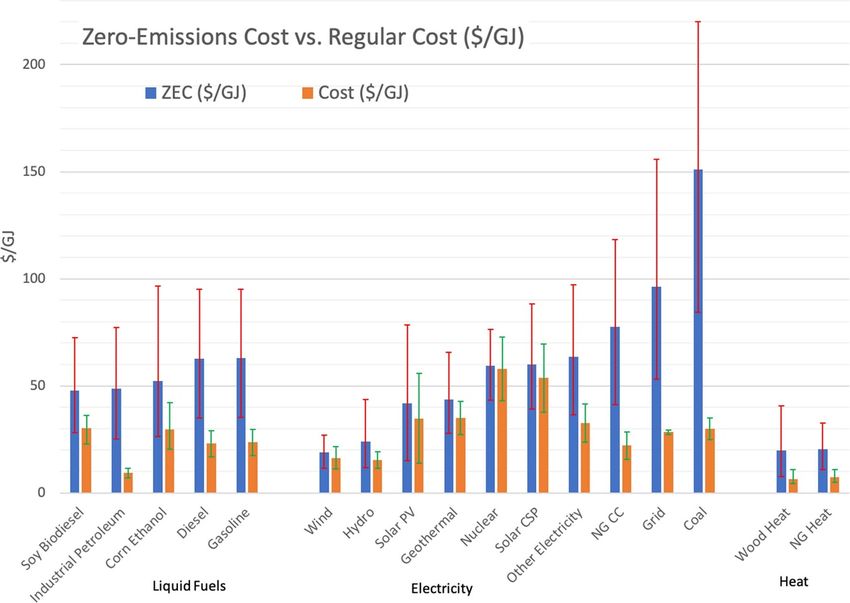
Figure 2 presents a comparison of ZEC and the ‘regular’ fuel price, XF , of a variety of liquid transport fuels,
electricity sources, and heat sources (data provided in appendix A1). As an example, the emissions for diesel
fuel include direct emissions from fuel combustion (75 kg CO2 e GJ−1 ) and indirect emissions associated
with oil-and-gas production, refining, and distribution (15 kg CO2 e GJ−1 ), yielding a total GHG of
90 kg CO2 e GJ−1 (ANL 2018, Wernet et al 2016). For a negative emissions cost of $0.44 (kg CO2 e)−1
2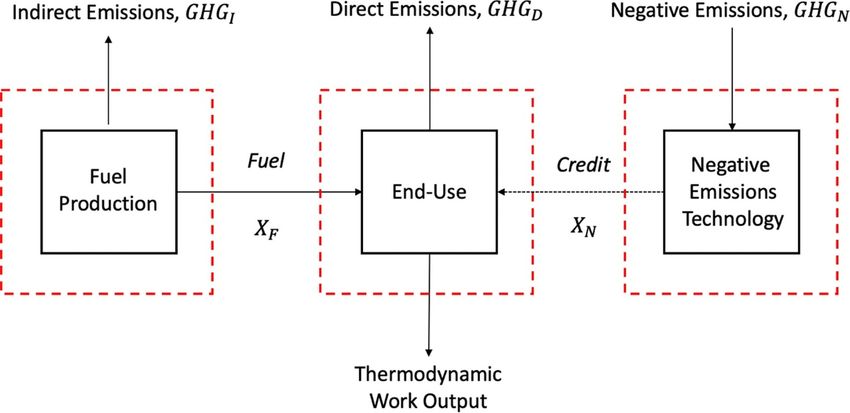
Prog. Energy 3 (2021) 023001                                                                                   C M Beal and C W King

   Figure 2. Zero-emissions cost (ZEC) and regular cost of a variety of energy sources. Error bars represent the upper and lower
   estimates for each energy source, as shown in appendices A1–A3.

(Smith et al 2016), the ZEC of diesel fuel (with retail price, Xdiesel , of $23 GJ−1 or $3.16 gal−1 (EIA 2019))
would be $63 GJ−1 or $7.60 per gasoline gallon equivalent (gge). Thus, the ZEC of diesel fuel is nearly three
times greater than the market price. The error bars in figure 2 for the regular costs represent a range of
market prices for each energy source; for example the low, mid, and high diesel prices are $17, $23, and
$29 GJ−1 ($2.30–$3.97/gal retail), respectively. The error bars for the ZEC combine the low, mid, and high
regular cost value with low, mid, and high negative emissions costs, which are estimated to be $0.22, $0.44,
and $0.66 (kg CO2 e)−1 , respectively, or 0.44 ± 50% $ (kg CO2 e)−1 . Thus, for diesel, the low, mid, and high
ZEC values are $35, $63, and $95 GJ−1 , respectively.
     Petroleum transport fuels are cheaper than biofuels (corn ethanol and soy biodiesel). However, when the
cost of negating the corresponding emissions are assigned, the ZEC of biofuels are favorable, with soy
biodiesel ($48 GJ−1 ) being cheaper than diesel ($63 GJ−1 ) and corn ethanol ($52 GJ−1 ) being cheaper than
gasoline ($63 GJ−1 ). These results suggest that using the ZEC for liquid fuel market prices would provide
economic incentives for biofuels.
     Results for electricity sources demonstrate that naturally occurring hydroelectric and wind power are the
most economical sources (when resources are available) regardless of GHG emissions, followed by natural
gas combined-cycle power plants, coal, solar photovoltaics, geothermal, concentrating solar power, and
nuclear power, respectively. However, when the externality costs of reversing emissions are monetized, all of
the non-fossil-fuel electricity sources outperform natural gas and coal fired power.
     Heat generated from natural gas (fossil fuel) is cost-competitive with that from wood (renewable fuel) for
both the ZEC and regular cost metrics, which indicates that unlike liquid fuels and electricity, implementing
the ZEC in heat markets would not necessarily benefit renewable fuel sources. The ZEC of heat (∼$20 GJ−1 )
is roughly three times greater than that of the ‘regular’ cost (∼$7 GJ−1 ) for both natural gas and wood fuels.

3.2. Total economic energy cost
While we often speak of the cost of individual fuels and energy technologies, at the scale of the entire
economy, we must consider the collective spending on all energy sources. It is the energy spending as a
fraction of gross domestic product (GDP), or X E,GDP , that provides the economy-wide feedback for growth.
Data show that (depending on how you count spending on primary energy versus secondary energy carriers)
the US and global economies have a threshold level of X E,GDP , above which economic growth is restrained.
Over the last century, the economy normally operates below this threshold level, and GDP increases. On a

                                                       3
Prog. Energy 3 (2021) 023001 C M Beal and C W King
Figure 3. U.S. energy spending in 2019 shown as the percentage of 2019 U.S. GDP, X E,GDP , attributed to the energy sector, shown
for low, mid, and high cost scenarios, with (a) ‘regular’ costs and (b) zero-emissions cost (ZEC) of each energy source.
few occasions, most prominently influenced by global oil prices, X E,GDP has risen above this threshold, and
the US and global economies have been sent into recession. Bashmakov showed that for OECD countries,
consumer purchases of energy (e.g. gasoline, residential electricity, retail natural gas) more than
approximately X E,GDP ≈ 11% would likely be associated with recession (Bashmakov 2007). King indicated
that for the US and global economies, and a X E,GDP based more closely with primary energy (e.g. oil, coal,
natural gas, and primary electricity), a US and world threshold for growth was about X E,GDP ≈ 8% (King
et al 2015). Further, Bashmakov and Myshak show that energy cost thresholds exist for individual economic
sectors, and that these are relatively constant over time (Bashmakov and Myshak 2018). They go so far as to
state a ‘rule of gravitation’ such that ‘real energy prices in each sector may grow only as much as energy
intensity declines, and inversely promoting energy efficiency can be viewed as a policy, of which the
environmental co-benefits will be undermined by rebound effects, unless it is accompanied by rising energy
prices.’
If we internalize expenditures on taxes or a price of GHG emissions from fossil fuel combustion, we can
add these expenditures to the ‘regular expenditures’ on energy to approximate a ‘zero-emissions cost’ of
energy to the economy, as described above. The question arises as to what cost per unit of GHG reversal (i.e.
$ tCO2 e−1 of negative emissions technologies), can be internalized in the economy without inhibiting GDP
growth or to reach a constant level of GDP. In this interpretation, we assume all energy sector expenditures
on GHG emissions are allocated to the energy sector to calculate total annual expenditures for energy and its
associated negative emissions. These expenditures are measured as economy-wide spending on energy
relative to GDP ($21.4 trillion, 2019), which is the important metric, not how much is spent on any
particular fuel or technology.
Figure 3 presents the percentage of GDP allocated to energy spending assuming: (a) ‘regular’ energy costs
and (b) the ZEC of energy sources—while assuming the consumed quantity of each energy source remains
the same in both scenarios. For this presentation, we have assumed that energy demands do not change
despite changes to energy prices. For each energy source, there are six possible cost values presented in
figure 2. The six columns of data presented in figure 3 are simply the six price points for each fuel from
figure 2 ($ GJ−1 ) multiplied by the total consumption of each fuel in the US in 2019 (GJ) (EIA 2020b), and
then normalized by the US 2019 GDP ($21.4 trillion) to yield a percentage of GDP ($/yr/$/yr). These data
are provided in appendices A4 and A5.
4Prog. Energy 3 (2021) 023001 C M Beal and C W King
Figure 4. Hypothetical low-carbon scenario of energy spending shown as the percentage of 2019 US GDP, X E,GDP , attributed to
the energy sector, shown for low, mid, and high cost scenarios, with (a) ‘regular’ costs and (b) zero-emissions cost (ZEC) of each
energy source.
The X E,GDP for low, mid, and high regular costs are 4.6%, 6.4%, and 8.7%, respectively. In comparison,
the X E,GDP for low, mid, and high ZEC are 10.1%, 18.6%, and 28.9%, respectively. Overall, the X E,GDP of the
ZEC scenarios are roughly 2–3 times greater than those of the regular cost scenarios, when assuming no
changes to the energy supply mix.
While figure 3 presents the impact that the ZEC would have on X E,GDP for our current energy mix,
applying the ZEC to energy markets would cause both a shift from high-to-low ZEC energy sources and a
reduction in energy demand due to higher prices. We would expect a transition away from gasoline and
diesel for transport and a shift from fossil fuels to low-ZEC renewable electricity. However, there are several
scenarios in which fossil fuels with subsequent carbon capture have a lower ZEC than renewable energy
(figure 2). For example, the Low ZEC of gasoline (∼$35 GJ−1 ) is less than the Mid ZEC of all other liquid
fuels, including biofuels, which means that cheap gasoline with subsequent negative emissions would have
no emissions and still be cheaper than biofuels. Similarly, electricity and heat from natural gas would both
remain economically competitive for low natural gas prices.
Predicting future energy mixes under different energy policies, as well as energy mixes during a
transition, is beyond the scope of this paper, but, as an example, figure 4 presents one simplified hypothetical
future energy mix in which: (a) the total amount of end-use energy remains the same (∼75 EJ), (b) the GDP
remains the same, (c) 90% of gasoline, diesel, and industrial petroleum fuels are assumed to be replaced by
electrification, (d) 100% of coal electricity and 90% if natural gas electricity are replaced by solar, wind, and
geothermal electricity, and (e) 50% of natural gas heat is displaced by renewable electricity. Maintaining the
same level of energy consumption to achieve this hypothetical scenario would require a 35-fold increase in
wind, solar, and geothermal energy over their current levels of consumption. (As an aside, in separate work,
the authors have identified energy storage as a potential limitation on renewable electricity development. In
the hypothetical scenario presented here, a significant amount of energy storage—i.e. batteries—would be
required for the system to function, and the associated added costs have not been considered in this
simplified example.) However, even with the drastic transitions in this scenario, the X E,GDP of the mid ZEC
scenario is relatively high (10.1%), which based upon historical economic feedbacks would have negative
economic impacts such as recession. Nonetheless, this hypothetical scenario implies that technologies
enabling a negative emissions cost below about $0.13 (kg CO2 e)−1 (or 130 $/tCO2 e) could theoretically
simultaneously enable present energy end-use consumption levels without economic recession (i.e. an
5Prog. Energy 3 (2021) 023001 C M Beal and C W King
economy with constant or increasing GDP with X E,GDP < 8%, calculation not shown). Of course, this
hypothetical scenario assumes no change in technology costs (up or down), no costs for energy storage, and
no reductions in energy demand via demand response methods or higher real energy prices. Bashmakov and
Myshak show that real energy prices and energy intensity are inversely related (i.e. −1 elasticity or the ‘minus
one’ concept) (Bashmakov and Myshak 2018), and thus we would expect that implementing the ZEC
framework would reduce overall energy consumption, which could be evaluated in more detail in future
modeling studies. The purpose of this example is to demonstrate the challenge of implementing the ZEC on
all energy purchases in the U.S. without causing an economic recession. Note that this perspective differs
from most IAMs that introduce carbon prices in the range of hundreds of dollars per tonne of CO2 without
considering a cost threshold (X E,GDP ) above which GDP growth and energy prices cannot be assumed
independent variables anymore (i.e. many IAMs suggest growth in GDP is independent of carbon/energy
costs) (Wilkerson et al 2015).
3.3. Conclusion
The ZEC metric represents a carbon-tax policy concept that would enable (by definition) net-zero GHG
emissions from the US energy sector. As such, it provides an aggressive, targeted pathway to eliminating GHG
emissions from energy consumption, which are the vast majority of global GHG emissions. The conceptual
premise of the ZEC metric is to charge energy users for ‘cleaning up’ the GHG emissions (waste) that they
generate—similar to charging consumers for wastewater treatment or municipal solid waste collection.
Implementing the ZEC in energy markets would cause biofuels to be cheaper than petroleum fuels and
renewable electricity to be cheaper than fossil-fuel generated electricity. As such, the calculations of this
paper could inform a low-carbon energy system transition and inspire energy policy based on the concept of
charging consumers for the waste that they generate.
There are significant barriers to implementing the ZEC in energy markets, first and foremost due to the
negative impacts that it could have on the US economy, which would make it unpopular with the US
population. Results in this study show that the energy spending as a fraction of GDP, or X E,GDP , for ‘regular’
energy prices ranges from 4.7% to 8.3%, while those for the ZEC prices for the same energy mix could range
from could range from 10% to 28%, and could cause a recession. We also showed that the ZEC could be
reduced to range from 5% to 16% for a hypothetical scenario with aggressive renewable energy adoption and
current technology prices. Thus, deploying negative GHG emissions technologies, such as direct air capture,
while continuing the consumption of otherwise unabated fossil fuels would likely be an ineffective policy due
to negative economic impacts; but possibilities exist for deploying negative GHG emissions technologies in
conjunction with a transition to low-GHG energy sources to eliminate energy sector emissions without
causing recession. Future work should consider how the energy sector, other economic sectors, and
consumers would actually respond to implementing the ZEC framework, including changes to the total
per-capita energy demand and price elasticities of energy products that could result in new energy portfolios
during and after the transition to implementing a ZEC framework. This future work likely requires dynamic
growth model frameworks that directly consider energy cost feedbacks on economic growth. Such
frameworks exist, and they generally avoid the use of equilibrium approaches while including stock and flow
consistent financial and money accounting such as in (King 2020), (Sakai et al 2019), and as discussed in
(Pye et al 2021) and (Mercure et al 2019).
The goal of this commentary is to demonstrate the importance of simultaneously promoting net-zero
GHG emissions to stop further atmospheric GHG increases, while considering the potential economic
impacts associated with devoting a significant portion of the US GDP to operating negative emissions
technologies. Future work should consider how the proposed negative-emissions industry would impact the
economy at large, such as via metrics of GDP, private debt and interest, and wages. For some, the ultimate
goal for a low-carbon society might be to develop net-zero GHG emissions energy systems without reducing
quality of life as a result of negative economic impacts. The ZEC metric provides a carbon-tax policy concept
that can help achieve these goals.
Data availability statement
All data that support the findings of this study are included within the article (and any supplementary files).
Acknowledgments
This work was supported by the US Department of Energy (Award No. DE-EE0007091).
6Prog. Energy 3 (2021) 023001 C M Beal and C W King
Appendix Zero-emissions cost data
A1. Fuel cost, XF
Table A1. Fuel costs.
Low price Mid price High price
($ MJ−1 ) ($ MJ−1 ) ($ MJ−1 ) Sources
Liquid fuels
Soy biodiesel $0.023 $0.030 $0.036 (DOE 2019)
Corn ethanol $0.020 $0.030 $0.042 (DOE 2019)
Industrial petroleum $0.005 $0.009 $0.019 (EIA 2019)
Gasoline $0.017 $0.024 $0.030 (DOE 2019, EIA 2019)
Diesel $0.017 $0.023 $0.029 (DOE 2019, EIA 2019)
Electricity
Hydroelectric electricity, reser- $0.012 $0.015 $0.019 (IRENA 2019)
voir
Wind power electricity $0.011 $0.016 $0.022 (Lazard 2018)
Solar PV large scale electricity $0.014 $0.035 $0.056 (Lazard 2018)
Solar CSP $0.038 $0.054 $0.070 (Lazard 2018)
Geothermal electricity $0.027 $0.035 $0.043 (Lazard 2018)
Other electricity $0.024 $0.033 $0.042 (EIA 2020a)
Nuclear power electricity $0.043 $0.058 $0.073 (Lazard 2018)
Natural gas CC electricity $0.016 $0.022 $0.028 (Lazard 2018)
Grid electricity $0.027 $0.028 $0.029 (EIA 2020a)
Coal fired electricity $0.025 $0.030 $0.035 (Lazard 2018)
Heat
Wood heat $0.004 $0.007 $0.011 (Beal et al 2018)
Natural gas heat $0.005 $0.007 $0.011 (EIA 2020c)
A2. Negative emissions required to offset lifecycle GHG emissions, GHGN
Table A2. Greenhouse gas emissions in g CO2 e MJ−1 .
Low Med High Sources
Liquid fuels
Soy biodiesel 24 40 55 (ANL 2018, Chen et al 2018)
Corn ethanol 27 52 82 (Wernet et al 2016, ANL 2018, Lewandrowski
et al 2020)
Industrial petroleum 83 90 100 (Wernet et al 2016, ANL 2018, Masnadi et al
2018)
Diesel 83 90 100 (Wernet et al 2016, ANL 2018, Masnadi et al
2018)
Gasoline 82 89 99 (Wernet et al 2016, ANL 2018, Masnadi et al
2018)
Electricity
Hydroelectric electricity, reservoir 2 6 8 (Nugent and Sovacool 2014, Wernet et al 2016,
Chipindula et al 2018)
Wind power electricity 2 19 37 (Wernet et al 2016, Almeida et al 2019)
Solar PV large scale electricity 6 16 34 (Nugent and Sovacool 2014, Wernet et al 2016)
Solar CSP 7 14 28 (Wernet et al 2016)
Geothermal electricity 3 20 35 (Wernet et al 2016, Eberle et al 2017)
Other electricity 58 70 84 Average estimate
Nuclear power electricity 1 3 6 (Warner and Heath 2012, Wernet et al 2016)
Natural gas CC electricity 116 126 136 (Odeh and Cockerill 2008, Singh et al 2011,
Wernet et al 2016)
Grid electricity 117 154 192 (Wernet et al 2016)
Coal Fired electricity 270 275 281 (Wernet et al 2016)
Heat
Wood heat 15 30 45 (Wernet et al 2016)
Natural gas heat 27 30 33 (Wernet et al 2016)
7Prog. Energy 3 (2021) 023001 C M Beal and C W King
A3. Cost of negative emissions, XN
Table A3. Cost of negative emissions in $/t CO2 e (Sanz-Pérez et al 2016, Smith et al 2016).
Low Med High
220 440 660
A4. Contributions to energy spending, regular costs
Table A4. Contributions to energy spending for various energy products, regular costs.
2019 US consumption
Fuel (GJ) Low cost ($billions) Mid cost ($billions) High cost ($billions)
Soy biodiesel 2.29E + 08 $5.23 $6.91 $8.28
Industrial petroleum 1.30E + 10 $90.80 $121.06 $151.33
Corn ethanol 1.09E + 09 $22.24 $32.11 $45.65
Diesel 8.53E + 09 $143.93 $197.97 $248.43
Gasoline 1.72E + 10 $298.56 $405.83 $511.81
Wind power electricity 1.08E + 09 $12.05 $17.66 $23.27
Hydroelectric electricity 9.85E + 08 $11.37 $15.16 $18.95
Solar PV electricity 3.75E + 08 $5.19 $13.04 $20.89
Geothermal electricity 5.76E + 07 $1.57 $2.02 $2.46
Nuclear power electricity 2.91E + 09 $125.51 $168.66 $211.81
Solar CSP electricity 1.16E + 07 $0.44 $0.62 $0.81
Other electricity 3.55E + 08 $8.39 $11.59 $14.78
Natural gas electricity 5.69E + 09 $89.79 $125.93 $162.07
Coal fired electricity 3.48E + 09 $86.95 $104.34 $121.73
Wood heat 2.53E + 09 $11.13 $16.47 $27.83
Natural gas heat 1.87E + 10 $94.99 $137.60 $203.47
Total 7.63E + 10 $1008 $1377 $1774
GDP, 2019 ($ billions) $21 428 4.70% 6.43% 8.28%
A5. Contributions to energy spending, zero-emissions costs
Table A5. Contributions to energy spending for various energy products, zero-emissions costs.
2019 US consumption
Fuel (GJ) Low cost ($billions) Mid cost ($billions) High cost ($billions)
Soy biodiesel 2.29E + 08 $6.46 $10.93 $16.63
Industrial petroleum 1.30E + 10 $327.10 $633.74 $1006.19
Corn ethanol 1.09E + 09 $28.58 $56.70 $104.73
Diesel 8.53E + 09 $299.45 $535.28 $810.67
Gasoline 1.72E + 10 $609.79 $1081.27 $1638.51
Wind power electricity $12.43 $20.60 $29.01 $12.43
Hydroelectric electricity $11.77 $23.57 $42.97 $11.77
Solar PV electricity $5.67 $15.65 $29.41 $5.67
Geothermal electricity $1.61 $2.51 $3.79 $1.61
Nuclear power electricity $126.16 $172.98 $222.82 $126.16
Solar CSP electricity $0.45 $0.69 $1.02 $0.45
Other electricity $12.93 $22.59 $34.49 $12.93
Natural gas electricity $234.88 $441.53 $673.63 $234.88
Coal fired electricity $293.29 $525.36 $765.76 $293.29
Wood heat 2.53E + 09 $19.50 $49.94 $103.14
Natural gas heat 1.87E + 10 $206.59 $385.60 $612.67
Total 7.63E + 10 $2197 $3979 $6095
GDP, 2019 ($ billions) $21 428 10.25% 18.57% 28.45%
8Prog. Energy 3 (2021) 023001 C M Beal and C W King
ORCID iDs
Colin M Beal https://orcid.org/0000-0001-7125-2254
Carey W King https://orcid.org/0000-0001-6177-5385
References
Almeida R M et al 2019 Reducing greenhouse gas emissions of Amazon hydropower with strategic dam planning Nat. Commun. 10 4281
ANL 2018 Greenhouse Gases, Regulated Emissions, and Energy Use in Transportation (GREET) Model, Version GREET1_2018 (Argonne
National Laboratory) (https://greet.es.anl.gov/)
Bashmakov I 2007 Three laws of energy transitions Energy Policy 35 3583–94
Bashmakov I and Myshak A 2018 ‘Minus 1’ and energy costs constants: sectorial implications J. Energy 2018 8962437
Beal C M, Archibald I, Huntley M E, Greene C H and Johnson Z I 2018 Integrating algae with bioenergy carbon capture and storage
(ABECCS) increases sustainability Earths Future 6 524–42
Chen R, Qin Z, Han J, Wang M, Taheripour F, Tyner W, O’Connor D and Duffield J 2018 Life cycle energy and greenhouse gas emission
effects of biodiesel in the United States with induced land use change impacts Bioresour. Technol. 251 249–58
Chipindula J, Botlaguduru V, Du H, Kommalapati R and Huque Z 2018 Life cycle environmental impact of onshore and offshore wind
farms in Texas Sustainability 10 2022
DOE 2019 Retail Fuel Prices with Electricity (https://afdc.energy.gov/data/10326)
Eberle A, Heath G, Nicholson S and Carpenter C 2017 National Renewable Energy Laboratory Systematic Review of Life Cycle
Greenhouse Gas Emissions from Geothermal Electricity (https://doi.org/10.2172/1398245)
EIA 2019 Monthly Energy Review, December 2019 (available at: www.eia.gov/totalenergy/)
EIA 2020a Electric Power Monthly (available at: www.eia.gov/electricity/monthly/)
EIA 2020b Monthly Energy Review (Total Energy) (available at: www.eia.gov/totalenergy/)
EIA 2020c Natural Gas Prices (available at: www.eia.gov/naturalgas/)
Fuss S, Flachsland C, Koch N, Kornek U, Knopf B and Edenhofer O 2018 A framework for assessing the performance of cap-and-trade
systems: insights from the European Union emissions trading system Rev. Environ. Econ. Policy 12 220–41
Goulder L H and Schein A R 2013 Carbon taxes versus cap and trade: a critical review Clim. Change Econ. 04 1350010
IPCC 2014 Climate Change 2014: Synthesis Report (available at: www.ipcc.ch/report/ar5/syr/)
IRENA 2019 Hydropower (available at: www.irena.org/hydropower)
King C W 2020 An integrated biophysical and economic modeling framework for long-term sustainability analysis: the HARMONEY
model Ecol. Econ. 169 106464
King C, Maxwell J and Donovan A 2015 Comparing world economic and net energy metrics, part 2: total economy expenditure
perspective Energies 8 12975–96
Kotchen M J, Turk Z M and Leiserowitz A A 2017 Public willingness to pay for a US carbon tax and preferences for spending the revenue
Environ. Res. Lett. 12 094012
Lazard 2018 Lazard’s Levelized Cost of Energy Analysis—Version 12.0 (available at: www.lazard.com/perspective/levelized-cost-of-energy-
and-levelized-cost-of-storage-2020/)
Lewandrowski J, Rosenfeld J, Pape D, Hendrickson T, Jaglo K and Moffroid K 2020 The greenhouse gas benefits of corn
ethanol—assessing recent evidence Biofuels 11 361–75
Masnadi M S et al 2018 Global carbon intensity of crude oil production Science 361 LP 851–3
Mercure J-F, Knobloch F, Pollitt H, Paroussos L, Scrieciu S S and Lewney R 2019 Modelling innovation and the macroeconomics of
low-carbon transitions: theory, perspectives and practical use Clim. Policy 19 1019–37
Nordhaus W D 1977 Economic growth and climate: the carbon dioxide problem Am. Econ. Rev. 67 341–6
Nugent D and Sovacool B K 2014 Assessing the lifecycle greenhouse gas emissions from solar PV and wind energy: a critical meta-survey
Energy Policy 65 229–44
Odeh N A and Cockerill T T 2008 Life cycle GHG assessment of fossil fuel power plants with carbon capture and storage Energy Policy
36 367–80
Pigou M A 1920 The Economics of Welfare (London: Macmillan)
Pye S et al 2021 Modelling net-zero emissions energy systems requires a change in approach Clim. Policy 21 222–31
Rockström J, Gaffney O, Rogelj J, Meinshausen M, Nakicenovic N and Schellnhuber H J 2017 A roadmap for rapid decarbonization
Science 355 LP 1269–71
Sakai M, Brockway P E, Barrett J R and Taylor P G 2019 Thermodynamic efficiency gains and their role as a key ‘engine of economic
growth’ Energies 12 110
Sanz-Pérez E S, Murdock C R, Didas S A and Jones C W 2016 Direct capture of CO2 from ambient air Chem. Rev. 116 11840–76
Singh B, Strømman A H and Hertwich E 2011 Life cycle assessment of natural gas combined cycle power plant with post-combustion
carbon capture, transport and storage Int. J. Greenh. Gas Control 5 457–66
Smith P et al 2016 Biophysical and economic limits to negative CO2 emissions Nat. Clim. Change 6 42–50
Sumner J, Bird L and Dobos H 2011 Carbon taxes: a review of experience and policy design considerations Clim. Policy 11 922–43
Warner E S and Heath G A 2012 Life cycle greenhouse gas emissions of nuclear electricity generation J. Ind. Ecol. 16 S73–92
Wernet G, Bauer C, Steubing B, Reinhard J, Moreno-Ruiz E and Weidema B 2016 The ecoinvent database version 3 (part I): overview
and methodology Int. J. Life Cycle Assess. 21 1218–30
Wilkerson J T, Leibowicz B D, Turner D D and Weyant J P 2015 Comparison of integrated assessment models: carbon price impacts on
U.S. energy Energy Policy 76 18–31
WRI 2020 Greenhouse Gas Emissions (available at: www.wri.org/resources/data-visualizations/world-greenhouse-gas-emissions-2016)
9You can also read