H1 2020 results presentation - easyJet plc
←
→
Page content transcription
If your browser does not render page correctly, please read the page content below
H1 2020 results presentation

introduction
Johan Lundgren – CEO
easyJet - Positioned to win
easyJet has been decisive in meeting the challenges of Coronavirus to ensure we can manage a
prolonged grounding by:
1. Cutting costs
2. Delivering vastly reduced capex while retaining excellent fleet flexibility
3. Securing c.£2bn additional funding, in addition to the equity raise announced today
Strong liquidity position, testimony to the strength of easyJet + its investment grade balance
sheet
easyJet will be leading the recovery:
1. Strong H1 performance prior to COVID impact
2. Trusted easyJet brand outperforms competitors in value for money and drives customer confidence
3. easyJet’s industry leading network of European primary airports
4. Cost-out programme to deliver sustainable cost savings
Competitively positioned as a more efficient airline to take advantage
of opportunities in the European short haul market
3
3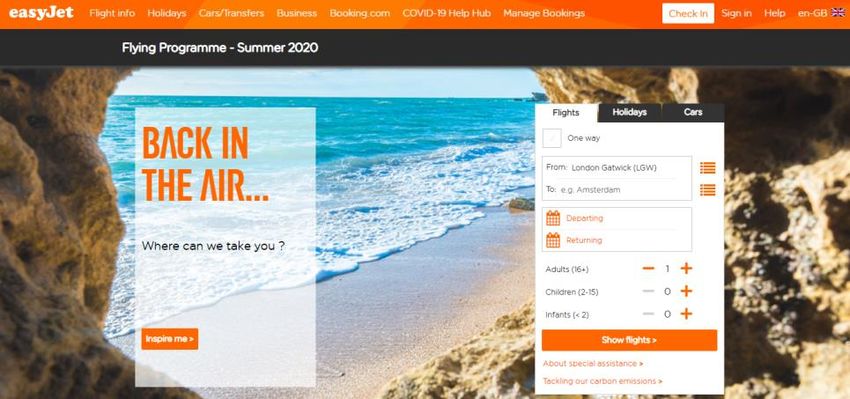
Financial review
Andrew Findlay – CFO
response to coronavirus                                                                        Current cash
                                                                                                 position
                                                                                              (as @ 22 June)
                                           Maximise
                                           liquidity                                          £2.4bn
                                                                                     Does not include funding from:
                                                                                       •   equity raise + £400m to £450m
                                                                                       •   SLB transactions still to complete
                                                                                           + c.£300m

       Cost Reductions &                                                             Additional funding
        Payment Terms                           Fleet Deferrals              • Delivered c.£300m from SLB
• c. 70% decrease in operating cost   • Deferred 24 aircraft deliveries to     transactions so far, with final
  cash burn during grounding            post 2025                              transactions to leave us at the top
• Payment term extensions             • Increased short term flexibility       end of the £500m-£650m range
  negotiated with many of our major   • Drove re-timing of pre delivery      • Accessed a further £1.4bn in funding
  suppliers                             payments                               through; CCFF, RCF & term loans

                                                                                                                            5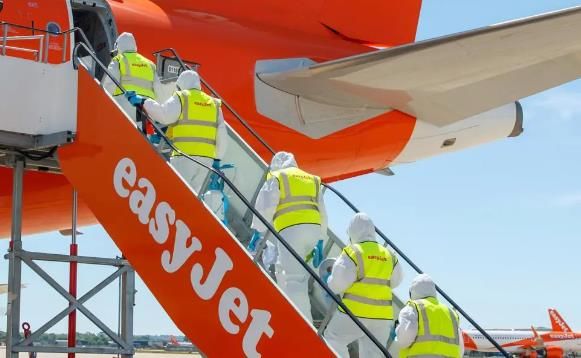
Scenario planning - Updated
                  Total cash burn scenarios*

                                                                                      3 months                6 months
Scenario assumptions:                                                                 grounding               grounding
•   Refunds vs voucher/rebook ratios continue at a similar rate as those seen         £1.0bn                  £2.1bn
    to date
•   FX and fuel rates based on spot price as at 25th May ’20
•   Assumes no material change to card acquirer arrangements

Highlights:
                                                                                                                  Revenue/refunds
•   Cash burn slightly better than April forecast:
      •   3mth by c.£0.2bn, 6mth by c.£0.1bn, 9mth unchanged                                                      AP/AR unwind

•   Cash contributing flying programme resumed after 11 weeks, ahead of our 3 month               9 months         Total Capex
                                                                                                                  Capital
                                                                                                                  (Inc fleet, other , IFRS16 &
    grounding base case scenario                                                                  grounding
                                                                                                                  maintenance )
•   Additional sources of funds continue to be explored to further boost liquidity                £3.0bn          Operating costs
•   Additional management actions being undertaken including business wide cost out
    programme to improve free cashflow generation

                      * Starting point of 1st April 2020
                                                                                                                                         6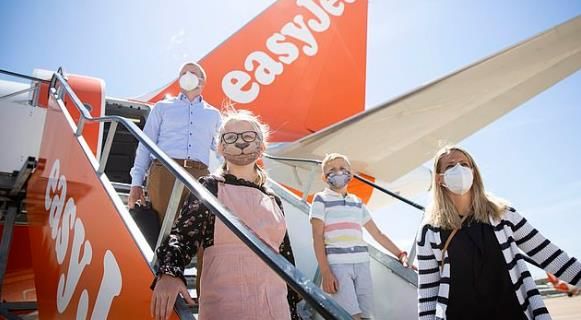
proposed equity placing
                                  > Firm placing of up to 9.99% of issued share capital
                                  > Additional placing of up to 5% of issued share capital, conditional on shareholder approval
         EQUITY PLACING             (ordinary resolution)
                                  > Allocations expected to be split proportionally between the two placings
                                  > Expected gross proceeds c.£400m - £450m

                                  > Transaction launched 24 June after market close, settlement of firm placing 29 June (T+2)
             TIMING
                                  > General meeting to be held 14 July, settlement of conditional placing 15 July (T+14)

JOINT GLOBAL COORDINATORS &       > BNP Paribas
    JOINT BOOKRUNNERS             > Credit Suisse Securities (Europe) Limited

    EASYJET PLC SHARE LOCK-UP     > 180 day post-admission share lock-up for the Company, subject to customary exceptions

•    Proceeds will further enhance easyJet’s liquidity position and credit metrics, underpinning our balance
     sheet which is one of the strongest in the industry
•    Expected cash balance following the equity placing and final SLB proceeds to be in excess of c.£3bn,
     providing significant liquidity buffer to navigate further grounding or protracted recovery scenarios

                                                                                                                                  7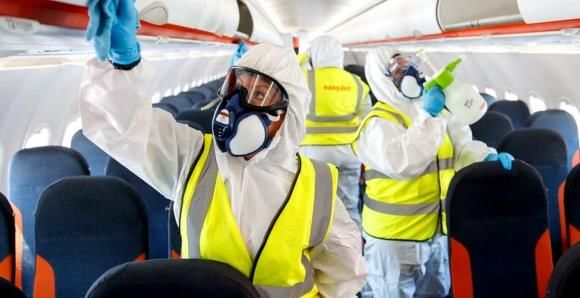
Key performance indicators
                                                               H1 2020   H1 2019   Change*
 Seats flown (m)                                                  42.7     46.2      (7.6)%
 Passengers (m)                                                   38.6      41.6     (7.4)%
 Load factor (%)                                                90.3%     90.1%    +0.2ppt
 Average sector length (km)                                     1,095     1,068       2.5%

 Revenue per seat - reported currency (£)                        55.60     50.71      9.6%
 Revenue per seat - constant currency (£)                        55.87     50.71     10.2%

 Headline cost per seat incl fuel - reported currency (£)        59.75    56.66      (5.5)%
 Headline cost per seat incl fuel - constant currency (£)        60.75    56.66      (7.2)%

 Headline cost per seat excl fuel - reported currency (£)        47.24    43.64      (8.2)%
 Headline cost per seat excl fuel - constant currency (£)        47.80    43.64      (9.5)%

                   *Favourable/(adverse)
                   Per seat metrics exclude easyJet Holidays
                                                                                              8
Financial performance
                                                 H1 2020   H1 2019   Change*

                                                    £m        £m         £m
 Total revenue                                   2,382     2,343         39
 Headline costs:
      Headline costs excluding fuel              (2,041)   (2,016)      (25)
      Fuel                                        (534)     (602)        68
 Headline loss before tax                          (193)    (275)        82
 Headline loss before tax at constant currency    (224)     (275)         51
 Non-headline items:
     Sale and leaseback gain                           1         2        (1)
     Brexit-related costs                              -       (4)         4
     Commercial IT platform                            -         2       (2)
     Balance sheet foreign exchange gain               3         3          -
     Fair value adjustment                         (164)         -     (164)
 Total loss before tax                            (353)     (272)       (81)

                 *Favourable/(adverse)                                          9
Revenue performance                                      Reported RPS +9.6%

                                            RPS @ CC +10.2%
                                                           +8.3%            -1.2%
                                                                            (£0.61)                    -0.6%
                                                                                           £55.87
                                                                                                       (£0.27)       £55.60
                                                                                                                                           c.18k
                                                                                                                                    Flights cancelled in
                                                                                                                                       March due to
                                                           £4.20
                                                                                                                                        Coronavirus

                                                                                                                                       c.£0.2bn
                                           +2.0%

                                            £1.01
                                                                                                                                      Impact on total
                       +1.1%                                                                                                             revenue
                       £0.56
     £50.71

H1 2019 Reported   Thomas Cook           Ancillary   Underlying Trading   Coronavirus   H1 2020 @ CC     FX      H1 2020 Reported
                   Administration

                        Excludes easyJet Holidays                                                                                                          10
HEADLINE cost PER SEAT
Headline CPS ex fuel
Headline CPS @ CC = 7.2%
@ cc +9.5%, of which:
Headline CPS ex fuel @ CC = 9.5%
c.5.0% underlying
£0.66 £0.11 £0.15 £60.81 £0.06 £60.75 £1.00 • In line with guidance
£0.99 • Lower capacity growth
£59.75 for the half
£1.22 • Ongoing, regulatory and
inflationary pressure
£1.32 • Ownership costs
• Crew pay higher
£56.66
retention levels
H1 2019 Overheads Maintenance Ownership
headline and Other
Crew Airports, Navigation H1 2020
ground headline
Fuel H1 2020
headline
P&L FX H1 2020
headline
c.4.5% Coronavirus:
cost per Income handling cost per cost per cost per • Cancellations
seat and other
operating
seat @ CC
before fuel
seat @ CC seat
• Full pilot & crew rosters
costs variance through March
* Operational price increases including unregulated airports, ground handling, navigation and crew costs
Excludes easyJet Holidays 11Impact of fuel & currency
H1 2020 fuel impact H1 2020 H1 2019 Change*
Fuel $ per metric tonne
Market rate 563 650 87
Effective price 638 645 7
US dollar rate
Market rate 1.28 1.29 1 cents
Effective price 1.34 1.31 (3 cents)
Difference between market rate and effective rate 0.06 0.02
Actual cost of fuel £ per metric tonne 476 493 17
H1 2020 currency impact on headline PBT* EUR CHF USD Other Total
£m
Revenue (2) (1) - (10) (13)
Fuel 2 - 17 - 19
Headline costs excluding fuel 25 (3) 2 1 25
Total 25 (4) 19 (9) 31
*Favourable /(adverse)
12Cash FLOW bridge Net debt: £467m
365 18 (H1 19: £201m)
20 114
1,854
174
262
1,576
452
2 1,388
173 111 19
Cash & MMC at Operating loss Depn & amort Net working Other operating Tax paid Ordinary Cash & MMDs Sale & leaseback Cash Capex Repayment of Restricted case, FX
30 September capital Dividend (FY19) post div & tax proceeds capital element own shares and Cash & MMD at
2019 paid of leases net interest 31 March 2020
Cash generated from operations Investing and financing
(excl. dividends): £472m
13balance sheet 31 March 31 March 30 September
£m 2020 2019 2019
Goodwill and other intangible assets 613 551 561
Property, plant and equipment 4,823 4,286 4,661
Right of use assets 468 572 502
Derivative financial instruments (554) 48 63
Equity Investments 33 54 48
Other assets (excluding cash and money market deposits) 662 484 542
Unearned revenue** (974) (1,726) (1,069)
Trade and other payables (1,660) (817) (1,050)
Other liabilities (excluding debt) (852) (735) (947)
Capital employed 2,559 2,717 3,311
Cash and money market deposits* 1,388 1,280 1,576
Debt (excluding lease liabilities) (1,319) (858) (1,324)
Lease Liabilities (536) (623) (578)
Net debt (467) (201) (326)
Net assets 2,092 2,516 2,985
*Excludes restricted cash
**Unearned revenue relating to departing flights in April and May has been reclassified as trade and other payables
14Utilising flexibility in Fleet
360
• Deferred 24 aircraft deliveries Current contractual Max
to beyond 2025 350 350
337
• Leads to re-timing of pre delivery 340 3351
New Plan Max2
payments 328 (excludes potential,
330 326 opportunistic fleet additions)
327
• Utilising flexibility of 24 320
operating leases due for 310
renewal over the coming 305
300 302
period
290 Current plan expects easyJet will
be at 302 aircraft by Y/E 2021.
• Post completing SLB 280
programme, around 50% of 281
272
fleet still unencumbered, 270
New Plan Min
leaving further funding options 260
Current fleet 2020 2021 2022 2023
available As @ 16/4
1) 335 aircraft in 2020 new plan is subject to the sale/exit of 6 old aircraft
2) Chart shows contractual arrangements with Airbus and current lessors but excludes any future potential, opportunistic fleet additions 15Gross capital expenditure £1,400m
1,400
New Aircraft Maintenance Guidance range
1,200
Lease payments Other
1,000
£900m
800
600 £600m £600m £600m
£400m
400
200
0
HY'20
H2’20 FY'21 FY'22 FY'23
16Fuel and foreign exchange hedging
Fuel Hedging and Ineffectiveness
• Pre Covid-19 fuel was 71% hedged @ $654/MT for FY20 and 51% hedged for FY21 @ $638/MT
• At H1 FY20 a charge of £164m was recorded as hedge ineffectiveness largely driven by over hedged amounts
on Jet Fuel and foreign exchange related to H2 FY20 period
• This will have a further impact in H2 2020
• Over-hedged amounts likely to cause degree of volatility in income statement until maturity and were included
as part of our scenario planning
Current Hedge Position
• Additional Jet hedging temporarily paused for time periods from April 2020 through to October 2021
• Jet Fuel hedging continues for later time periods, to take advantage of the low-price environment.
• FY22 jet fuel requirement is currently 35% hedged @ $513/MT
17ceo update Johan Lundgren – CEO
easyJet is back flying!
Expected ramp up for Summer 2020
Europe with confidence
Forecast Peak Operating Aircraft1
155 147
Early signatory to EASA’s
Aviation Industry Charter for
COVID-19: 85
• To ensure passengers are
aware of measures taken 10
• To avoid people with June July August September
symptoms arriving at
airports
• To reduce the risk of
transmission:
• Within airports
• At point of boarding
• Whilst on board
1) Equivalent aircraft operating based on average utilisation. Due to constraints in building the schedule, actual utilisation may be lower
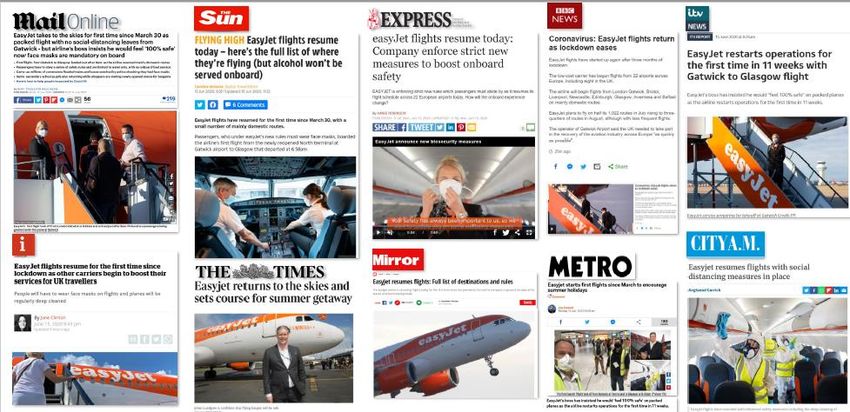
and require a higher number of aircraft to operate the equivalent schedule 19easyJet’s first day back!
20Safety is always our #1 priority
Safety for our crew & customers
Have implemented a number of Bio-security
measures:
• Daily disinfection process which provides
surface protection from viruses that lasts for at
least 24 hours
• All passengers and crew required to wear masks
onboard at all times
• Bistro and Boutique service will not be available
on initial flights
easyJet aircraft are already fitted with state of art
filtration technology, filters 99.97% of airborne
contaminants in the cabin including viruses & bacteria
21easyJet - leading the recovery
1. Short-haul recovery ahead of long-haul Worth– UK1
79
78
• Lower government restrictions impact 76
74
• Greater consumer confidence to travel 73 72
69
• Leading network offer 66
2. Consumers will seek value in response to weaker
60
economic conditions
• 2008/9 downturn showed a 9% shift in customers easyJet Jet2 Norweigan Flybe Vueling Lufthansa Wizz Air British Ryanair
Airways
trading down to better value
Price– UK1
• easyJet provides customers with the leading value 84
versus the competition
73
3. Leisure travel to return before business 65 63
• 89% of consumers first trip will be for leisure2 58 57
52
• 68% of leisure customers expect to fly the same 48
45
amount or more (versus 27% for business customers)
British LufthansaNorweigan Vueling Jet2 Flybe easyJet Ryanair Wizz Air
Airways
1) UK survey data- Worth is the proportion of survey respondents selecting “Worth more than it costs” .Price is the average
score achieved on a 7 point scale converted to a percentage of the maximum score of 7 (Costs the most) 22
2) KPMG Nunwood Relationship survey we run weekly. This is up to 1st June 2020.Our plan – delivering our strategy
Seamlessly connecting Europe
with the warmest welcome in the sky
#1 or #2 in Winning our
Value by Innovating The right
primary customers’
efficiency with data people
airports loyalty
23#1 or #2 in
Market leading network primary airports
Leading positions in major European cities
easyJet’s network 2019 Top 50 European cities by GDP/capita1. Bubbles represent easyJet touching capacity3.
provides a competitive Base ranking 1 2 Other / Non base
advantage that can not 160
easily be replicated 140
Basel
Frankfurt
120 Geneva Paris
GDP/capita ($ 000s)
Edinburgh
Our scale in key cities 100 Dublin
Amsterdam
across Europe can not be 80 Hamburg London
matched Bristol Lyon
Zurich
Stockholm
60
Rotterdam Milan
40 Vienna
Belfast Madrid
We will retain fleet Glasgow Nice
Warsaw
Manchester Berlin
Prague
20 Toulouse
flexibility to respond and Newcastle
seek advantage 0
0.0 0.5 1.0 1.5 2.0 2.5 3.0 3.5 4.0 4.5 5.0 5.5 6.0 6.5 9.5 10.0
Population (m)
1) Source: Oxford Economics Global Travel Service city forecast CY2019
2) Source: CY 2019 actuals (TM1) 24#1 or #2 in
Network strength enables profitable flying primary airports
The strong network enables Profitability by base
easyJet to be efficient with its Scale allows capacity to be adjusted to Candidates for capacity
network choices, with an absolute match demand and opportunistic growth reduction / closure
Contribution per block hour by base
emphasis on maximising returns illustrative
Competitors reducing capacity in
key markets will present
opportunities to improve
performance
We retain the flexibility to
respond and seek advantage
1 2 3 4 5 6 7 8 9 10 11 12 13 14 15 16 17 18 19 20 21 22 23 24 25 26 27 28 2930
Base profitability rank
Sources: easyJet fleet plan and network base plan, FY21, Contribution based on YTD March 31st 2020
25Winning our
easyJet – driving customer confidence customers
loyalty
As demand returns, consumers will easyJet is the leading low cost airline
move to trusted brands in terms of trust by market2
Factors important to booking the next flight after social distancing 1st 2nd 3rd
restrictions are lifted1.
UK +21 pts
Brand trust 34%
France +17 pts
Price 29%
Switzerland +32 pts
Change policy 15% Germany +8 pts
Flight schedule 12% Italy tie
Netherlands +5 pts
Loyalty program 11%
Portugal ” tie
Customers trust easyJet more than other low cost carriers
1) PwC Traveller Sentiment Survey, May 2020, Base 1,005, Q. When planning to book your next flight / hotel, please rank the following factors based on importance to you, once
the social distancing recommendations are lifted. 26
2) Trust survey 2020. % of respondents naming each airline as trustworthyWinning our
Easyjet holidays
• Positive impact of easyJet actions
customers
loyalty
o Cost focus at the airline creates value in Holidays
o Provides customers with confidence to travel
• No capacity constraints from cuts at airline
• Variable cost base
c.65%
o Very low fixed costs of disrupted pax W’20, launched March
o No commitments rebooking
vs refund • Added Egypt for winter
• We have seen a significant shift in hoteliers sun
seeking a relationship with easyJet
S’21, launched March
• Position of financial strength, particularly relative to • Initial indications are
other tour operators and OTA’s positive
27Value by
Value by efficiency efficiency
Cost-out Programme Driving operational efficiency
A major cost-out program has been launched • Swift action in March / April to reduce
to respond to COVID19 to: operational cash burn
• Drive cash generation
• Proposed staff reduction by up to 30%
• ensure easyJet emerges with a cost
competitive position • Simpler airport handling to drive lower costs
• Tactical and sustainable cost savings across • Bringing some maintenance in-house at lower
the entire business cost
• Delivered over 18-24 months
• Accelerating lease returns with MRO deals done
Target of delivering around
• Fuel efficiency program driven by sustainability
FLAT CPS ex fuel @ cc*
• Focus to make Gatwick London’s best product
FY’21 vs FY’19
* Assumes – No further spike of COVID-19 across EU, - Airline only
28Leading Sustainability position
Sustainability front of mind for customers
2%
Thinking about sustainability MORE than before
40%
Thinking about sustainability the SAME as before
Thinking about sustainability LESS than before
Tackling carbon emissions
58%
easyJet were the world’s 1st major
airline to operate net zero carbon
flights across our entire network,
by offsetting the carbon emissions
from the fuel used for all of our
flights. We continue to work to > The importance of sustainability has increased following
minimise the carbon impact of our the pandemic, with 98% thinking about the environment /
operations sustainability the same or more than before
*Publicis sapient survey, sample size 29Forward looking
• Q4 2020 capacity – c.30%:
• Encouraging booking numbers for easyJet holidays
• easyJet expects to deliver c. FLAT CPS ex fuel at cc in FY’21 vs FY’19
• At this stage, given the level of continued uncertainty, it is not possible to
provide financial guidance for the remainder of the FY20 financial year.
30easyJet - Positioned to win
Decisive action undertaken as soon as the crisis began:
• Minimised cash burn
• Maximised liquidity with cost reductions, fleet deferrals and additional funding
• Equity raise under way
Investment-grade balance sheet, one of the strongest in the industry
easyJet leading the recovery:
• Strong H1 performance
• Trusted easyJet Brand drives confidence in European travellers
• easyJet’s industry leading network of primary airports allows a disciplined approach to delivering
profitable flying
• Cost-out programme to deliver around Flat CPS ex Fuel @cc in FY’21 vs FY19
easyJet will be leading the post COVID-19 recovery
31Q&a
appendix
Loss after tax
 £m                                      H1 2020         H1 2019        Change*

 Headline loss before tax                      (193)           (275)         29.8%
 Headline tax (charge)/credit                      (1)             54      (101.8%)
 Headline loss after tax                       (194)           (221)          12.2%

 Total loss before tax                         (353)           (272)        (29.8%)
 Total tax credit                                  29              54       (46.3%)
 Total loss after tax                          (324)           (218)       (48.6%)

 Total effective tax rate                      8.3%            19.7%        11.4ppt

                * Favourable/(adverse)                                                34
Revenue total and per seat
Total Group reported
H1 2020 H1 2019 Change*
Passenger revenue 1,833 1,824 0.5%
Ancillary revenue 549 519 5.7%
Total revenue 2,382 2,343 1.7%
£ Airline per seat Airline
H1 2020 H1 2019 Change*
Passenger revenue 42.93 39.48 8.7%
Ancillary revenue 12.67 11.23 12.8%
Total revenue 55.60 50.71 9.6%
£ Airline per seat @CC Airline
H1 2020 H1 2019 Change*
Passenger revenue 43.15 39.48 9.3%
Ancillary revenue 12.72 11.23 13.3%
Total revenue 55.87 50.71 10.2%
*Favourable/(adverse) 35Headline cost per seat Cost per seat Variance at Variance at
Weighted
variance at
excluding constant constant
constant Drivers
fuel currency* currency*
currency*
£ £ %
%
• Annualised increases in charges at regulated and non
Airports and ground handling 16.65 (0.11) (0.6%) (0.3%) regulated airports
• Annualised ground handling contract in the UK
• Pay increases
Crew 9.32 (0.66) (7.5%) (1.5%) • Low attrition
• Low productivity in March 2020
Ownership 6.58 (0.99) (17.8%) (2.3%) • Increase in depreciation due to new aircraft purchased
• Increased disruption costs
Overheads & other income 6.65 (1.32) (24.7%) (3.0%)
• Loss on sale of EU ETS allowances
Navigation 3.57 0.15 4.1% 0.4% • Decrease in rates from Eurocontrol
• Engine provision catch up
Maintenance 4.47 (1.22) (36.8%) (2.8%)
• Increase in base maintenance
Total Headline CPS excluding fuel 47.24 (4.15) (9.5%) (9.5%)
Fuel 12.51 0.07 0.5%
Total Headline CPS 59.75 (4.08) (7.2%)
*Favourable/(adverse) 36Fleet breakdown H 1 2020 FY 2019 Change
A319 (Leased) 64 56 8
A319 (owned) 59 69 (10)
A319 Total 123 125 (2)
A320 (Leased) 43 43 0
A320 (owned) 160 157 3
A320 Total 203 200 3
A321 (owned/Total) 11 6 5
Total fleet 337 331 6
Leased 107 99 8
Number unencumbered 230 232 (2)
Percentage of A320s in fleet 60% 60% 0ppt
Average seats per aircraft 176 175 1%
37Return on Capital Employed
H1 2020 H1 2019
Headline loss before interest and tax (174) (255)
UK corporation tax rate 19% 19%
Normalised headline operating loss after tax (NOPAT) (141) (207)
Average shareholders’ equity 2,539 2,849
Average net debt 397 168
Average adjusted capital employed 2,936 3,017
Headline Return on capital employed (4.8)% (6.8)%
38Non-headline items
H1 2020 H1 2019 Change* Description
£m £m £m
The sale and leaseback of 10 A319 aircraft in both years resulted in a
Sale and leaseback gain 1 2 (1)
profit on disposal of the assets.
Cost of establishing a multi-AOC post-Brexit structure following the
Brexit-related costs - (4) 4
UK’s referendum vote to leave the European Union (‘EU’).
Release of the unused FY’18 provision for the write-down of IT assets
Commercial IT platform - 2 (2)
under development which will no longer be utilised by the business.
Foreign exchange gains or losses arising from the retranslation of
Balance sheet foreign exchange loss 3 3 - foreign currency monetary assets and liabilities held in the statement
of financial position.
Due to the full grounding of the fleet and the lower capacity
Fair value adjustment (164) - (164) expected for several months thereafter, easyJet is in a significantly
over-hedged position from both a jet fuel and FX perspective.
Total non-headline items (160) 3 (163)
*Favourable/(adverse) 39Currency impact
Revenue Costs
H1 2020 H1 2019 H1 2020 H1 2019
Sterling 42% 41% 33% 32%
Euro 48% 48% 32% 37%
US dollar 1% 1% 28% 24%
Other (principally Swiss franc) 9% 10% 7% 7%
Average effective Euro rate for revenue for H1 2020 was €1.14 (H1 2019: €1.13)
Average effective Euro rate for costs for H1 2020 was €1.17 (H1 2019: €1.14)
40You can also read