What will it take for value to outperform growth - Updated material based on presentation and discussion at Club b family office conference in ...

Page created by Terrance Reese
 
CONTINUE READING
What will it take for value to outperform growth - Updated material based on presentation and discussion at Club b family office conference in ...
What will it take for value to outperform growth

Updated material based on presentation and discussion at Club b
family office conference in Montreal held on May 9th, 2019
Philip Higson, Carlyon AG
What will it take for value to outperform growth - Updated material based on presentation and discussion at Club b family office conference in ...
Overview

•   What will it take for value to outperform growth?
     −   QE needs to become QT (with a second attempt)
     −   Tech and Healthcare leaders have to de-rate. These two sectors represent 77% of S&P 500 expected revenue
         growth in 2019, however tech revenue path is slowing and capital intensity, regulatory risk rising.
     −   Healthcare faces pricing questions in political run up to 2020 election.
•   What type of stocks can lead the market after a regime change?
     −   Companies which can sustain shareholder returns without the need for high rates of revenue growth.
     −   Previous growth names now seen as value e.g. Apple based on new ETF classification & Berkshire selection.
     −   It might take a significant market sell off / recession to increase the number of value opportunities.
•   What is 'value‘, and can we learn from stock selection of Buffett, Elliott, and other successful active managers?
     −   Value is broadly lower expected revenue growth, lower RoE & lower prospective P/E vs S&P 500 average metrics.
     −   Value managers typically use multi-year valuation targets to anchor their investment decisions and contrarian
         opinions about future prospects of a target company.
     −   Recent Amazon stock purchase by Berkshire raises interesting questions about ‘what is value?’
•   Are value ETF’s a good alternative for passive portfolio construction?
     −   Current year or trailing multiples, typically used by value ETFs, may have unintended consequences for portfolio
         selection, active investors typically have longer time horizon.
     −   Value and growth ETFs often have 30% overlap, which dilutes the style exposure.

                                                                                                                        2
What will it take for value to outperform growth - Updated material based on presentation and discussion at Club b family office conference in ...
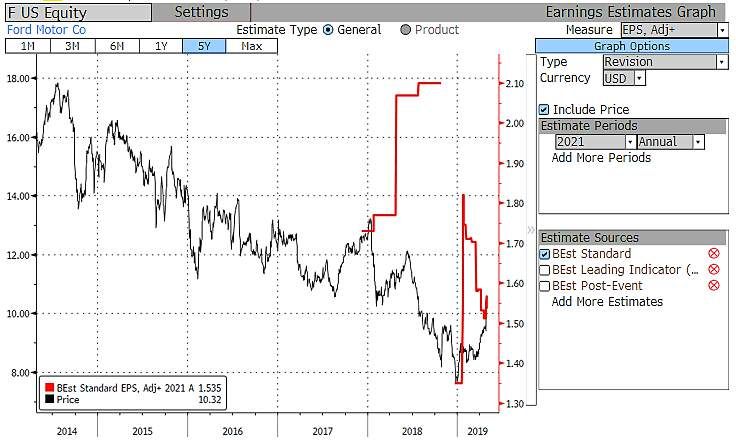
Value and Growth episodes
What will it take for value to outperform growth - Updated material based on presentation and discussion at Club b family office conference in ...
Growth and value episodes based on index performance and factor cheapness since 1990

Last big regime change from growth to value occured at the end of tech bubble in 2000...

 Chart showing relative performance of Russell          1.8     Relative performance of Russell 1000 growth vs value indices
 1000 factor indices, growth stocks have                1.6
 outperformed since 2006 with only 2 recent brief
                                                        1.4
 episodes for value during 2016 and Oct/Nov 2018.
                                                        1.2
 The big value opportunity was the peak of the
 Tech bubble in 2000, which lasted until 2006.            1
 Growth supported by the tech and the healthcare        0.8
 sector, has persisted ever since 2006 and QE
                                                        0.6
 environment raised most asset prices.

                                                              1990

                                                                     1992

                                                                            1994

                                                                                   1996

                                                                                          1998

                                                                                                 2000

                                                                                                        2002

                                                                                                               2004

                                                                                                                      2006

                                                                                                                             2008

                                                                                                                                    2010

                                                                                                                                           2012

                                                                                                                                                  2014

                                                                                                                                                         2016

                                                                                                                                                                2018
 QE needs to become QT (with a second attempt)        Source: Bloomberg

 Valuation spread between top and bottom quartile
 stocks as ranked by the value factor showing value
 factor remaining very cheap compared to history.
 Lower inflation and low interest rates environment
 since the GFC have increased the attractiveness of
 longer duration (growth) assets.

                                                      Note: Valuation spread is a z-score between the median P/E ratio of top quartile
                                                      stocks and bottom quartile stocks as ranked by the value factor.
                                                      Source: J.P. Morgan Asset Management, Jan. 2019
                                                                                                                                                                   4
What will it take for value to outperform growth - Updated material based on presentation and discussion at Club b family office conference in ...
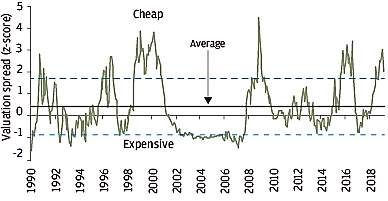
ETF flows into value in H2 2018, but not sustained so far in 2019

               Net value flows for largest 3 Value vs. largest 3 Growth ETFs
USD bn
 3.0                                                                                                                                                                                                                      H2 2018 flows into value
                                                                                              Net flows into Value                                                                                                        coincide with lower revenue
 2.0                                                                                                                                                                                                                      expectations for 2019 and
                                                                                                                                                                                                                          2020 on trade war and
 1.0                                                                                                                                                                                                                      slower global growth.
 0.0
                                                                                                                                                                                                                          Q1 2019 flows into growth
-1.0                                                                                                                                                                                                                      coincide with policy U-turn
                                                                                                                                                                                                                          by central banks.
-2.0
                                                                                                                                               Net flows into Growth
-3.0
         08.2017

                   09.2017

                             10.2017

                                       11.2017

                                                 12.2017

                                                           01.2018

                                                                     02.2018

                                                                               03.2018

                                                                                         04.2018

                                                                                                   05.2018

                                                                                                             06.2018

                                                                                                                        07.2018

                                                                                                                                  08.2018

                                                                                                                                            09.2018

                                                                                                                                                      10.2018

                                                                                                                                                                11.2018

                                                                                                                                                                           12.2018

                                                                                                                                                                                     01.2019

                                                                                                                                                                                               02.2019

                                                                                                                                                                                                         03.2019
Note: Value represented by VTV, IWD, IVE. Growth represented by VUG, IWF, IVW

Various value methodologies
                                                                                                                                            Performance (%)                                Volatility (Avg. 90d)
                                                                           Value                                 AuM
                         ETF                                                                                                                                              2019                                     2019
                                                                        methodology                             ($ bn)                 2017            2018                             2017              2018
                                                                                                                                                                           ytd                                      ytd

 iShares S&P 500 Value (IVE)                                         P/B, P/E, P/S                                     16              15.3             -9.9              16.2            8.0             12.7     18.3

                                                                     P/B, P/ fw E, P/hist
 Vanguard Value (VTV)                                                                                                  48              17.1             -6.4              13.6            7.8             13.0     18.1
                                                                     E, P/Div ratio, P/S

 iShares Russell 1000 Value (IWD)                                    P/B                                               39              13.5             -9.2              14.9            8.1             12.6     17.3

Source: Bloomberg
                                                                                                                                                                                                                                                   5
Growth episode highly dependant
    on tech and healthcare
Tech and Healthcare represent 77% of expected S&P 500 revenue growth in 2019

                                                                     Tech +4.3%p in 2018                       2018 S&P 500 revenue
                                                                     Healthcare +1.0% p in 2018                growth of 8.9% = 2x trend
                              Energy contributed 3.5%p                                                         rate of 4% over 10 year
                              Cons. Disc. contributed 1.5p%                                                    period 2011–2020

                                                                                                               2019 consensus S&P500
                                                                                                               revenue growth approx 5%
                                                                                                               with Tech and Healthcare
                                                                                                               representing 77% of the
                         Energy -2.5%p in 2015                                                                 expected growth outcome.
                         Industrials -0.3%p in 2015
                         Cons. staples -0.16%p in 2015

                                    Revenue Revenue                                        Performance
                                                      2018                 2019
  Sector*             Weighting      growth growth                                    contribution to S&P500
                                                    weighted             weighted
                                     2018A   2019E                                        index 2019 YTD
  Technology             29.8%        15.4%       5.9%        4.3%          2.1%                7.56%          YTD 2019 Healthcare flat
  Health Care            13.3%         7.5%      12.4%        1.0%          1.6%                0.44%          after strong 2018
  Financials             13.0%         5.0%       5.6%        0.6%          0.6%                2.13%          performance, now facing
  Industrials             9.6%         8.3%       3.1%        0.8%          0.3%                1.88%          2020 election concerns
  Consumer Discr.         7.1%        -0.7%       4.8%       -0.1%         -0.1%                1.38%          over drug pricing.
  Consumer Stapl.         7.1%         4.3%       4.3%        0.3%          0.2%                0.91%
                                                                                                               Technology revenue
  Communication           5.4%        -3.3%       7.5%       -0.2%          0.2%                0.93%
                                                                                                               deceleration evident in Q1
  Energy                  5.3%        17.4%       3.9%        0.9%         -0.1%                0.98%
                                                                                                               2019 results, sector
  Utilities               3.2%         3.4%       4.1%        0.1%          0.1%                0.35%
                                                                                                               vulnerable to de-rating.
  Real Estate             2.9%        13.3%       2.7%        0.4%          0.1%                0.48%
  Materials               2.7%        15.9%       0.0%        0.4%         -0.2%                0.34%
  S&P 500                             8.7%       4.8%        8.7%          4.8%                 17.4%
 * Adjusted sector weight based on old classification ie AMZN, GOOG, and FB included in Technology sector.
   Source: Bloomberg, Carlyon analysis                                                                                                      7
Tech experiencing slowing revenue growth and increased capital intensity
YoY %                   Revenue growth slowing
120

100                                                                                      Q1 2019 earning season confirmed slowing revenue
                                                                                         trajectory for leading tech names especially Intel,
 80
                                                                        Q1 2019 actual   Amazon, Google, Apple and question marks for
                                                                              +
 60
                                                                         Q2, Q3, Q4
                                                                                         future competitive position for Netflix. Facebook
 40                                                                       consensus      highly dependant on Instagram for growth
                                                                                         momentum.
 20

  0

-20
      2011      2012   2013   2014      2015     2016    2017        2018      2019

             Google       Facebook          Amazon       Microsoft           Apple

Capex to
revenue ratio     Google, FB and MFST more capital intensive                             ‘In terms of the expense guidance, we don’t have a
                                                                                         specific update on a long-term margin target. But I
 30%
                                                                                         would just note that we are not changing our
 25%                                                                                     overall philosophy of continuing to invest
 20%
                                                                                         aggressively across the business in these important
                                                                                         areas like safety, and security and innovation, which
 15%                                                                                     are going to play into continued expense growth
 10%                                                                                     both in 2019 and 2020. We’re still expecting to
                                                                                         continue to invest aggressively in the business, and
  5%
                                                                                         that will have an impact on operating margins.’
  0%
         2009 2010     2011 2012     2013    2014 2015   2016 2017          2018 2019
         Google          Facebook           Amazon        Apple              Microsoft
                                                                                         Dave Wehner, CFO, Facebook
                                                                                         Q1 earnings call transcript 24. April 2019
Source: Bloomberg
                                                                                                                                          8
What is value?
Comparison of value ETFs, growth ETFs and other manager portfolios
                                Fund     P/E (trailing P/B Consensus RoE (trailing    2019     Gross profit Net profit   Dividend
             Fund               AuM         12M)      historic forward 12M) (%) consensus est. margin (%), margin (%),    payout
                              (US$ bn)                         P/E 12M             rev. growth trailing 12M trailing     ratio (%)
                                                                                        (%)                   12M         historic

VLUE                              3         11.2      1.6      10.3       10.8         3.1         25.1        5.8         53.4
IVE                 Passive      16         15.1      2.4      13.9       12.8         3.3         28.2        8.2         46.2
VTV                  Value       48         15.3      2.2      13.7       12.1         3.8         29.4        7.9         53.5
IWD                             39          16.3      2.1      14.4       10.2         4.2         30.8        8.0         52.3
IWF                             45          24.6      7.5      21.0       28.9        10.2         38.1       12.5         42.5
                    Passive
VUG                             40          26.5      7.0      22.4       23.5        10.6         43.9       14.5         38.5
                    Growth
IVW                             23          25.2      5.8      21.0       21.0        10.1         45.7       14.4         46.7
Berkshire Hathaway              192         13.6      2.1      13.1       10.5         1.3         32.4       11.9         30.5
                    Active
Elliott Mgmt. Corp.             35          27.8      1.5      14.4       4.0          2.7         37.0        5.3         45.6
                     Value
Cevian Capital                  15          17.8      2.2      15.5       1.2          1.2         22.1        1.5         79.7
S&P 500                                     19.0      3.4      16.9       15.4         5.0         33.9       10.7         69.1

Source: Bloomberg

All metrics shown above calculated using publicly available information on funds’ holdings - see appendix. Bloomberg’s
PORT function using index weight as consolidation methodology. Please refer to appendix for single name positions of
active value managers. All above metrics are based upon the weighted single name portfolio holdings, the fund entity
level may not distribute dividends. For example Berkshire does not pay dividends, but does have a stock buyback policy.

  Largest 3 Value ETFs have aggregated AuM of ~ $100 bn
  Large Value ETFs mostly no ‘Pure Value’ ETFs but ‘Relative Value’ ETFs, meaning they filter out the cheaper half of a
  broad index and then apply a market-cap weighting
  30%+ of constituents of S&P 500 Value ETF also member of Growth counterpart and vice versa.

                                                                                                                           10
Revenue growth a strong metric to delineate growth and value styles
• Growth ETFs select stocks with 2x the average revenue growth rates of the S&P 500 index constituents.
• Value ETF’s & value managers eg Berkshire, accept lower growth rates and in return will select constituents with discounted P/E’s.
• Elliott and Cevian (activist managers) have portfolio constituents with materially lower growth characteristics based on current
  year consensus revenue growth. These managers lobby for margin improvements and higher shareholder returns.

Forward P/E vs forward revenue growth
 30
           Consensus forward P/E 12 months

                                                                                                                                         Bloomberg data, April 2019

 25                                                                                                                                                    VUG
                                                                                                                                                       40bn
                                                                                                                                          IVW
                                                                                                                                          23bn
                                                                                      S&P 500
 20
                                             Cevian                                                                                             IWF
                                                              Elliott   IVE    IWD                                                              45bn
                                              15bn
16.9                                                          35bn      16bn   39bn
 15

                                                                               VTV
                                                Berkshire               VLUE   48bn
 10                                              192bn                  3bn

                                                                                                                   2019 consensus estimate revenue growth
  5
       0                                                    2.5                        5.0
                                                                                        5                          7.5                          10

                  VLUE – iShares Edge MSCI Value Factor ETF                       IWF – iShares Russell 1000 Growth ETF   Berkshire Hathaway           S&P 500
                  IVE – iShares S&P500 Value ETF                                  VUG - Vanguard Growth ETF               Elliott Mgmt. Corp.
                  VTV – Vanguard Value ETF                                        IVW - iShares S&P 500 Growth ETF        Cevian Capital
                  IWD – iShares Russell 1000 Value ETF

Source: Bloomberg
                                                                                                                                                                      11
Profitability helps to explain portfolio style in conjunction with other metrics
• Berkshire Hathaway’s focus on high net margins from sustainable cash flows and high shareholder returns through
  dividends and buybacks but with trade-off being significantly lower revenue growth than S&P 500.
• Cevian Capital an activist with portfolio of mostly European names has a deep value approach with focus on restructuring
  via board representation.
• Elliott targets high gross margin portfolio constituents which need action to deliver on net margin.

Trailing net vs gross profit margins
                                                                                                                                Bloomberg data, April 2019
  50
                                                                                                                                            IVW
        Gross profit margin, trailing 12M

                                                                                                                                            23bn

                                                                                                                                                VUG
                                                                                                                                                40bn
                                                                                                                               IWF
  40                                                                                              S&P 500
                                                             Elliott                                                           45bn
                                                             35bn
                                                                                IWD
 33.9                                                                  VTV      39bn
                                                                       48bn
  30
                                                                                        IVE
                                                                                       16bn                   Berkshire
                                                             VLUE                                              192bn
                                            Cevian           3bn
                                             15bn
                                                                                                                  Net profit margin, trailing 12M
  20
       1                                             3   5             7                  9        10.7 11                13                  15

           VLUE – iShares Edge MSCI Value Factor ETF              IWF – iShares Russell 1000 Growth ETF      Berkshire Hathaway         S&P 500
           IVE – iShares S&P500 Value ETF                         VUG - Vanguard Growth ETF                  Elliott Mgmt. Corp.
           VTV – Vanguard Value ETF                               IVW - iShares S&P 500 Growth ETF           Cevian Capital
           IWD – iShares Russell 1000 Value ETF

Source: Bloomberg                                                                                                                                            12
Relationship between price and profitability highlights outliers (Berkshire, Elliott)
 • Berkshire Hathaway selects sustainable businesses with higher than average net margins, great efficiency in converting gross
   margin into net margin, but with a discounted P/E. The trade-off being that their portfolio constituents typically have low growth.
 • Elliott typically selects high gross margin companies with below average growth. His activist pressure on company boards helps
   transition towards higher net margins. Investment horizon is multi-year and therefore historic 12 month not so meaningful and
   current prospective P/E (14.4x) in line with other active value managers and slightly higher than Value ETFs (13.1x). Some
   positions e.g. SAP have targeted outcomes with 5-year profitability plan.

      Trailing P/E vs trailing net profit margins

                                                                                                     Bloomberg data, April 2019        IVW
               Net profit margin, trailing 12M

      15                                                                                                                               23bn
                                                                                                                          IWF                 VUG
                                                             Berkshire
                                                                                                                          45bn                40bn
                                                              192bn
                                                                                           S&P 500
      12
     10.7
                                                                    IVE
       9                                                            16bn            IWD
                                                                                    39bn

                                                      VLUE                                                                                     Elliott
                                                                         VTV
                                                      3bn                                                                                       35bn
       6                                                                 48bn

                                                                                                                             Price/Earnings trailing 12M
       3
           5                                     10                      15                  19.0 20                              25                       30

       VLUE – iShares Edge MSCI Value Factor ETF                IWF – iShares Russell 1000 Growth ETF     Berkshire Hathaway             S&P 500
       IVE – iShares S&P500 Value ETF                           VUG - Vanguard Growth ETF                 Elliott Mgmt. Corp.
       VTV – Vanguard Value ETF                                 IVW - iShares S&P 500 Growth ETF          Cevian Capital
       IWD – iShares Russell 1000 Value ETF

                                                                                                                                                            13
Source: Bloomberg
Return on equity provides another perspective on growth and value

Trailing RoE vs historic P/B metrics
                                                                                                                          Bloomberg data, April 2019
  8
       P/historic book

                                                                                                                         VUG
                                                                                                                         40n                   IWF
                                                                                                                                               45bn
                                                                                                            IVW
  6
                                                                                                            23bn

                                                                           S&P 500
  4
                                                       Berkshire
 3.4                                                    192bn        IVE
                                                IWD                 16bn
                                  Elliott
                         Cevian                 39bn
  2                                35bn
                          15bn                                     VTV
                                                       VLUE        48bn
                                                        3bn
                                                                                                                                RoE 12M trailing
  0
       0                            5                  10                   15 15.4                 20                     25                     30

           VLUE – iShares Edge MSCI Value Factor ETF        IWF – iShares Russell 1000 Growth ETF        Berkshire Hathaway        S&P 500
           IVE – iShares S&P500 Value ETF                   VUG - Vanguard Growth ETF                    Elliott Mgmt. Corp.
           VTV – Vanguard Value ETF                         IVW - iShares S&P 500 Growth ETF             Cevian Capital
           IWD – iShares Russell 1000 Value ETF

Source: Bloomberg

                                                                                                                                                       14
Book value as selection metric may have unintended consequences
• Buffett cited several sources for the lost relevance of book value including accounting rules and the impact of share repurchases.

• Accounting distortions have worsened over time with economic evolution from an asset-intensive to an asset-light economy.

• Investors in Value ETFs that are waiting for a revival in ‘value’ investing are instead getting unintended sector exposures
  (e.g. Financials and Energy) and chronically missing pricing opportunities in other areas of the market.
  Source: Distillate Capital Partners, 2019

 Trailing P/E vs historic P/B metrics
                                                                                                                 Bloomberg data, April 2019
   8                                                                                                           IWF
         P/historic book

                                                                                                               45bn        VUG
                                                                                                                           40n

                                                                                                                IVW
   6
                                                                                                                23bn

                                                                      S&P 500
   4
  3.4                       Berkshire
                                         IVE                 Cevian
                             192bn             VTV
                                        16bn                  15bn
                                               48bn                                                                            Elliott
                                                      IWD
   2                                                                                                                            35bn
                                                      39bn
             VLUE
              3bn
                                                                                                                       P/E trailing 12M
   0
        10                               15                            19.0     20                        25

         VLUE – iShares Edge MSCI Value Factor ETF    IWF – iShares Russell 1000 Growth ETF   Berkshire Hathaway          S&P 500
         IVE – iShares S&P500 Value ETF               VUG - Vanguard Growth ETF               Elliott Mgmt. Corp.
         VTV – Vanguard Value ETF                     IVW - iShares S&P 500 Growth ETF        Cevian Capital
         IWD – iShares Russell 1000 Value ETF

 Source: Bloomberg                                                                                                                            15
Single name observations
Berkshire Hathaway: ‘We overpaid for Kraft’ ...
                                                                           Organic growth (%)
                                                                               Nestlé       Kraft Heinz*
                                                        6.0

                                                        4.0

                                                        2.0

                                                        0.0

                                                        -2.0

                                                        -4.0
                                                               2014     2015       2016   2017       2018   2019 YTD

Berkshire owns 26.7% of Kraft Heinz.                    Note: organic sales growth is stated in 2018
‘ I was wrong in a couple of ways on Kraft Heinz ’      as -1.5% in Q1, -0.4% in Q2, 2.6% in Q3 and 2.4% in Q4
Buffett said on CNBC television on 25th Feb 2019.       but the accounts have not been filed.
‘We overpaid for Kraft’

‘Great companies are the ones that have the costs
in control, that grow the top line, and grow the        ‘Patricio inherits a mountain to fix. The depth of the
bottom line, - it’s not one or the other, I have very   company’s ailments will not be clear until Kraft Heinz files
good experience on that, on being more efficient        its annual report, the company has twice delayed the
every year, which doesn’t mean cutting costs. It        filling as it finishes investigating its accounting and
means to be more efficient’.                            procurement practices following the SEC inquiry’.
Patricio Miguel, new CEO, Kraft Heinz                   Lauren Hirsch
24th April 2019, CNBC                                   23rd April 2019, CNBC

                                                                                                                       17
... and just bought Amazon
Consensus for Amazon future growth and margins (2019 – 2022)                                         What options may be available to
                                                                                                     improve profit margins and shareholder
                                                                                                     returns versus current market consensus
                                                                                                     and an average Berkshire equity holding?
                                                                                                     - Focus on higher margin business areas
                                                                                                       eg Amazon Web Services (AWS), digital
                                                                                                       services, and own label revenues,
                                                                                                       moderate capital expenditures and
                                                                                                       development costs, reduce or eliminate
                                                                                                       losses in the international business
                                                                                                       units.

                                                                                                     - Deliver shareholder returns, initiate a
                                                                                                       dividend policy with payout ratios, at
                                                                                                       least equivalent to Berkshire’s average
                                                                                                       payout ratio of 30% and/ or start a
                                                                                                       buyback program via increased net
                                                                                                       borrowing. Current net debt stated as
Observations on Amazon from perspective of ‘value’ and ‘growth’ metrics:                               $29bn. Forward EBITDA in range of $50-
                                                                                                       70bn could support net debt of $90bn
Price to book value: 18.9x, Price to sales: 3.7x, Price to cash flow: 25.9x,                           to $126bn using average S&P 500
Return on equity: 30%. Berkshire purchase of Amazon shares based on a                                  EBITDA to Net debt multiple of 1.8x.
multi-year view unlike existing ETF metrics.
                     P/E (trailing   P/B    Consensus fw   RoE (trailing   Curr. FY consensus     Gross profit    Net profit    Div. payout
         Fund           12M)                  P/E 12M       12M) (%)       est. rev. growth (%)   margin (%),    margin (%),     ratio (%)
                                                                                                  trailing 12M   trailing 12M
Berkshire Hathaway       13.6        2.1        13.1           10.5                1.3               32.4           11.9           30.5
Amazon 2019              90.4        18.5       49.7           30.0               18.1               42.1            7.0            0.0
Amazon 2020                -          -         37.1             -                17.7               43.6            7.9            ?
Amazon 2021                -          -         27.8             -                17.7               44.5            8.8            ?

Source: Bloomberg                                                                                                                             18
Value investors base their assumptions for Ford shares on 2021 profitability

                                      Old 2021
                                      EPS estimates

                                       Current 2021 EPS estimates

Source: Bloomberg

 ETF
 ETF managers will filter securities on prospective earnings based on 2019 full year estimate of USD 1.30 a share.
 Value investors
 Deep value investors base their assumptions on 2021 earnings per share of USD 2.10 and a price target of over USD 20.

                                                                                                                         19
Elliott bases assumptions for SAP shares on 5-year profitability plan

                                       Current 2022 EPS estimates

 Source: Bloomberg

Elliott Management disclosed that it had built a €1.2bn stake in SAP on April 24th 2019, Europe’s largest software group, and that it
fully supported the group’s plans to improve performance. ‘The company’s stock has been consistently undervalued relative to its
revenue growth, and today’s announcement lays the groundwork for substantial value realisation Elliott said it saw potential for SAP
to achieve earnings per share of €8.50 in 2023’.
(FT, 25th April, 2019)

                                                                                                                                20
Appendix
Active value fund constituents – Berkshire Hathaway
Name                                         % of holding, 12/31/2018   Source: Berkshire Hathaway 13F Filing as at 12/31/2018
Apple, Inc.                                            21.6%
Bank of America Corp.                                  12.1%
Wells Fargo & Co.                                      10.8%
Coca Cola Co.                                          10.4%
American Express Co.                                   7.9%
Kraft Heinz Company                                    7.7%
U.S. Bancorp                                           3.2%
JPMorgan Chase & Co.                                   2.7%
Bank of New York Mellon Corp. (The)                    2.1%
Moody's Corp.                                          1.9%
Delta Air Lines, Inc.                                  1.8%
Goldman Sachs Group, Inc. (The)                        1.7%
Southwest Airlines Co.                                 1.4%
General Motors Company                                 1.3%
Charter Communications, Inc.                           1.1%
DaVita HealthCare Partners Inc.                        1.1%
VeriSign, Inc.                                         1.1%
United Continental Holdings, Inc.                      1.0%
USG Corp.                                              0.9%
American Airlines Group Inc.                           0.8%
Visa, Inc.                                             0.8%
Liberty Media, Sirius XM Group Series C                0.6%
Phillips 66                                            0.6%
PNC Financial Services Group, Inc. (The)               0.5%
MasterCard Incorporated                                0.5%
Costco Wholesale Corp.                                 0.5%
Sirius XM Holdings Inc.                                0.4%
M & T Bank Corp.                                       0.4%
Travelers Companies, Inc. (The)                        0.4%
TEVA / Teva Pharmaceutical Industries Ltd.             0.4%
Axalta Coating Systems Ltd.                            0.3%
Liberty Media, Sirius XM Group Series A                0.3%
STORE Capital Corp.                                    0.3%
Synchrony Financial                                    0.3%
Torchmark Corp.                                        0.3%
Restaurant Brands International Inc.                   0.2%
Liberty Global plc (Class C)                           0.2%
SU / Suncor Energy Inc.                                0.2%
Liberty Global plc (Class A)                           0.1%                                                                  22
Active value fund constituents – Elliott Mgmt. Corp.
Name                           % of holding, 12/31/2018
                                                          Source: Elliott 13F Filing as at 12/31/2018
Altaba Inc                               14.0%
Sempra Energy                            12.9%
Hess Corp                                12.3%
Arconic Inc                              10.2%
Firstenergy Corp                          9.3%
Peabody Energy Corp New                   7.3%
Citrix Sys Inc                            5.2%
Devon Energy Corp New                     4.6%
Dell Technologies Inc                     3.9%
Nielsen Hldgs Plc                         3.0%
Akamai Technologies Inc                   1.6%
Disney Walt Co                            1.1%
Element Solutions Inc                     1.1%
Opus Bk Irvine Calif                      1.0%
Eqt Corp                                  1.0%
Transocean Ltd                            1.0%
Acadia Healthcare Company                 0.9%
Commvault Systems Inc                     0.9%
Travelport Worldwide Ltd                  0.9%
Uniti Group Inc                           0.9%
Logmein Inc                               0.8%
Qep Res Inc                               0.8%
Roan Res Inc                              0.7%
Dish Network Corp                         0.6%
Mednax Inc                                0.4%
Equitrans Midstream Corp.                 0.4%
B Riley Finl Inc                          0.4%
Gty Technology Holdings Inc               0.4%
Vantage Energy Acquisition                0.4%
Zayo Group Hldgs Inc                      0.3%
Sunstone Hotel Invs Inc New              0.2%
Encana Corp                              0.2%
Exxon Mobil Corp                         0.2%
Healthcare Rlty Tr                       0.2%
Macerich Co                              0.1%
Community Health Sys Inc New             0.1%
Perspecta Inc                            0.1%
International Speedway Corp              0.1%
KKR Real Estate Fin Tr Inc               0.1%
Sanofi                                   0.1%
Vornado Rlty                             0.1%                                                           23
Cormedix Inc                             0.1%
Active value fund constituents – Cevian Capital

Name                        % of holding, 12/31/2018
Ericsson                             27.2%
ABB Ltd                              23.0%
ThyssenKrupp Ag                      14.1%
RSA Insurance Group Plc              10.3%
Panalpina Welttransport              6.5%
Rexel Sa                             6.1%
Vesuvius Plc                         4.5%
Autoliv Inc                          4.5%
Bilfinger Se                         3.8%

Source: Cevian Capital 13F Filing

                                                       24
Criticism of passive value selection by ETFs

                                               ‘The dirty truth about value investing’
                                               May 4 2017, Alex Rosenberg

                                               Quantitative value investing strategies are
                                               becoming increasingly popular.
                                               Many of these merely identify stocks with
                                               overstated fundamentals, according to a recent
                                               paper.
                                               “You still need to have a pair of human eyes,”
                                               author U-Wen Kok of RS Investments said.

 Publication in Q2, 2017

                                                                                         25
Explaining Berkshire version of value and returns

                                              ‘We find that stocks with the characteristics
                                              favored by Buffett have done well in
                                              general, that Buffett applies about 1.6-to-1
                                              leverage financed partly using insurance
                                              float with a low financing rate, and that
                                              leveraging safe stocks can largely explain
                                              Buffett’s performance’

                                              Frazzini, Kabiller & Pedersen

                                                                                         26
Disclaimer
The information in this presentation was compiled from sources believed to be reliable for informational purposes only.
The information contained herein is not intended to be a source of credit or investment advice with respect to the material presented, and the information
and/or documents contained do not constitute investment advice by Carlyon AG.
All information herein should serve as a guideline, which you can use to create your own judgement.
We trust that you will review the information to reflect your own conclusion and believe that these may serve as a helpful platform for this endeavor.
Any and all information contained herein is not intended to constitute legal or financial services advice. You should not take, or refrain from taking action
based on its content.
We do not guarantee the accuracy of this information or any results and further assume no liability in connection with this publication including any
information contained herein. Moreover, this presentation cannot be further distributed to third parties without the accordance of Carlyon AG.

This presentation is provided on a strictly private and confidential basis for information purposes only.
By attending or reading this presentation, you will be deemed to have agreed to the obligations and restrictions set out below:
Without the express prior written consent of Carlyon AG, the presentation and any information contained within it may not be (i) reproduced (in whole or in
part), (ii) copied at any time, (iii) used for any purpose other than your own evaluation or (iv) provided to any other person.
This presentation does not constitute or form part of, and should not be construed as, an offer, invitation or inducement to purchase or subscribe for
securities nor shall it or any part of it form the basis of, or be relied on in connection with, any contract or commitment whatsoever.
This presentation does not constitute either advice or a recommendation regarding any securities.
No representations or warranties, express or implied are given in, or in respect of, this presentation. To the fullest extent permitted by law in no
circumstances will Carlyon AG, or any of its respective subsidiaries, shareholders, affiliates, representatives, partners, directors, officers, employees, advisers
or agents be responsible or liable for any direct, indirect or consequential loss or loss of profit arising from the use of this presentation, its contents, its
omissions, reliance on the information contained within it, or on opinions communicated in relation thereto or otherwise arising in connection therewith.
The information contained in this presentation has not been independently verified.
Recipients of this presentation are not to construe its contents, or any prior or subsequent communications from or with Carlyon AG or its representatives
as investment, legal or tax advice.
You can also read