IR PRESENTATION Q2 I 6M UPDATE Hannes Niederhauser, CEO Richard Neuwirth, CFO - August 2020 - S&T AG
←
→
Page content transcription
If your browser does not render page correctly, please read the page content below

IR PRESENTATION
Q2 I 6M UPDATE
Hannes Niederhauser, CEO
Richard Neuwirth, CFO

August 2020
S&T AT A GLANCE

 01 S&T PROVIDES GLOBAL IOT 4.0 TECHNOLOGY                                                           03   S&T IN FIGURES
           > S&T offers IoT solutions for Industrial & Transportation                                     > 2019: EUR 1,122.9 Mio. revenues and EUR 111.7 Mio. EBITDA
           > IoT grows fast: The whole Industry 4.0 market is expected to grow at a                       > 2019: Strong op. cashflow (EUR 83.4 Mio.) and high liquidity (EUR 312.3 Mio.)
               CAGR of ~15% by 2022*                                                                      > 4.934 employees in 32 countries

 02 S&T IS AN IT SERVICE PROVIDER WITH REGIONAL FOCUS                                                04   MEMBER OF THE TECDAX® & SDAX®
           > Germany, Austria, Switzerland (DACH)                                                         > Headquarter in Linz, Austria, listed in Frankfurt, Germany
           > East Europe                                                                                  > ~ EUR 1.5 Bn. market cap as of 5th of August 2020
                                                                                                          > 2019 trading volume of ~ EUR 1 Bn.
* Revenues in % of S&T Group total revenues based on location of revenue generating S&T subsidiary                                                                                      2
** Source: IMS Report, ABI Research, Oracle, Markets and Markets Analysis
S&T HIGHLIGHTS

    PROFIT FOCUS                                                       LEADING IOT ALLIANCE
    › Revenue Q2 2020 (Q2 2019):
                                                                       › Manufacturing cooperation and IoT cooperation
      +8.3% to EUR 268.7 Mio. (EUR 248.1 Mio.)
                                                                         with Foxconn in progress
    › EBITDA Q2 2020 (Q2 2019):
                                                                       › Alliance with Microsoft and Intel for Industry 4.0
      +16% to EUR 26.9 Mio. (EUR 23.2 Mio.)
                                                                         Cloud Solutions
    › Net Income after NCI Q2 2020 (Q2 2019):
                                                                       › 5G stack for IIoT extended by acquisition of Iskratel, SI
      +8% to EUR 19.6 Mio. (EUR 18.2 Mio.)

    FINANCE GROWTH                                                     SHAREHOLDER FOCUS
    › Working Capital Optimization progressing well                    › ESG rating improvements ongoing
      through PEC program, operating Cash Flow improved by ~ 39 Mio.
                                                                       › Continuous dividend increase: 2014 - 2018: 7ct; 8ct; 10ct; 13ct;
      (6M 2020: EUR 27.2 Mio. | 6M 2019: minus 11.7 Mio.)
                                                                         16ct; dividend for FY 2019 postponed to 2021 due to Corona crisis;
    › Cash of EUR 257.7 Mio. at hand as of 30th of June 2020
                                                                       › 2020: new Share buyback program I 2020 started (390T shares
    › Sufficient liquidity available to finance organic and              purchased until 30th of June 2020), 1.147 Mio. treasury shares as
      an-organic growth                                                  of 30th of June 2020

                                                                                                                                              3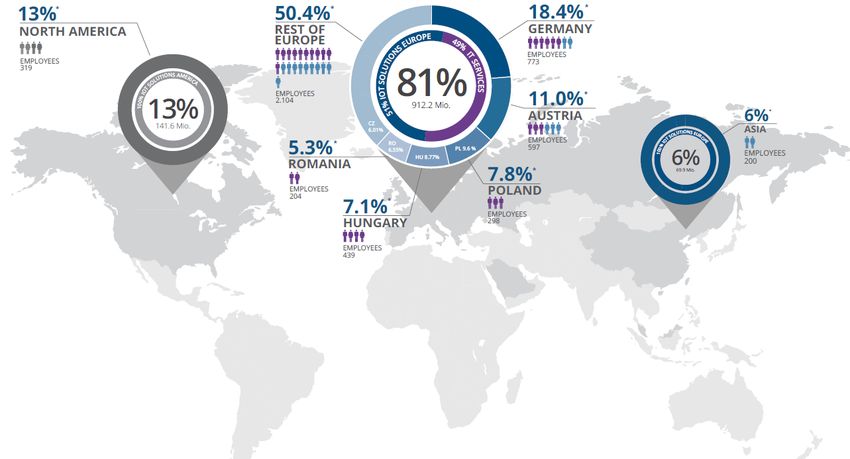
Q2 2020
EXCELLENT RESULTS DESPITE COVID-19 PANDEMIC
REVENUE                                       GROSS PROFIT                                   EBITDA
(in EUR Mio.)                                 (in EUR Mio.)                                  (in EUR Mio.)

300                                            120                                            30
250                                            100                                            25
                                  268.7                                         103.8                                          26.9
200             248.1                           80                                            20
                                                               89.2                                            23.2
150                                             60                                            15
100                                             40                                            10
 50                                             20                                             5
                         + 8.3%                                       + 16.3%                                             + 16%
   0                                             0                                             0
                 Q2 2019 | Q2 2020                             Q2 2019 | Q2 2020                               Q2 2019 | Q2 2020

NET INCOME AFTER NCI                          OPERATING CASHFLOW                             CASH AND CASH EQUIVALENTS
(in EUR Mio.)                                 (in EUR Mio.)                                  (in EUR Mio.)

 20                                                                                          350
                                               20
                                                                                20.8         300
 15                                            15                                            250
                                                                                                              276.1
                                                                                             200                              257.7
 10                                            10
                                                                 + EUR 19.5 Mio.             150
                                  10.1
                 8.8                                                                         100
  5                                             5
                                                               1.3                            50
                       + 14.8%                                                                                        - EUR 18.4 Mio.
  0                                             0                                               0
                Q2 2019 | Q2 2020                             6M 2019 | 6M 2020                              31.03.2020 | 30.06.2020

 Strong Q2 2020 against global economic break-down caused by Covid-19| Operating Cashflow improved by EUR 19.5 Mio. in Q2 2020
                                                                                                                                        4
6M 2020
GOOD RESULTS IN ALL PARAMETERS
REVENUE                                         GROSS PROFIT                                    EBITDA
(in EUR Mio.)                                   (in EUR Mio.)                                   (in EUR Mio.)

600                                                                                              60
                                                200
500                                                                            211.6             50
                                  538.7                                                                                           52.0
400             473.8                           150              174.5                           40
                                                                                                                  44.3
300                                                                                              30
                                                100
200                                                                                              20
                                                 50
100                                                                                              10
                        + 13.7%                                      + 21.3%                                                + 17.4%
   0                                               0                                              0
                6M 2019 | 6M 2020                                6M 2019 | 6M 2020                               6M 2019 | 6M 2020

NET INCOME AFTER NCI                            OPERATING CASHFLOW                              CASH AND CASH EQUIVALENTS
(in EUR Mio.)                                   (in EUR Mio.)                                   (in EUR Mio.)

 20                                              15                                             350
                                                                               27.2
                                  19.6           10                                             300
 15             18.2                                                                                             312.3
                                                                                                250
                                                  5
                                                                                                200                              257.7
 10                                               0
                                                                   + EUR 38.9 Mio.              150
                                                 -5
                                                                                                100
  5                                                              -11.7
                                                -10                                              50
                        + 8%                                                                                             - EUR 54.6 Mio.
  0                                             -15                                                0
                6M 2019 | 6M 2020                               6M 2019 | 6M 2020                               31.12.2019 | 30.06.2020

 Despite first Corona headwinds, strong 1st HY 2020 | Operating Cashflow improved by ~ EUR 38.9 Mio.
                                                                                                                                           5
S&T BUSINESS MODEL

                       IT SERVICES                                                    IOT SOLUTIONS EUROPE                                 IOT SOLUTIONS AMERICA

                                                                                                          > Medical

       SERVICES EE                SERVICES EE                INDUSTRIAL   TRANSPORT   MEDICAL   COMMUNICATIONS   SMART ENERGY   IOT ASIA             IOT NORTH AMERICA
  >   Eastern Europe

 Revenue plan 2020:                                           Revenue plan 2020:                                                           Revenue plan 2020:
 EUR 480 Mio.*      Mid-term targets:                         EUR 660 Mio.*                      Mid-term targets:                         EUR 145 Mio.*      Mid-term targets:
                    > EBITDA** > 6%                                                              > EBITDA** > 14%                                             > EBITDA** > 10%
                    > GM > 30%                                                                   > GM > 40%                                                   > GM > 40%
                    > Growth p.a.: 6%                                                            > Growth p.a.: 12%                                           > Growth p.a.: 12%

IoT Solutions Europe Technologies to be pushed additionally via S&T sales channels in North America, Asia and Eastern Europe
* incl. I/C revenues before Iskratel+ Citycomp acquisition
** before HQ-fee distribution                                                                                                                                                      6
IT SERVICES

            REVENUE*                                        EBITDA                         ADJ. EBITDA         › S&T Eastern Europe adopted faster to Corona
                                                                                           MARGINS***            crisis, Corona impacts will be minor
                                                                                                               › In general Corona impact lower than in West
                                                                     16.9
                       235.5                            14.9                                                     Europe (less cases, less travelling)
           213                                                                                        5.1%
                                                                                           5.0%                › Delays/cancellations in deployments are
                                                                                                                 compensated by
                                                                                                                  › More public business
                                                                                                                  › “Corona” subsidies on labor cost
                                                                                                                  › Home office/VPN equipment
                                                        10.2**       11.7**                                    › EBITDA margin growing appr. 0.5% vs 2019
                                                                                                               › Good growth of Home Office, Network &
                                                                                                                 Security, SAP Hana and Public Business
           6M 2019 | 6M 2020                            6M 2019 | 6M 2020                  6M 2019 | 6M 2020

 Macroeconomic situation: Eastern Europe did grow stronger than Western Europe
*   3rd Party revenues including intercompany revenues
** Difference based on charged management fees from S&T AG (part of IT Services Segment)
*** HQ-fee adjusted EBITDA in % of external revenue                                                                                                            7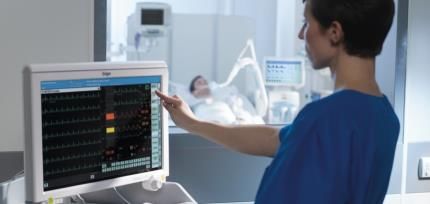
IOT SOLUTIONS EUROPE

            REVENUE*                                        EBITDA                       ADJ. EBITDA         › Highest EBITDA (before HQ-fee) contribution to
                                                                    35.6**               MARGINS***            the group of 60% in Q2 2020
                                                                                                             › Strong growth due to growing IIOT market
                                                       28.9**
                       310.4                                         31.8                14.6%               › Business well adopted to Corona crisis:
                                                                                                    13.8%
                                                                                                                › Medical booming (Dräger, Maquet, GEHC)
                                                         26.5                                                   › Public business (trains)
           237.3                                                                                                › Less subsidies due to full utilization
                                                                                                             › Profit growth continues due to increased share
                                                                                                               of software products in the S&T portfolio
                                                                                                             › M2M (IIoT) communication expanded by newly
                                                                                                               acquired 5G know-how (Iskratel)

           6M 2019 | 6M 2020                             6M 2019 | 6M 2020               6M 2019 | 6M 2020

 “IoT Solutions Europe” segment drives profitability further
*   3rd Party revenues including intercompany revenues
** Difference based on charged management fees to S&T AG (part of IT Services Segment)
*** HQ-fee adjusted EBITDA in % of external revenue                                                                                                             8
IOT SOLUTIONS AMERICA

            REVENUE*                                          EBITDA                     ADJ. EBITDA         › Two largest customers (~ 50% of revenues, but
                                                           5.2**      4.7**              MARGINS***            low margin) phasing out, Avionics weaker
                                                                                                             › Twitch and GEHC partially compensate
             77.9                                                                                   8.8%     › New projects have lower revenues but
                                                        5.2**
                         66.9                                                             7.3%                 improved EBITDA
                                                                                                             › Negative impact of restructuring in 6M 2020
                                                                                                               approx. EUR 1 Mio.
                                                                      3.3                                    › GM improvement on track GM: 34,8% (6M
                                                        2.9                                                    2019) vs. 37,1% (6M 2020)
                                                                                                             › Book to bill 6M 2020 > 1,4

           6M 2019 | 6M 2020                             6M 2019 | 6M 2020               6M 2019 | 6M 2020

 Canada business weak | Further improvement measures identified and in execution
*   3rd Party revenues including intercompany revenues
** Difference based on charged management fees to S&T AG (part of IT Services Segment)
*** HQ-fee adjusted EBITDA in % of external revenue                                                                                                            9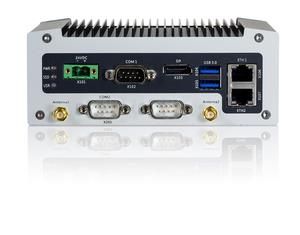
ITP PROGRAM (`IMPROVE TECHNOLOGY PENETRATION´)
PROGRAM TO BOOST S&T’S GROWTH AND MARGINS

                                                                                                                          In Mio. EUR    EXCELLENT POOL OF ENGINEERS
SUSIETEC
                                                                                            21    2019
                                                                                                                                         > Cost efficient in-house resources in
SUSiEtec IoT software framework: Enabling machine learning (AI)
                                                                                                                                           Eastern Europe
› Improve software product portfolio: Embedded SW, Soft PLC, TSN (real time networks)                                                    > 2019: EUR 170,5 million R&D costs
                                                                                            80                  2023
› EUR 80 Mio. software revenues planned by 2023 + triggering additional IoT product sales                                                  (15,2% of revenues) as of 40% paid by
                                                                                                                                           customers
                                                                                                                                         > Around 3.000 engineering heads
                                                                                                                          In Mio. EUR
                                                                                                                                           worldwide
SMART ENERGY                                                                                49           2019
                                                                                                                                               740
IoT-ready Smart Grids: From hardware up to data management software
                                                                                                                   2023
› Revenue plan of EUR 100 Mio. until 2023                                                   100
                                                                                                                                         677
                                                                                                                          In Mio. EUR                                       2,649
TRAIN CONTROL SYSTEMS                                                                       99                   2019
                                                                                                                                          383
Mission critical control systems for high speed trains
› Revenue plan of EUR 140 Mio. until 2023                                                   140                           2023
                                                                                                                                                   485

                                                                                                                                                Engineering       Field Engineers
                                                                                                                                                Production        Sales
                                                                                                                                                Others

                                                                                                                           In Mio. EUR
Avionics investments currently on hold
                                                                                                                                                                                    10
TECHNOLOGY
SMART FACTORY
OUR OFFERING FOR A SMART FACTORY: FROM EDGE TO CLOUD
EDGE DEVICES GATEWAYS / PLC FOG CLOUD
EMBEDDED SOFTWARE IOT INTERFACE ON PREMISE COMPUTING COOPERATION WITH
CUSTOMIZED SECURITY & STORAGE MICROSOFT AZURE
“REAL-TIME NETWORKS”
CUSTOMER EXAMPLES COOPERATION WITH FOXCONN
> SUSiEtec Workforce-Solution
> Roll out of IoT Software together in Asia
> Driverless transport vehicles for production and logistics operations
> Cooperate on leading Industry 4.0
Enabling IoT navigation software for sensor-based tracking production standards and technologies
> Printing industry - IoT Industry Computer Platforms to operate printing presses
> Create a global Industry 4.0 factory
> Manufacturer of injection molding machines
Modern user experience and process control in factory environment
11TECHNOLOGY
MEDICAL AND HEALTHCARE MARKET
MEDICAL SYSTEMS COMPLETE MEDICAL SOLUTION OFFERING
› S&T designs and delivers Smart Medical Control Systems
› Total volume 2019 appr. EUR 100 Mio.
Top customers :
› GE Healthcare (USA + Israel)
› Dräger, Maquet, Philips, Fresenius, Medtronic, Siemens
› S&T is qualified as mission critical supplier and will stay open during
Corona crisis (Augsburg, Ismaning and San Diego facilities)
› Strong business demand (+ 50%)
MEDICAL SERVICES DRÄGER VENTILATOR SYSTEMS
› S&T runs service contracts for technical equipment in hospitals › Global Top Player and Top 3 Customer of S&T (EUR 20 Mio. FY2019)
› Total volume 2019 appr. EUR 40 Mio. › Control systems designed and delivered since 10 years by Kontron
› No shut down for mission critical services during corona crisis › Business currently exploding – weekend shifts in Augsburg + Ismaning
12UPDATE PEC PROGRAM
SIGNIFICANT IMPROVEMENTS ON CASHFLOW AND WC RATIO
OPERATING CASH FLOW ONE TIME EFFECTS ON OPERATING CASH FLOW IN Q2
(IN EUR MIO.)
IN TEUR NON-ORGANIC CASH FLOW IMPACTs
-2,254 Settlement HU for Kapsch CarrierCom in Q2 2020
83.4 27.0
Q2 19
61.4
Achsentitel
44.9 Q2 19 Q2 20
35.5
26.7
-13.0
2015 2016 2017 2018 2019
Achsentitel
WORKING CAPITAL IN MIO. EUR | RATIO IN % OF REVENUES in EUR Mio. 2018 Q2 2019 2019 Q2 2020
(IN EUR MIO.)
Revenues 990 249 1,123 268,6
21.8%
15.8% 13.7%
13.8% 14.5% 74 days 95 days 73 days 87 days
23.7% 221.3 Inventory
156.4 153.9 (131 Mio.) (167 Mio.) (147 Mio.) (158 Mio.)
121.5 168.9
119.2
75 days 63 days 69 days 61 days
9.6% A/R
(202 Mio.) (172 Mio.) (212 Mio.) (180 Mio.)
45
Factoring 56 Mio. (20%) 56 Mio. (24%) 63 Mio. (23%) 58 Mio. (24%)
2015 2016 2017 2018 2019 Q2 19 Q2 20
13ONE-TIME EFFECTS IN Q2 | 6M 2020
IN KEUR ONE TIME PROFIT EFFECTS (Q2) IN MIO. EUR ONE TIME REVENUE EFFECTS Q2 2020
+21.3 New acquisitions
-382 Restructuring America (finished)
-1,384 cost to for other supplier sources in Corona times -10.4 Cancelled business
+1300 Settlement HU +10.9 Total impact on Q2 2020 revenues
-332 Expenses on stock options plan
-788 Total impact on Q2 results
IN TEUR R&D CAPITALIZATION Q2 IN TEUR IMPACTS FROM PPA
+3,488 Capitalization R&D in Q2 1,904 Q2 2019 Amortization
-2,997 Amortization of R&D in Q2 2,623 Q2 2020 Amortization
+491 Impact R&D Capitalization - 719 Increase in PPA Amortization
Adjusted EBIT in Q2 amounts to EUR 12.7 Mio. vs 11.9 Mio. actual | 4% non-organic growth in Q2 2020
14S&T GROUP BALANCE SHEET
Mio. EUR 30/06/2020 31/12/2019 30/06/2020 31/12/2019
NON-CURRENT ASSETS 445,0 457,2 CAPITAL AND RESERVES 383,5 385,1
Fixed Assets 411,4 422,8 Equity 383,5 385,1
Other Assets 33,7 34,4
NON-CURRENT LIABILITIES 311,0 331,8
CURRENT ASSETS 699,6 768,5 Long-term loans and borrowings 210,7 220,0
Inventories 158,0 146,8 Other Non-Current Liabilities 100,3 111,8
Trade receivables 180,5 212,1 CURRENT LIABILITIES 450,1 508,8
Contract Assets from Customers 23,3 27,2 Trade payables 169,6 205,0
Cash and cash equivalents 257,7 312,3 Contract Liabilities from Customers 73,4 60,0
Other receivables and prepayments 63,8 70,1 Short-term loans and borrowings 52,7 62,8
Other Current Liabilities 154,4 181,1
Total Assets 1.144,7 1.225,7 Total Liabilities & Equity 1.144,7 1.225,7
Equity Ratio 33,5% 31,4%
Net Cash* 7,1 29,5
Working Capital 192,1 181,1
Working Capital excluding IFRS 15** 168,9 153,9
Seasonal decrease of balance sheet sum | Cash represents 22.5% of Total Assets
* Definition Net Cash: Cash and cash equivalents less non-current and current financing liabilities (excl. liabilities from leasing according to IFRS 16)
** Definition Working Capital: Inventories plus trade receivables less trade payables (excl. IFRS 15 contract assets and liabilities) 15BACKLOG & OPPORTUNITIES
ORDERS AND DESIGN WINS REMAIN STRONG IN Q2 2020
BACKLOG DEVELOPMENT REMAINS POSITIVE SELECTED ORDERS | DESIGN WINS 6M 2020 COUNTRY VOLUME EUR
+21.6% Public safety/emergency system “112” BG 58 Mio.
2500
2,625 Control for high-speed train LIT, BG, CN 38 Mio.
2100
2,158
1700
Control for high-speed train CZ 22 Mio.
1300 Border control HR 36 Mio.
+8.2%
900 Global leader in medical equipment USA 14 Mio.
841 910
500 Medical respirator machines GER 12 Mio.
100 Autonomous driving USA 7 Mio.
Backlog Project Pipeline
-300 Leading robot company in Europe GER 7 Mio.
31.12.2019 30.06.2020 (in EUR Mio.)
Medical respirator machines GER 6 Mio.
Growth in medical and public customers compensates slump in avionics
162020 S&T WILL EXCEED FIRST TIME 10% EBITDA-MARGIN
EBITDA REVENUE
(IN EUR MIO.) (IN EUR MIO.)
1,150
130 115.0 1,123
111.7 IoT Solutions | America
110 991
90.5 IoT Solutions | Europe 882
90 IT Services
68.1
70
504
385 468
50
28.3 34.4
30 22.9
10
-10
2014 2015 2016 2017 2018 2019 2020fc 2014 2015 2016 2017 2018 2019 2020fc
Backlog EUR Mio. 12/14 12/15 12/16 12/17 12/18 12/19 6/20 CONTINUOUS GROSS MARGIN AND EBITDA MARGIN GROWTH
Project Pipeline 644 701 1,002 1,105 1,632 2,158 2,625 GM 33.0 % 33.9 % 33.5% 35.7 % 36.3% 37.0% > 38%
Scheduled Orders EBITDA 5.9% 6.0% 6.8% 7.7% 9.1% 9.9% > 10%
157 181 306 474 841 841 909
Guidance FY 2020*: minimum EUR 1.150 Mio. Revenue @ EUR 115 Mio. EBITDA , strong Q2 with low impacts by Corona
* Excluding M&A of Iskratel and CITYCOMP
17AGENDA 2023
GUIDANCE CONFIRMED EVEN AFTER CORONA IMPACTS
2023
› Organic growth in line with market growth per segment
› Additional organic growth potential from the ITP programs EUR 2 Bn.
› More inorganic acquisitions based on reduced Corona prices
ACQUISITIONS
EMBEDDED ODM GROWTH IN ASIA Potential up to
EUR 400 Mio.
SERVICES Potential up to
Potential up to EUR 200 Mio.
SMART METER EUR 100 Mio.
Potential up to
EUR 100 Mio.
2018 EDGE SERVER
Potential up to
EUR 200 Mio.
IoT IOT TECHNOLOGIES
EURSolutions
1 BN. Potential up to
5 years plan 2018 2023p Growth
450 EUR 300 Mio. Revenues 990 Mio. 2,000 Mio. +102%
EBITDA 90.5 Mio. 220 Mio +143%
IT
Services EPS 70 cent 175 cent +150%
420
Agenda 2023 after Corona: reduced organic growth in 2020 will be compensated by more M&A activities at discounted prices
18BENEFIT FROM THE COVID-19 PANDEMIC
M&A OPPORTUNITIES WHILE COVID MEASURES TAKEN AND IMPACTS
Agenda 2023 plans for EUR 2.000 Mio of revenues No revenue impact on Q2 (EUR 268.6 Mio.) vs Q1 (EUR 270.1 Mio.)
› Half of growth by M&A (acquire EUR 100 Mio. revenues per year) › Qualify 2nd sources to repair supply chain (H1: 3,117 TEUR add. cost)
› EUR 250 Mio. of cash, EUR 25 Mio. of treasury shares and strong cash Focus on Covid-19 winner markets and public sector
flow support this strategy without need for major capital increases › EUR 50 Mio. in 2020 added in Medical (respirators – Dräger, GE)
› Internal M&A department and existing pipeline > 10 acquisitions › public sector increases to ~50% of new projects (2019: 32%)
Corona is a gamechanger in acquisition landscape › EUR 20 Mio./2020 lost in avionics
› Lack of acquisition financing reduces potential buyers (no PE funds) EUR 4,5 Mio labor cost reductions in Q2, FC EUR 2,5 Mio. in Q3
› Valuations drop by 30% based on › Management/Board waived 20% of salary in Q2+Q3
› Lower profits (currently) at targets result in lower valuations › 8% of subsidized “reduced hours” -> no layoffs (mainly IT services)
› Less potential buyers › Q3 another 2.5 Mio. expected
› DD Handicaps based on travel restrictions Up to 70% of all employee's home office work -> no productivity impact
S&T M&A targets › S&T supports Home office trend for years, IT infrastructure exists
› Restructuring situations at no profit › Good results, we will increase Home office ratio permanently to 25%
› High synergies with S&T -> achieve 10% EBITDA within 2 years › Mission critical production (Augsburg, San Diego) no shut down
› Valuations down to 40% of revenues (before 60%)
S&T acquired Iskratel & CITYCOMP (adds EUR 140 Mio. in 2021) – we will acquire min. EUR 300 Mio. within Corona period 2020/2021
19M&A UPDATE I: ISKRATEL GROUP
TRANSACTION PRODUCT DIVISIONS
› Acquisition of Iskratel group › Industrial (48%): trains, public safety / 112, industrial IOT
› Locations/owned buildings: SLO 31,000m², RUS 4,000m² › Broadband (33%): gateways, CPE (last mile infrastructure)
› Purchasing price fix EUR 37.5 Mio. + 0.56 * EBITDA (2020-2022) › Communication (19%): 5G core, IMS
› 2019 key figures: Rev EUR 116.5 Mio. @ EUR 2.6 Mio. EBITDA
› 907 FTEs (590 SLO, 201 RUS, 70 MK)
› Revenues: 63% East Europe (mainly Adriatic), 37% Russia
› 2019: 46.2 Mio. equity (47%) @ 9.5 Mio. Net Cash, 21.8 Mio. WC
SYNERGIES IMPACT 2022 ISKRATEL RESULTS
› Add Iskratel to S&T IOT Europe solutions 20 Mio. Rev 2018 2019 2020 2021 2022
› Add 5G know how to S&T Industrial + transportation Revenues (in EUR Mio.) 104 116.5 105 115 146
› Utilize Iskratel engineering 3.6 Mio. cost EBITDA (in EUR Mio.) 7.5 2.6 4.2 8.2 15.1
› Joint sourcing 1.2 Mio. cost
EBITDA Marge (in %) 7.2 2.2 4 7.1 10.3
20M&A UPDATE II: CITYCOMP
ABOUT CITYCOMP TRANSACTION STRUCTURE
› CITYCOMP provides Multi-Vendor-IT Services › Acquisition of 55.5% for a fixed price of EUR 6 Mio. at Closing
› 5,000m² headquarter near Stuttgart (own property) › Call/Put Options with remaining shareholders (active management)
› Revenue FY 2019 of EUR 38 Mio. @ 10% EBITDA until 2023
› Revenue FY 2020 of EUR 30 Mio. @ 1% EBITDA (Corona impact › Signing July 1st 2020 subject to merger control clearance
› ~ 300 FTE covering Germany (+ Austria and Switzerland) › Closing expected in Q3 2020
› > 2#,500 active customers, > 500,000 devices under maintenance
TRANSACTION RATIONALE CITYCOMP RESULTS
› With CITYCOMP, S&T becomes nationwide services provider in Germany
2019 2020 2021 2022
› Low valuation due to Q2 Covid-19 impact compared to historic
performance (> 10% CAGR, ~ 10% EBITDA Margin) Revenues (in EUR Mio.) 38.5 30 35.9 39.2
› High synergies with S&T in existing cusomer base and by near-shoring EBITDA (in EUR Mio.) 3.5 0.6 2.7 4.3
potential with S&T EE presence
EBITDA Marge (in %) 9.1 2.0 7.5 11.0
With CITYCOMP, S&T achieves nationwide network in Germany | Due to temporary Corona impact and high synergies cons
21THE S&T SHARE
TECDAX® & SDAX® MEMBER; TARGET: MDAX®
SHAREHOLDER STRUCTURE S&T SHARE: A TECDAX® & SDAX® MEMBER
1800 30.00
1600
25.00
1400
1200 20.00
Ennoconn Corporation - 26.6% 1000
15.00
Allianz Global Investors GmbH - 5.0% 800
600 10.00
Freefloat - 68.4% - includes as follows: 400
5.00
200
BNP Paribas Asset Management - 4.6% 0 0.00
Ninety One SA (Pty) Ltd - 4.0%
S&T Management - 2.0%
S&T AG TecDAX Index SDAX S&T AG EUR
COVERAGE One new analysts will take on coverage of S&T AG SHARE LIQUIDITY
Commerzbank | Buy: EUR 31.00 Pareto Securities | Buy: EUR 33.00 1,000,000,000
Hauck & Aufhäuser | Buy: EUR 33.00 Warburg Research | Buy: EUR 27.50
Kepler Cheuvreux | Buy: EUR 28.00 Raiffeisen Centrobank | Hold: EUR 22.00
0
Jefferies | Buy: EUR 32.00
2012 2013 2014 2015 2016 2017 2018 2019
Share Buyback Program I 2020 completed: purchase of 390,373 shares with maximum an average price of EUR 16.74 per share
22SUMMARY
ACHIEVEMENTS TARGETS
› Revenue growth of 13.7% and EBITDA growth of 17.4% › Minimum Guidance for 2020:
› PEC Program is progressing well › Revenues: 1,150 Mio.
› Operating cash flow improvements continue › EBITDA: 115 Mio.
› Finance cost further optimized › 2 Bn. revenues at > 11% EBITDA in 2023
› 2 successful acquisitions completed › Ongoing Working Capital improvement
› several M&A opportunities in the pipeline › MDAX membership
RISKS OPPORTUNITIES
› Economic crisis due to Covid-19 crisis › PEC Program boosts cash flow and EBITDA conversion
› Big players enter our niches in Industry 4.0 › Sufficient cash to benefit from discounted M&A during and
› US-Dollar development post-Corona
› Address right technology trends › Leading technologies in the growing IIoT market
23APPENDIX
EXPERIENCED MANAGEMENT TEAM
EXECUTIVE
BOARD
HANNES
NIEDERHAUSER
CEO RICHARD PETER STURZ MICHAEL CARLOS
NEUWIRTH COO JESKE QUEIROZ
Services EE COO Michael
CFO COO
Services DACH Riegert
IoT Europe
EVP
Transportation
EXTENDED
MANAGEMENT
BOARD
Robert Steve Zeljko Olga Christoph Andy Bernhard
Courteau Chen Puljic Sinenko Neumann Mason Günthner
EVP EVP EVP EVP VP VP VP
America Asia Communication Smart Energy Technology Avionics Smart Factory
MANAGEMENT
› Trainee program for interim management for M&A/restructuring/integration
24APPENDIX
S&T KEY FIGURES
In Mio. EUR 2016 2017 2018 2019 6M 2019 6M 2020
Revenues 503.7 882.0 990.9 1,122.9 473.8 538.7
Gross Profit 168.9 315.0 346.5 407.5 174.5 211.6
Gross Margin 33.5% 35.7% 35.0% 36.3% 36.8% 39.3%
EBITDA 34.4 68.1 90.5 111.7 44.3 52.0
EBITDA Margin 6.8% 7.7% 9.1% 9.9% 9.4% 9.7%
EBIT before PPA amortization 28.2 47.9 67.3 70.1 25.8 29.4
Net Income after NCI 20.4 29.4 48.5 49.1 18.2 19.6
EBITDA Interest Coverage Ratio* 7.9 9.8 14.5 17.7 14.5 16.4
Net Cash ** 32.0 101.8 52.7 29.5 -101.1 -5.7
Working Capital *** 119.2 121.5 156.4 153.9 221.3 168.9
Equity Ratio 36.0% 41.2% 43.3% 31.4% 31.8% 33.5%
Operating Cashflow 61.4 44.9 35.5 83.4 -11.7 27.2
Employees 3,786 3,849 4,248 4,934 4,770 4,936
* Definition EBITDA Interest Coverage Ratio: EBITDA divided by interest expenses (excl. interest expenses related to leasing liabilities according to IFRS 16)
** Definition Net Cash: Cash and cash equivalents less non-current and current financing liabilities (excl. liabilities from leasing according to IFRS 16)
*** Definition Working Capital: Inventories plus trade receivables less trade payables (excl. IFRS 15 contract assets and liabilities)
25APPENDIX
ESG IMPROVEMENTS - ACTION PLAN FOR 2020 AND BEYOND
TRANSPORT SUPERVISORY BOARD AUDIT COMMITTEE
Increase conversion of the fleet to Chairman of the Supervisory New composition of audit
e- and hybrid-vehicles, promotion replaced by female successor in committee -> increase of audit
of train travel, public transport June 2020, also next proposal committee independency
ticket at various S&T locations intended to be a female
candidate
RENEWABLE ENERGY S&T TOP AND MIDDLE LONG TERM COMPENSATION
MANAGEMENT
Expansion of photovoltaic system New long term Executive
under usage of S&T Smart Energy Increase share of women in S&T Remuneration/Compensation
products management positions from 18% system
up to 25 % until 12/2021
equaling the current gender
distribution in S&T
VIDEO & HOMEOFFICE COMMUNICATION
Further promotion of video- MENTORING PROGRAM Increase communication with
conferencing and home office work “Kleinaktionären”
to further optimize travel impact New Mentoring Program from
and for future female S&T leaders
26DISCLAIMER
This document includes 'forward-looking statements'. Forward-looking statements are all statements, which do not describe facts of the past, but containing the words "believe", "estimate", "expect", "anticipate",
"assume", "plan", "intend", "could", and words of similar meaning. These forward-looking statements are subject to inherent risks and uncertainties since they relate to future events and are based on current
assumptions and estimates of S&T AG, which might not occur at all or occur not as assumed. They therefore do not constitute a guarantee for the occurrence of future results or performances of S&T AG. The actual
financial position and the actual results of S&T AG, as well as the overall economic development and the regulatory environment may differ materially from the expectations, which are assumed explicitly or implicitly in
the forward-looking statements and do not comply to them. Analysts and investors, and any other person or entity that may need to take decisions or prepare or release opinions about the shares / securities issued by
S&T AG are cautioned not to place undue reliance on those forward-looking statements, which speak only as of the date of this document. Past performance cannot be relied upon as a guide to future performance.
Except as required by applicable law, S&T AG undertakes no obligation to revise these forward-looking statements to reflect events and circumstances after the date of this presentation, including, without limitation,
changes in S&T’s business or strategy or to reflect the occurrence of unanticipated events. The financial information and opinions contained in this document are unaudited and are subject to change without notice.
This document contains summarized information or information that has not been audited. In this sense, this information is subject to, and must be read in conjunction with, all other publicly available information,
including if it is necessary, any fuller disclosure document published by S&T AG. None of the Company, its subsidiaries or affiliates or by any of its officers, directors, employees, advisors, representatives or agents shall
be liable whatsoever for any loss however arising, directly or indirectly, from any use of this document its content or otherwise arising in connection with this document.
This document or any of the information contained herein do not constitute, form part of or shall be construed as an offer or invitation to purchase, subscribe, sale or exchange, nor a request for an offer of purchase,
subscription, sale or exchange of shares / securities of S&T AG, or any advice or recommendation with respect to such shares / securities. This document or a part of it shall not form the basis of or relied upon in
connection with any contract or commitment whatsoever.
This document does not constitute an offer to purchase securities in the United States, Canada, Australia, South Africa and Japan. Securities, including the bond of S&T AG may not be sold or offered for sale within the
United States or to or for the account of / in favor of US citizens (as defined in Regulation S under the U.S. Securities Act of 1933 in the current version (the "Securities Act") unless they are registered under the
regulations of the Securities Act or unless they are subject to an exemption from registration. Neither S&T AG nor any other person intend to register the offer or a part thereof in the United States or to make a public
offer of the securities in the United States.
27S&T AG
Industriezeile 35
A-4021 Linz
www.snt.at
IR Contact:
ir@snt.at
+43 (1) 80191 - 1196
28You can also read