Cairn Homes plc 2019 Interim Results Presentation
←
→
Page content transcription
If your browser does not render page correctly, please read the page content below

Cairn Homes plc
      2019 Interim Results Presentation

Six Hanover Quay, Dublin 2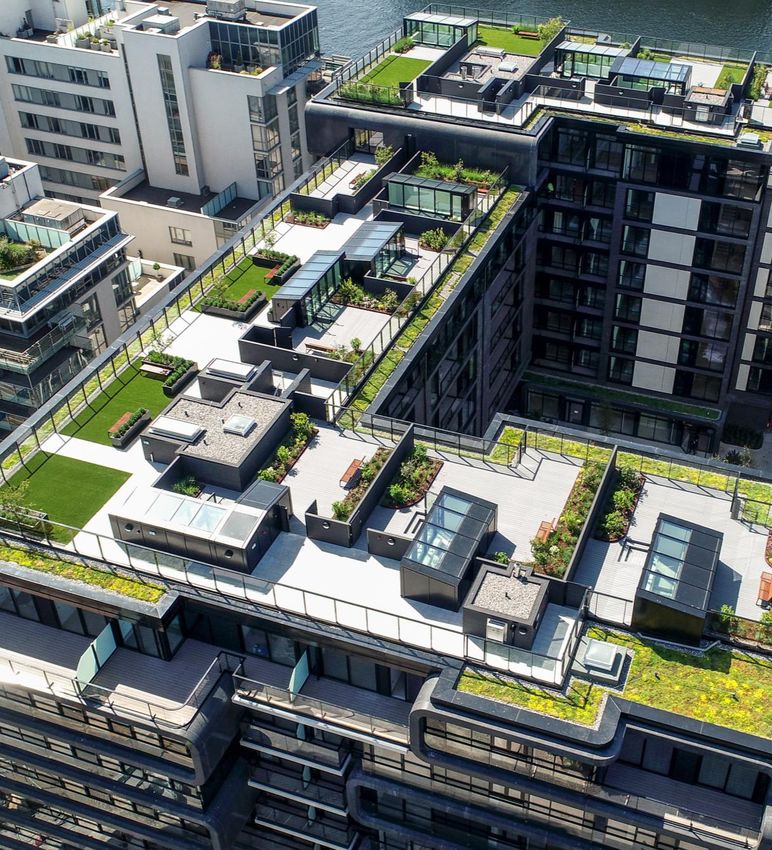
2019 Interim Results Presentation

                                      Table of Contents           Page

Michael Stanley                        1     Highlights           02
Co-Founder & CEO
                                       2     Financial            08

                                       3     Operations           12
Ian Cahill
Head of Finance
                                       4     Market & Land Bank   16

                                       5     Outlook              23

Declan Murray
Head of Investor Relations
                                       6     Appendices           25

                                                                         1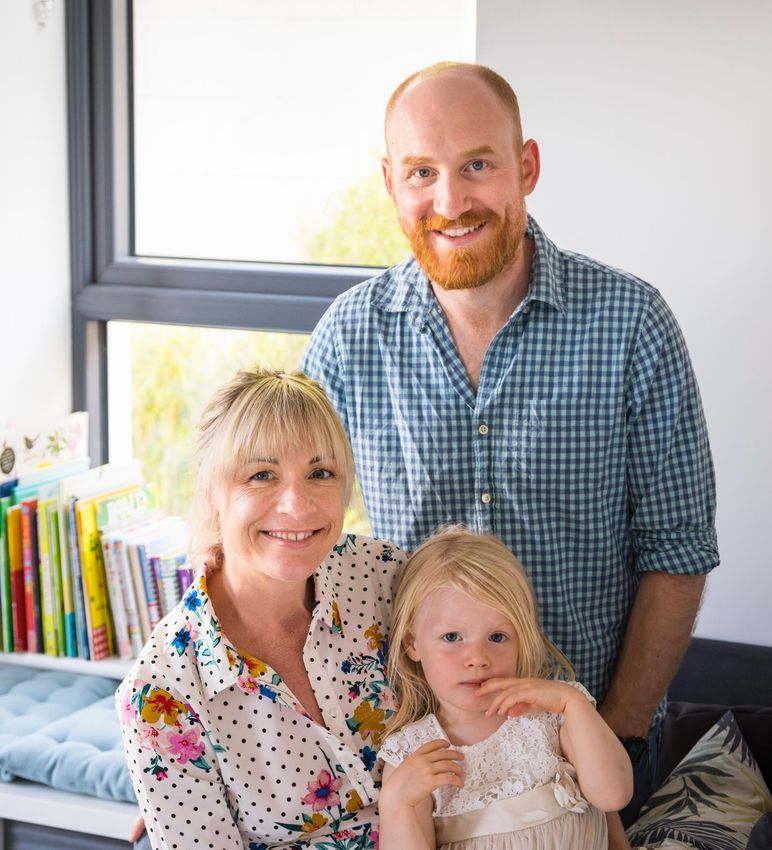
01
                                      Highlights

New owners in Glenheron, Greystones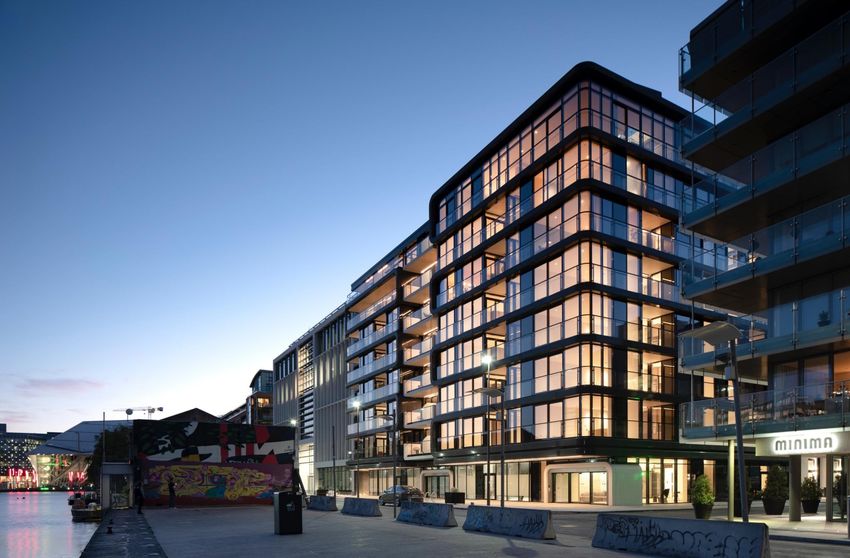
Financial Highlights

                                                                                                                       ASPs

       €192.4m (+48%)
                                                              Sales                                   Units                                      Revenue
                                                                                                              Houses Apartments        Overall
                                                              H1 2019                                  390    €337k        €608k       €449k     €175.3m
       Revenue                                                H1 2018                                  293    €326k        €599k       €393k     €115.2m
       (H1 2018: €130.2m)

                                                              2019 – closed and forward sales*        1,250   €326k        €413k       €357k     €446.6m

       €35.7m                     (+37%)                     €27.3m               (+51%)                       2.37cent               (+139%)
       Gross profit                                          Operating profit                                  EPS
       (H1 2018: €26.1m)                                     (H1 2018: €18.1m)                                 (H1 2018: 0.99 cent)
       Underlying gross margin 20.5%**
       (H1 2018: 20.0%)

       €937.0m                                               €44.7m                                            €96.5m
       Inventories                                           Operating Cash Flow                               Net Debt
       (FY 2018: €933.4m)                                    (H1 2018: cash outflow €9.3m)                     (FY 2018: €134.4m)

              Another period of significant growth in revenue, profits and cash generation

Note: All ASPs are exclusive of VAT   * As at 11 September 2019             ** Excluding Six Hanover Quay                                                  3
Capital Returns

                Share buyback programme                     Interim ordinary dividend to
              commencing 13 September 2019                  be paid on 18 October 2019

               €25 million                                      2.5 cent
2019

                                        €44.7m
                                  shareholder returns announced today

                          2019 interim dividend is the commencement of a
Long-Term

                             progressive biannual ordinary dividend
            Distribution of surplus capital above ordinary dividends will be in the form of
                               share buybacks or special dividends

                                                                                              4
Illustrative Cash Generation 2019 – 2022

                                                                            Assumptions behind the Cash
€’m
                                                                            Generation Illustration to 2022
600
                                                                            • Term bank debt remains constant at €150m

400                                                                         • No house price inflation or build cost inflation
                                                                            • WIP investment in 2021 and 2022 delivering
200
                                                                              revenue post-2022
                                                                            • Land acquisitions – focus on strategic / opportunistic
                                                                              acquisitions largely funded by site disposals
 0
          2019              2020             2021            2022           • Land bank reducing over this time to c. 9,500 units
        WIP & Other Costs          Revenue          Cumulative Cash

 Significant Free Cash                               Normalised Land Bank                       Homes to be Built without
Generation 2019 to 2022                             in c. 2024 Expected to be                   Replenishing Land Bank

       c. €500m                                         4 – 6 Years                                     c. 8,000
      or c. 60% of market cap                               annual homes sold                 with further additions to our land bank
                                                                                               in the short to medium-term likely to
                                                                                                     be balanced by disposals

                                                                                                                                        5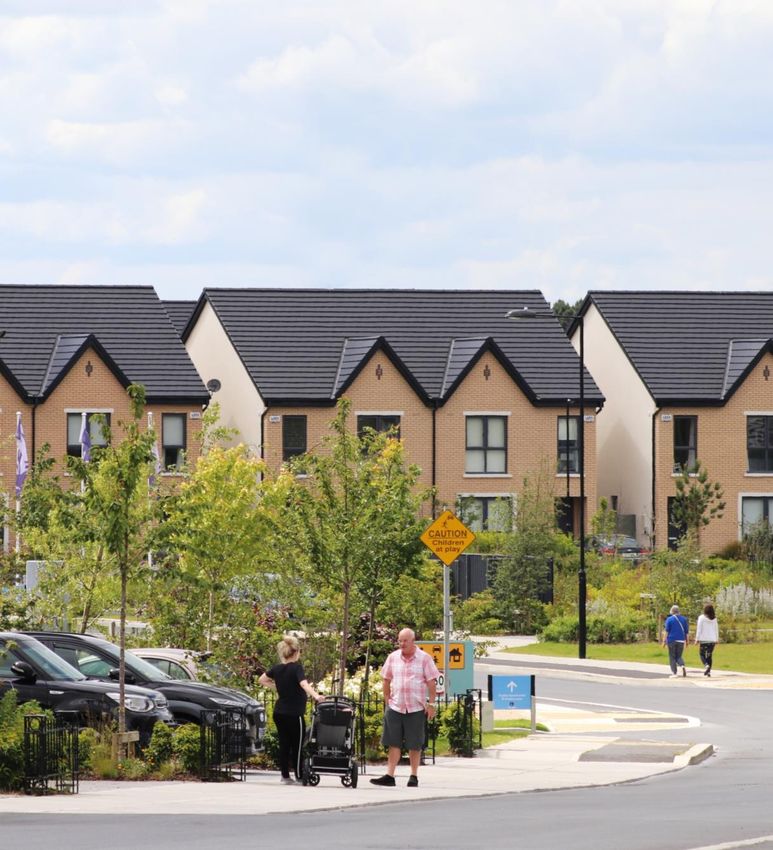
Market Leading Sales Performance

               On Target for 2019                  Strong Sales Absorption                Cairn H1 2019 Completions
                 Unit Delivery                          Rates in 2019

                  c. 1,100                             2.87 units                                    + 33%
                     closed sales                   per active housing sales outlet       year on year compared to the rest of
         Currently active on 15 developments     Selling on 12 sites and a strong start    the GDA market completions +12%
                                                     to the Autumn selling season
                                                Q2 2019 new home sales + 95% YoY

              2019 YTD Starter Home                     Multifamily PRS                     Closed Sale and Forward
              ASP for our Customers                      Transactions                            Order Pipeline

                €341,000                                   €195m                                  €446.6m
        (incl. VAT) on 617 closed and forward    one sale completed (€101m) and           on 1,250 units at an ASP of €357,000
               sale starter homes in 2019          one sale contracted (€94m)                          (ex. VAT)
          HPI c. 1.8% in the last 12 months        Further transactions expected

Source: CSO                                                                                                                      6
2019 Full Year Outlook

c. 1,100 closed sales expected in 2019

• As in previous years and reflecting our continuing growth, revenue is
  weighted towards the second half of the year
                                                                                  Customers Who have Chosen
• For the full year, increasing guidance marginally from c. 1,075 to c.1,100        a Cairn New Home in our
  closed sales at an ASP of c. €370,000 - €380,000 and a gross margin of                First Four Years
  c. 19.5% based on our contracted forward sales
• Non-core site disposals, if completed in H2 2019, would improve this
  expected margin and profitability for 2019

                                           H1 2019         FY 2019 (Outlook)
                                                                                         2,500
                                                                                 with 1,800 of these customers already
  Closed units                                  390                   c. 1,100        moved into their new homes

  ASP                                     €449,000     c.€370,000 - €380,000

  Gross Margin                               18.6%                    c.19.5%

                                                                                                                         7
02
                                             Financial

Roof Gardens at Six Hanover Quay, Dublin 2
Income Statement for the Six Month Period Ended 30 June 2019 (Unaudited)

                                                                         Commentary
                            June 2019 Unaudited    June 2018 Unaudited
                                                                         • Revenue of €192.4m (+48%)
                                          Total                  Total
                                                                           from the sale of 390 units
                                            €m                     €m      (€175.3m) and site sales
                                                                           (€16.2m)

                                                                         • ASP’s in H1 were boosted by
Revenue                                  192.4                  130.2      the sale of 120 units at Six
                                                                           Hanover Quay at an ASP of
Cost of sales                           (156.7)                (104.1)
                                                                           €705,000 (excl. of VAT)
Gross profit                               35.7                  26.1
                                                                         • Gross profit of €35.7m (+37%)
 % margin                                18.6%                 20.0%       (H1 2018: €26.1m). A gross
                                                                           profit margin of 18.6% (H1
                                                                           2018: 20.0%)
Administrative expenses                    (8.4)                 (8.0)   • Administrative expenses of
Operating profit                           27.3                  18.1
                                                                           €8.4m (H1 2018: €8.0m)

Finance costs                              (5.5)                 (5.9)   • Operating profit of €27.3m
                                                                           (H1 2018: €18.1m)
Exceptional finance costs                      -                 (3.2)
                                                                         • Earnings per share 2.37 cent
Profit before tax                          21.8                   9.0      (H1 2018: 0.99 cent)
Tax charge                                 (3.1)                 (1.0)

Profit for the period                      18.7                   8.0

Basic earnings per share               2.37 cent             0.99 cent

                                                                                                           9
Balance Sheet at 30 June 2019
Commentary
June 2019 Unaudited December 2018 Audited
€m €m
• Total assets of €1,091.8m
PP&E and intangibles 2.5 2.2
(31 December 2018: €1,005.8m)
Right-of-use asset 1.3 -
Non-current assets 3.8 2.2
• Total equity of €775.2m
(31 December 2018: €756.5m)
Inventories 937.0 933.4
Other receivables 4.8 8.0 • Inventories of €937.0m, including
Cash 146.2 62.2
construction work in progress
Current assets 1,088.0 1,003.6
(€214.6m)
Total assets 1,091.8 1,005.8
• Net debt €96.5m (31 December
2018: €134.4m) includes
Share capital and share premium 200.4 750.4
€146.2m cash. Net debt to
Share-based payment reserve 8.1 7.8
Retained earnings 562.6 (6.1)
inventories of 10.3% as at 30
Non-controlling interest 4.1 4.4
June 2019 (31 December 2018:
Total equity 775.2 756.5 14.4%)
Loans and borrowings 192.7 147.3
• Undrawn facilities at
Lease liabilities 1.0 - 30 June 2019 of €149.0m
Deferred taxation 5.3 5.9
Non-current liabilities 199.0 153.2 • Retained earnings €562.6m
(31 December 2018: retained
Loans and borrowings 50.0 49.3 losses €6.1m) following the
Lease liabilities 0.3 - €550m capital reorganisation and
Trade and other payables 67.3 46.8 profits generated in the period
Current liabilities 117.6 96.1
Total equity and liabilities 1,091.8 1,005.8
10Cash Flow Statement for the Six Month Period Ended 30 June 2019 (Unaudited)
Commentary
June 2019 Unaudited June 2018 Unaudited
€m €m
• EBITDA of €28.1m
EBITDA 28.1 18.8 (H1 2018: €18.8m)
Increase in inventories (3.4) (39.1)
• Net cash from operating activities
€44.7m (H1 2018: outflow €9.3m)
Other working capital movements 20.0 11.0
Net cash from / (used in) operating activities 44.7 (9.3) • €3.4m increase in
inventories represents spend
Purchases of PP&E and intangibles (0.7) (0.2) on active developments and a
Transfer from restricted cash - (0.1) reduced level of site acquisitions,
Net cash used in investing activities (0.7) (0.3) less sales releases and site
sales. Total spend on
construction work in progress
Proceeds from borrowings, net of debt issue costs 45.0 5.3
€147.7m (H1 2018: €107.8m)
Repayment of loans - (11.9)
Dividends paid to non-controlling shareholder (0.3) - • Cash and cash equivalents of
Other net cash movements (0.2) -
€146.2m at 30 June 2019 (H1
Settlement of contingent consideration for Argentum acquisition - (3.3)
2018: €46.4m)
Interest and other finance costs paid (4.5) (2.9)
Net cash from / (used in) financing activities 40.0 (12.8)
Net increase / (decrease) in cash and cash equivalents 84.0 (22.4)
Cash and cash equivalents at the beginning of the period 62.2 68.8
Cash and cash equivalents at the end of the period 146.2 46.4
1103
Operations
Gandon Park, LucanOur Sustainable Business
Quality Homes Innovation
Market recognising Cairn’s
commitment to quality
Timber frame duplex units
A3 Bathroom pods
energy rating of all
our new homes SFS framing
Electric car points
8 days
average snagging turnaround
Placemaking Community
5 €70m
commitment to 2021
trees planted for every new for public realm and
home we build infrastructure
13 40 acres
playgrounds and of parks and green areas
outdoor gyms delivered delivered
13People
Supporting Our People Our Talented Team
• Four recent appointments adding more depth and
Apprenticeship Programme experience to our senior management team:
continue to provide financial support to subcontractors in
supporting their apprenticeship programmes
Maura
Sarah Winston
Murray
Director of
Director of Organisation
Graduate Programme Customer and People
intern programme in place since 2016 with 19 interns
placed to date, of which five have subsequently become full
time employees upon graduation
Kevin Fergus
Cleary McMahon
2,500 Full-time People Technical Commercial
Director Director
now working across our active sites
14Scale and Procurement Advantages
Collaboration with our established subcontractor base and supply chain optimisation
are driving procurement efficiencies as we leverage our scale and business model
Procurement – current committed order book on active sites €300m
Top 20 subcontractors 67%
Average total contact value awarded to Top 20 subcontractors €20m
Average number of sites of Top 20 subcontractors 6
€148m procurement in H1 2019 2.5% annual build cost inflation
Fixed Construction Costs 2019 2020
Fixed price agreements in place on active
developments providing certainty on costs
% of Build Costs Fixed 95% 68%
Market leading efficiency and Cairn’s unique position as the industry’s biggest procurer of labour and
materials acts as a hedge against build cost inflation
Efficiency also driven by standardisation across starter home sites and approach to innovation
1504
Market &
Land Bank
Donnybrook Gardens, Dublin 4Characteristics of Housing and Apartments
Key Metrics and Characteristics Housing Apartments * Total Land Bank
Capital Allocation 55% 45% 100%
Total Units 10,800 4,600 15,400
Average Site Cost per Unit €36k €68k €45k
Average Selling Price
€308k €527k €373k
(estimated) (ex. VAT) (no HPI)
Net Development Value (“NDV”) €3.3bn €2.4bn €5.7bn
Land (at historical cost) as a % of NDV 11.7% 13.0% 12.2%
Average Site Size (units) 480 300
c. €80 – €90k
Typical Purchaser Income €150k +
(single or joint)
Mortgage Backed Mortgage Backed,
Purchaser Profile (incl. Help to Buy), Local Cash Purchasers, Institutional
Authorities, Investors / Multifamily PRS Investors
* Includes apartments which will be built for homeowners and private investors at higher ASPs and apartments for institutional buyers of multifamily PRS at lower ASPs 17Composition of c.15,400 units
Targeted Capital Allocation
10%
30%
• GDA – 95%
capital allocation
15%
• 90% of units
Unit Buyer 57%
Type Profile • 100% of active
developments
70% • 90% of all units
18% contracted by the
end of 2015
FTB (from €250k – €375k) Capital
Houses Units Allocation
Trade Up / Mover (from €375k – €550k)
Dublin - within M50 3,950 45%
Premium (from €550k)
Dublin - outside M50 5,950 21%
Apartments Social
Rest of GDA 4,100 29%
Regional 1,400 5%
Total 15,400 100%
18# Land Bank Units * Our Land Bank and Addressable Market
4,000
3,100
2,400
2,200
1,400 800
ASP (incl.
€250k - €300k €300k - €350k €350k - €400k €400k - €450k €450k - €500k €500k + VAT)
Cumulative % of our land bank* addressing these price points
29% 51% 67% 77% 83% 100%
FTB– salary range €65k to €90k. Up-sizer – have equity Institutional investors –
Buyer Profile
Mortgage rules –price sensitive Down-sizer – empty nesters, usually mortgage seeking completed stock
Government / Affordable Housing free from strong counterparties
Body’s - social housing Retail investors – generally
Young professionals – salaries > €80k. More
likely to avail of mortgage rule exemptions cash purchasers
Down-sizers
* Analysis excludes c. 1,500 social units 19Sales Absorption Rates
Housing Site Sales Autumn selling season
• Average 2019 year to date weekly sales rate of 2.87 • Positive start to season. 11 site reopenings with continuing
units per active housing sales outlet (2018: 2.78 strong demand for our competitively priced starter homes
units; 2017: 2.38 units) • New show unit complexes at Mariavilla (Maynooth),
Glenheron (Greystones), Shackleton Park (Lucan)
and Elsmore (Naas)
Average Weekly Sales since • First launch of premium apartments at Donnybrook
Site Formal Sales Launch Gardens (Dublin 4) scheduled for Q4 2019
• Introduced duplex homes (ground floor two-bedroom
apartment, upper floors three-bedroom houses) at five
Parkside 2.5 sites - lowering the entry price and broadening the buyer
pool
Churchfields 2.6
Shackleton Park 4.0
Glenheron 3.0
Elsmore 2.2
Gandon Park 4.1
Edenbrook 5.3
Mariavilla 2.9
Oak Park 4.9
20The Irish Multifamily PRS Market – H1 2019
Positive Backdrop
• 43% of all real estate investment in H1 2019 1000 € 930m € 898m 6.0%
5.0%
• Current residential yields 3.85% and rental 800
inflation 4.4% 600
4.0%
3.85% 3.0%
• There are only c. 1,500 properties currently 400
available to rent in Dublin 2.0%
200 1.0%
• Only 1,000 new apartments completed in
Dublin in H1 2019 0 0.0%
2015 2016 2017 2018 H1 2019
Investment Amount Dublin Prime Yields
Cairn – Positioned to Leverage PRS Opportunity
5 11 €33k €195m €7bn
Active apartment sites Apartment sites Average PRS site PRS sales delivered Domestic and
(1,100 units) suitable for PRS cost international institutional
c. 3,300 Ongoing engagement
on other
capital targeting Irish
multifamily PRS
Units developments
Source: Savills, Hooke & MacDonald, Daft.ie, CSO 21Exceptional Design and Planning
Land Bank Planning Status Efficient Planning Processes
• The Strategic Housing Development (SHD) and
2% Strategic Development Zones (SDZ) processes covers
29% our entire residentially zoned land bank:
31%
No
Planning SHD Process SDZ Process
Risk
Full Planning Permission One step planning Eight week fast-track planning
process process (no appeals)
16% SDZ (effective FPP)
In Planning (SHD process)
22% 7 applications granted 5 applications granted
Residentially Zoned planning (2,112 units) planning (1,029 units)
Subject to Zoning
8 applications in process 1 application in process
• 98% success rate delivering 5,686 units (c. 3,500 units) (c. 184 units)
Average duration – Average duration –
30 weeks 8 weeks
2205
Outlook
Shackleton Park, LucanOutlook
Up to 9 new site
commencements in Further multifamily PRS
the next 6 – 12 months sales expected across both
and strong forward apartments and housing
sales pipeline
c. €500m cash generation
c. 1,100 closed sales in (or c. 60% of market cap)
2019 and a gross margin of by the end of 2022
c. 19.5%
€44.7m shareholder returns
announced today
2406
Appendices
Churchfields, AshbourneMacroeconomic Drivers for Cairn
Supply
Population 19.4k new homes Annual Housing
+1.3% (+ 64,500) in year to H1 2019 – only Demand
in the year to April 2019 14.4k in multi unit ESRI Estimate
(3x EU average) developments of which 35,000
10k are in the GDA
GDA annual demand –
c. 20k
Employment Shortfall in
& Wage Inflation New Homes
Employment c. 84k since
+437k since 2012
Government
June 2015 IPO
Initiatives
Wage inflation
+3.2% in 2018 Rebuilding Ireland
Competitive Project Ireland 2040
Mortgage Market LIHAF
Competition Dublin Rents and
Owning Fast-track Planning
intensifying on headline House Prices
versus Renting Help to Buy
mortgage rates Rents 35% higher
+50% more expensive to Apartment Design than previous peak
Drawdowns (value) Guidelines
rent than own a 3-bed
+13.8% in year to June House prices 22.2%
home in Dublin Building Height Guidelines
2019 below previous peak
Source: CSO, Eurostat, ESRI, Banking Payments Federation of Ireland, Daft.ie, Goodbody, Company estimates 26Well Located Housing Sites
c. 10,800 units with excellent public Active Units
transport links and no planning risk 1 Parkside, Malahide Road 395
2 Churchfields, Ashbourne, Co. Meath 397
3 Elsmore, Naas, Co. Kildare 500
4 Shackleton Park, Lucan 756
5 Glenheron, Greystones, Co. Wicklow 426
6 Mariavilla, Maynooth, Co. Kildare 462
2 7 Albany, Killiney 20
8 Oak Park, Naas, Co. Kildare 248
13
9 Gandon Park, Lucan 237
10 Edenbrook, Citywest, Dublin 24 145
17 1 2019 / 20 Commencements
6 11 Clonburris, Dublin 22
12 Cherrywood, South Co. Dublin
13 Swords, Co. Dublin
9 4 1
11
0 14 Newcastle, Co. Dublin
15 Farrankelly, Delgany, Co. Wicklow
1
14 1
102 22 23 16 Enniskerry, Co. Wicklow
3
17 Parkside, Malahide Road (NAMA JV)
1
12
1 7 21
Future
8
3 18 18 Douglas, Cork
19 Blessington, Co. Wicklow
16
19 20 Coolagad, Greystones, Co. Wicklow
20 21 Callan Road, Kilkenny
22 Rahoon, Galway
15 5 23 Ballymoneen Road, Galway
* Exclusive of VAT and HPI 27Competitively Priced Starter Homes
Starter Homes Priced to Sell at Volume
• Our starter homes closed sales in H1 2019 were all
priced between €275,000 and €375,000 (incl. of VAT) House Price Cairn Land
Purchaser
• The ASP of our 214 starter homes sales in the period Bands (€’000) Bank Units
was €343,000 (incl. of VAT) 250 – 300 4,000
• An analysis of the H1 2019 Property Price Register* FTB 300 – 325 1,600
shows that 65% of all new homes sold in the GDA in H1
325 – 375 3,200
2019 were sold for in excess of €343,000
8,800
• Our closed and forward order book as at 11 September
2019 contains 617 starter homes at an ASP of €341,000
Cairn Starter Home Statistics
57% ASP- €341k 90%
of Cairn Land Bank in 2019 on 617 units of our FTB’s are couples
€26k 354k – couples can afford to buy a
Average Site Cost new home at or below €350k
* The PPR is produced by the Property Services Regulatory Authority. All residential properties purchased in Source: Property Price Register, Revenue.ie 28
Ireland are recorded on the PPR as declared to the Revenue Commissioners for stamp duty purposes.Prime Apartment Sites
c. 4,600 units in and near Dublin City Active PRS Opportunity Units
1 Marianella, Rathgar, Dublin 6W 208
3
SCALE 2 Donnybrook Gardens, Donnybrook, Dublin 4 86
1 km
3 Griffith Wood, Griffith Avenue, Dublin 9 385
4 Rostrevor Place, Marianella, Rathgar, Dublin 6W 108
5 The Quarter at Citywest, Dublin 24 314
Planned 2019 / 20
6 Montrose, Dublin 4
7 Parkside, Malahide Road
6
2
1 4 Future
8 Stillorgan, Co. Dublin (incl. PBSA)
9
9
9 Cross Avenue, Blackrock
10 Mariavilla, Maynooth, Co. Kildare
11 8
11 Swords, Co. Dublin
7 16 12 Glenheron, Greystones, Co. Wicklow
10
13 Barrington Tower, Carrickmines, Dublin 18
14 5
14 Citywest, Dublin 24
15 Glenamuck Road, Carrickmines, Dublin 18
13
12 15 16 Parkside, Malahide Road (NAMA JV)
* Exclusive of VAT and HPI 29GDA Undersupply – Lagging Demand
Cairn GDA Supply Forecast – Structural Imbalance to Remain
GDA – 12 Months to June 2019
22,000
GDA Demand – 20,000 units 10,879 completions - 920 (8%) one off houses
19,000 Only 2,198 apartments; 7,761 new homes in multi-
Estimated Undersupply
2019 – 2023: c. 27,500 units unit developments
16,000 69% of national multi-unit supply
13,000 National – 12 Months to June 2019
19,388 completions - 4,999 (26%) one off houses
10,000
2019 2020 2021 2022 2023 c. 2,500 social homes and completed units sold
Supply - GDA (Cairn Estimate) Demand - GDA to government (AHB’s)
• 10,879 new units delivered in the GDA in the 12 months Less than c. 12,000 multi-unit development new
homes
to June 2019
• We estimate that output will increase by c. 1,500 units per Top 20 homebuilders – c. 4,200 units or 22%
annum into the medium term
• GDA accounts for 43% of the population (+6.2% in last
5 years) and housing needs of growing population not Scale of undersupply of new homes in Ireland since
being addressed Cairn IPO in June 2015: 84,132
Source: Company estimates, CSO, Property Price Register 30H1 2019 Multifamily PRS Transactions
No. of Reported
Property Buyer Type Status
Apartments Price
XVI Portfolio (predominantly in Dublin) 815 REIT Existing Stock Completed €285m
Project Turner (Dublin, Cork & Galway) 600 International institutional investor Existing Stock Completed €150m
Fairway, Cualanor, Dun Laoghaire 214 International institutional investor New Build Completed €108m
Six Hanover Quay, Dublin 2 120 Domestic institutional investor New Build Completed €101m
Heuston South Quarter, Dublin 8 266 International institutional investor Existing Stock Completed €95m
Taylor Hill, Balbriggan & Semple Woods, Donabate 118 REIT New Build Completed €38m
Dublin Landings, Dublin 1 268 International institutional investor New Build Sale Agreed €175m
The Quarter at Citywest 282 International institutional investor New Build Sale Agreed €94m
Mount Argus, Harolds Cross, Dublin 6W 166 Domestic institutional investor New Build Sale Agreed €93m
The Benson Building, Grand Canal Dock, Dublin 2 72 International institutional investor New Build Sale Agreed €53m
Circle Collection, Dublin 213 International institutional investor Existing Stock Sale Agreed €46m
Citywest Village, Dublin 24 129 International institutional investor New Build Sale Agreed €45m
Acord Collection, Tallaght, Dublin 24 122 International institutional investor Existing Stock Sale Agreed €30m
Value of Completed H1 2019 Multifamily PRS Transactions Value of Sale Agreed H1 2019 Multifamily PRS Transactions
€898m €516m
Source: Savills, Hooke & MacDonald, CBRE, Independent.ie. Irishtimes.com 312019 Land Market Transactions
Acres Units Reported
Seller Seller Buyer
(estimate) (estimate) Price
DIT Kevin Street, Dublin 2 Technological University Dublin Private Homebuilder 3.6 Unknown €140m
Cherrywood SDZ, South Co. Dublin Private Equity Private Homebuilder 118 2,600 €120m
John Player Site, Dublin 8 NAMA Institutional Buyer 10.7 754 €105m
Drumcondra, Dublin 9 GAA (sporting body) Institutional Buyer 19 1200 €105m
Milltown Park, Ranelagh, Dublin 6 Religious Order Private Homebuilder 10.5 300 €65m
South Docklands, Cork Plc Private Homebuilder 31 Unknown €47.5m
Sandyford, Dublin 18 NAMA Private Homebuilder 3.8 539 €38m
Gort Muire, Ballinteer Religious Order Private Homebuilder 8 400 €35m
Cabra, Dublin 7 Private Homebuilder Private Homebuilder 9.6 420 €34.5m
Barnhall, Leixlip, Co. Kildare Private Homebuilder Plc 47 450 €28.4m
Rathborne, Ashtown, Dublin 15 NAMA Private Homebuilder 12.3 700 €22m
Kilbelin, Newbridge, Co. Kildare Private Homebuilder Plc 27 343 €21.6m
Sandyford, Dublin 18 Private Homebuilder Private Homebuilder 7.2 243 €20m
Howth Castle, Howth Private Equity Plc 2.7 175 €15m
Douglas, Cork Private Homebuilder Private Homebuilder 7 150 €10m
Killruddery, Bray, Co. Wicklow Private Family Plc 47 200 €9m
Value of Residential Land Market in 2018 Value of Residential Land Market year to date in 2019
€1,550m > €800m
Source: Savills, Hooke & MacDonald, CBRE, Independent.ie, Irishtimes.com 32Positive Outlook for Affordability
Wage inflation outstripping Consumer Price Index Strong labour market
437k new jobs created
in Ireland since 2012 =
5.0% 2,400 16%
2,300 broader buyer pool
14%
4.0% 2,200
2,100 12%
3.0% 2,000 10%
1,900 8%
2.0%
1,800
1,700 6%
1.0%
1,600 4%
2007Q1
2007Q3
2008Q1
2008Q3
2009Q1
2009Q3
2010Q1
2010Q3
2011Q1
2011Q3
2012Q1
2012Q3
2013Q1
2013Q3
2014Q1
2014Q3
2015Q1
2015Q3
2016Q1
2016Q3
2017Q1
2017Q3
2018Q1
2018Q3
2019Q1
0.0%
-1.0%
2013 2014 2015 2016 2017 2018 2019f 2020f
Employment Unemployment
Wage Inflation CPI
Mortgage rates moving (slowly) in the right direction Expansionary Budgets
Impact on take home pay for a couple earning €80k
4.50% 3.0%
4.00%
2.0%
3.50%
3.00% 1.62% difference 1.0%
2.50%
Reduced to 1.07%
2.00% 0.0%
1.50%
-1.0%
Jun-15
Jun-16
Jun-17
Jun-18
Jun-19
Dec-15
Dec-16
Dec-17
Dec-18
Sep-15
Mar-16
Sep-16
Mar-17
Sep-17
Mar-18
Sep-18
Mar-19
-2.0%
2013 2014 2015 2016 2017 2018 2019
Variable Rate 1-3 Year Fixed Rate Euro Area Average
Source: CSO, Goodbody, Banking & Payments Federation of Ireland, CBI, Taxcalc.ie, Department of Finance 33Demographics Driving Demand
• Strong population growth is being driven by the highest birth rate in Europe (13.5 births for every 1,000 of
population), one of the highest household formation sizes in Europe (2.8x compared to 2.3x average) and inward
migration
• Our population will reach 5m in 2020 (4.92m in April 2019) and is forecast to grow to c. 5.6m by 2040. The
population of Dublin and the GDA is currently 2.12m and this is forecast to grow to 2.58m by 2040
Irish population by age category Average 1.1% annual population growth since 2015
1200 33% - youngest
population in the EU
1000 1.02m =
FTB pool
800
600
62% of all immigrants have a third level qualification since 2015
400
200
0
0-14 15-24 25-39 40-49 50-64 65-79 80+
% of all houses in Ireland Indebtedness of 25-34 age % of all houses in Ireland
rented by people aged < 39 category owned by people aged < 39
58% Amongst lowest in the EU 16%
Source: CSO, Project Ireland 2040, ESRI, Eurostat 34Mortgage Market Conditions
Two entrants to a more competitive market Drawdowns by value growing
€’m Total Loans
+13.8%
1,400 14,000
1,200 12,000
1,000 10,000
800 8,000
600 6,000
400 4,000
200 2,000
0 -
? Q1 Q2 Q3 Q4 Q1 Q2 Q3 Q4 Q1 Q2 Q3 Q4 Q1 Q2 Q3 Q4 Q1 Q2 Q3 Q4 Q1 Q2
2014 2015 2016 2017 2018 2019
?
No. of Loans FTB Purchase Mover Purchase Other
Size of mortgage market expected to grow significantly Key facts
€’m # Loans Year to H1 2019:
In the 3 years since the introduction 23,425 mortgages approved
14,000 60,000 of Help to Buy in July 2016,
for FTB’s (+ 6.7%)
71% of FTB mortgage drawdowns
12,000 have been for secondhand homes 6,285 mortgage drawdowns
€10.0bn 50,000
for FTB’s for new homes
10,000
€8.7bn
8,000 Competition amongst mortgage providers is targeted
40,000 Average FTB age is
at fixed rate customers – fixed rates as low as 2.3%
6,000 34 and LTV is 80%
available compared to EU average 1.61% in July 2019
4,000 30,000
2017 2018 2019 (F) 2020 (F) 2021 (F) July 2019: FTB mortgage approvals +35% YoY and highest monthly
approval level since previous peak
Value of mortgages (€bn) Number of mortgages
Source: Goodbody, Banking & Payments Federation of Ireland, CBI 35Cairn Brands
36Disclaimer
This presentation document (hereinafter “this document”) has Certain information contained herein constitutes “forward-
been prepared by Cairn Homes plc (“Cairn” or the “Company”). looking statements”, which can be identified by the use of
terms such as “may”, “will”, “should”, “expect”, “anticipate”,
This document has been prepared in good faith, but the “project”, “intend”, “continue”, “target” or “believe” (or the
information contained in it has not been subject to a verification negatives thereof) or other variations thereon or comparable
exercise. No representation or warranty, express or implied, is terminology. Due to various risks and uncertainties, actual
given by or on behalf of the Company, its group companies or events or results of actual performance of the Company may
any of their respective shareholders, directors, officers, differ materially from those reflected or contemplated in such
advisers, agents of other persons as to the accuracy, fairness forward-looking statements. No representation or warranty is
or sufficiency of the information, projections, forecasts or made as to the achievement or reasonableness of and no
opinions contained in the presentation. In particular, the market reliance should be placed on such forward-looking statements.
data in this document has been sourced from third parties. There is no guarantee that the Company will generate a
Save in the context of fraud, no liability is accepted for any particular rate of return, operating profit margin or that it will
errors, omissions or inaccuracies in any of the information or achieve its targeted number of homes (per annum or over a
opinions in this document. development period).
37www.cairnhomes.com
7 Grand Canal
Grand Canal Street Lower
Dublin 2
Ireland
D02 KW81
+353 1 696 4600
investors@cairnhomes.com
Glenheron, GreystonesYou can also read