Investor Briefing HY 2019/2020 - Centum Investment
←
→
Page content transcription
If your browser does not render page correctly, please read the page content below
Investor Briefing HY 2019/2020

28th November 2019

Centum 4.0
 Underlying Themes for FY20
                                                                                       KShs. 7.7 billion
                                                                                     Debt Repaid by HY20
                                                                                                                 •   Strong balance sheet with assets
                                                                                                                     that are not leveraged
                      •       Deleverage the                                           KShs. 3.5 billion
                              balance sheet                        Short term debt subsequently Repaid beyond
                                                                                      HY20                       •   On target to retire all debt on the
                                                                                                                     Centum balance sheet by June
                                                                                      KShs. 990 million              2020
                                                                            Annualized Finance Cost Savings

                          •   Enhance cash and                     The company closed the half year              •   Well positioned with sufficient
                              cash equivalent                      period with a liquidity position of               liquidity to take advantage of market
                              holding                                      KShs. 13.6 billion                        opportunities

                                                                                                1,316
                          •   Significant uptake of                               Units under Construction       •   Our real estate portfolio is performing
                              units within the RE                                                                    well with 63% of the units under
                              portfolio                                                          827                 construction already pre-sold
                                                                                          Pre-sold Units

1.Total Cash and Marketable Securities less short term facilities and current liabilities paid in October 2019

 2
Centum 4.0
Performance as at HY 2019/20 against the Strategic Pillars

Return &            On track having delivered significant returns through exits and investment activity
Dividend Pay-out

Capital Structure   Total debt repayment of KShs. 11.3 billion resulting in interest savings of KShs. 990 million.
and Liquidity       KShs. 11.9 billion in cash, fixed and call deposits and KShs. 2.8 billion in marketable securities

                    On track to bring operation costs to within 30% of cash annuity income
Operating Costs

Organizational      Continued compliance to corporate guidelines and portfolio monitoring resulting in reduced levels of
                    risk in the current operating environment
Effectiveness

                                                      Portfolio Allocation as a % of Total Assets

                    FY19                         51.6%                                              36.1%            6.2%   7.6%
Portfolio Focus
                    HY20                           56.1%                                                36.2%            4.4% 3.4%

                                  Real Estate      Private Equity      Marketable Securities         Development

3
Performance Highlights HY 2019/20
     Key Events and Performance Drivers
                                                                                              Marketable
                   Real Estate                           Private Equity                                                       Development
                                                                                              Securities

         56.1%                 51.6%           36.2%                   38.5%        4.4%                   5.6%        3.4%                4.3%

     of Total               of Net Asset      of Total              of Net Asset   of Total            of Net Asset   of Total          of Net Asset
      Assets                   Value           Assets                  Value        Assets                Value        Assets              Value

                 1,316                             KShs. 8.97 billion                Shift to Fixed Income                       IFRS 9 Impact
  Units under Construction                               Total PE Assets           Enhancement of Cash Income             Accounting provisions

                                    63%
                 827                                KShs. 8.4 billion                            33%                       KShs. 2.28 billion
           Pre-sold Units                         Liquidity available for              Portfolio Allocated to             Provisions recorded in
                                 of Phase 1
                                                       Investment                          Fixed Income                           HY20
                                 Units
    KShs. 6.05 billion                            KShs. 18.60 billion
Sales Value of Pre-sold Units                 Exit Proceeds from Bottlers

            Over 22%
     Deposits Collected
                 80%
     Occupancy at Two
        Rivers Mall
     4
Sustainably Investing in Our Communities Aligned to the SDGs

             •   152 scholarships awarded to date in Vipingo
             •   Shortlisting of candidates for the next academic
                 year ongoing

             •   172 NYS graduates onboarded into Tribus - TSG
             •   >5,000 successful hires through the Ajiry App
             •   Plan to establish 10 Ajiry Job and Training
                 Centres across ten counties
             •   +100 graduates of the Vipingo Vocational training
                 program

5
Employer of the Year
Top 10 in All 7 categories
                                                      Category                                       Rank
                        Leadership &    Legal, governance and compliance audits, gender diversity
                                                                                                     #1
                        Governance      (women) at Board level

                                        Collaborative workplaces, wellness facilities in place,
                        Workplace                                                                    #1
                                        green
                        Environment     agenda

                        Corporate       Achievement and surpassing of set business targets and
                                                                                                     #3
                        Performance     daily monitoring of the same

                        Innovation &    Use of robotics, data analytics and high level of employee
                                                                                                     #4
                        Productivity    involvement and link to reward and recognition

                                        High Employee Engagement index and initiatives in place
                        HR Practices                                                                 #8
                                        to ensure motivation, great employee benefits

                        Inclusiveness   50% Gender balance, recognition of PLWD and diverse
                                                                                                     #9
                        & Diversity     groups with support systems

                        Learning &      Certified coaches and monitoring and evaluation of
                                                                                                     #9
                        Development     coaching in the workplace

                        Overall                                                                      #4

6
Performance Highlights HY 2019/20
6-month period ended 30 September 2019

                  Growth in Consolidated Profit after Tax                     KShs. 6.79 billion            +226%
       Group                                                                       Net profit
    Performance
     Highlights
                  Exit realisations from Almasi and Nairobi Bottlers         KShs. 18.60 billion
                  transaction                                          Proceeds on disposal, net of taxes

                                                                              KShs. 1.48 billion            +49%
                  Growth in Operating Profit                                   Operating profit

     Company      One-off Impairment                                          KShs. 2.28 billion
    Performance                                                              Impairment provision
     Highlights
                  Movement in Shareholder Funds                              KShs. 50.26 billion              -4%
                                                                                  Net assets

                  Decrease in Long Term Debt                                  KShs. 6.38 billion             -54%
                                                                                Long term debt
7
Portfolio Review

8

Portfolio Review
Summary as at 30 September 2019
          Real Estate                                          Private Equity                                 Marketable Securities                              Development

              51.6% | KShs. 39. 97                                     38.5% | KShs. 29.11                                   5.6% | KShs. 4.22                            3.4% | KShs. 3.22
                 NAV per share                                            NAV per share                                        NAV per share                               NAV per share
    KShs.                                                    KShs.                                                 KShs.                                        KShs.
    25.93                                                    19.37                                                  2.81                                         2.14
    billion                                                  billion                                               billion                                      billion
     NAV                                                      NAV                                                   NAV                                          NAV

                KShs. 35.57 billion                                     KShs. 22.94 billion                                   KShs. 2.81 billion                          KShs. 2.14 billion
                   Total Assets                                            Total Assets                                         Total Assets                                 Total Assets

                    Total Assets                                                Net Asset Value                                       Net Asset Value
                                                            11.4%                                                    4.0%                                             4.0%
                    KShs. 63.46 billion                                         KShs. 50.26 billion                                   KShs. 75.5 per share

                                           Total Assets                                          Net Asset Value                              Net Asset Value Per
                                                                                                                                                      Share

                                        71.60                                                    52.60
                                                                                                                                              79.05
                        Kshs. Billion

                                                                                 Kshs. Billion
                                                                                                            50.26
                                                                                                                                                              75.42
                                                     63.46

                                                                                                                                      Kshs.
                                        FY19         HY20                                        FY19        HY20                              FY19           HY20

9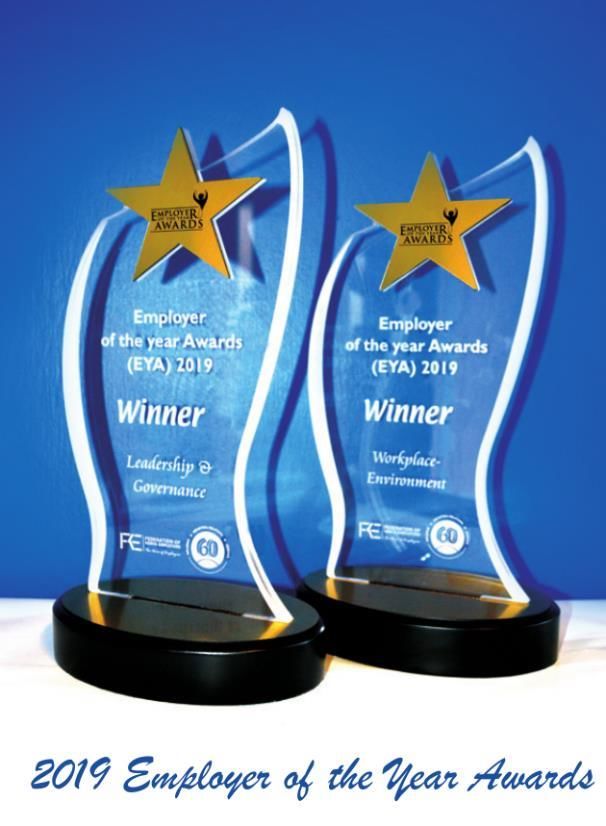
Portfolio Review
                  Market Cap. Attribution
                                                                                     Portfolio Assets              NAV/Share
                       Significant Value Opportunity for Investors
                                                                                     Sidian Bank                       3.52
                                                                   Kshs. 13.61 per   Isuzu East Africa                 3.34
                                                                    share for PE     Longhorn Publishers               1.71
                       31.45                         26.58                           NAS Servair                       1.27
                                                                                     ACE Holdings                      1.25
                                                                                     Other Private Equity Assets       1.06
                                                                     KShs. 12.97
                                                                                     Private Equity                   13.61
                                                                    per share for
                                                                      RE + Dev.
                                                                                     Two Rivers Development           12.58
KShs. Per Share

                                                                                     Vipingo Development              18.20
                                                                         Vs.
                                     4.87                                            Pearl Marina                      7.82
                                                                   KShs. 43.00 per   Other Real Estate Assets          1.37
                                                                    share NAV for    Real Estate                      39.97
                                                                      RE + Dev.
                                                                                     Akiira                            2.59
                  Share Price         Cash +          Implied
                                                                                     Amu Power                         0.00
                       as at 30    Marketable       Valuation of                     Greenblade Growers                0.42
                   Sept. 2019     Securities less    PE + RE +                       Other Development Assets          0.02
                                    Liabilities        Dev.
                                                                                     Development                       3.03
                                   (OD+Bond)
                  10                                                                 Total Portfolio                  56.61
Portfolio Review
Market Values vs. Transaction Price for Land Banks
The underlying land banks are valued below the last transaction price, representative of our conservative
approach to valuations
Carrying Value per Last Transaction Value of Debt at
Acre Price per Acre Asset Level
Development Shareholding Acres (KShs. million) (KShs. million) (KShs. million)
Vipingo 100% 10,254 1.54 10.0 --------------
Pearl Marina 100% 389 24.74 29.56 --------------
Two Rivers 58% 107 304.93 432.69 9,206
KShs. 4.2b of the Two Rivers debt is guaranteed by Centum the rest is non-recourse to Centum
11Real Estate
Managed by
12Real Estate
Strategic Pillars
Under Centum 4.0 (five year strategy from 2019 – 2024), the Centum Group’s focus is cash returns. Centum
Real Estate is pursuing a four-pronged real estate strategy
Pillar Rationale Objective
Infill Shift from a develop and sale model to Sale of infill developments with our
1 a sale and develop model
Projects current landbank
Focus on monetizing existing land bank
by selling bulk land/development rights Sale of bulk land and development rights
2 Land Sales within our current landbank
while optimizing the portfolio’s capital
structure
Facilities and portfolio management of Management of rental assets such as Two
3 Rentals Rivers Lifestyle Center and the Theme Park
existing assets
3rd Party Shift from focusing exclusively on Third-party development sites for
4 existing land bank to market-led site
Projects affordable housing on a joint venture basis
identification
13Real Estate
Infill Projects: Performance as at 30 September 2019
Vipingo, KE Total
Pearl Marina, UG Two Rivers, KE
1,321 568 1,407 3,296
Total Units
Units Units Units Units
Phase 1 428 484 404 1,316
Units Units Units Units Units
394
325 827
279
201 582
154
Units Pre- 65% 56 32% 98% 63%
Sold
FY19 HY20 of Phase 1 FY19 HY20 of Phase 1 FY19 HY20 of Phase 1 FY19 HY20 of Phase 1
Units Units Units Units
Sales Value KShs. 2.19 billion KShs. 2.20 billion KShs. 1.67 billion KShs. 6.05 billion
of Pre-sold
Units
Underlying
Debt @ Projects fully funded
Nil Nil Nil by internally Nil
Project Level
generated funds
14Real Estate Infill Projects: Sales Progress as at 30 September 2019 15
Real Estate
Land Sales: Progress as at 30 September 2019
 Centum Real Estate has a robust sales pipeline and is actively pursuing sales leads to convert into actual sales

                                                                             Sales Pipeline under
                                         FY19 Closed Sales                  Negotiation as at HY20

                                            KShs. millions                       KShs. millions

                                                412                                 2,798

                                                 30                                 1,556

                                                  -                                 8,890

        Total                                   442                                13,244

16
Real Estate
Rentals: Two Rivers Lifestyle Centre as at 30 September 2019
Mall Occupancy on the Gross Lettable Area
+8% on 47,338 of 149 of 186
59,032 sq. 59,032 sq. units leased
80% metres metres
76%
78% GLA leased
75%
72%
HY18 FY18 HY19 FY19 HY20
Office Towers Occupancy on the Gross
Lettable Area
4,600 of 25,244 45% of South
+12% on
25,244 sq. sq. mtrs Tower
18% metres GLA leased of 10, 249 sq.
11%
14% metres
9%
6%
HY18 FY18 HY19 FY19 HY20
17Real Estate
3rd Party Projects
3rd party projects and residential infill developments are self funding with no capital from CICP. The projects
are funded through a mix of debt, land sales proceeds, 3rd party equity and pre-sales with investment being
carried out at Centum Real Estate level (Centum Development Limited)
Feasibility Business Concept Business Market Validation
Pre-Construction Construction
Case Case & Fund Raising
Stage-Gate Process
• Land and site • Master-planning • Validate phase 1 • Phase 1 project
sourcing • Infrastructure • Engage and sign-off potential off-takers delivery
planning • Phase 1 project designs and costing • Phase 2 concept
• Studies and formulation
statutory approval • Ramp up of phase 1
• Phase concept sales
formulation • Operations set-up
18Real Estate
Debt Exposure at Portfolio Level
The real estate portfolio remains well capitalized with Two Rivers being the only entity/land bank with third-
party interest bearing debt
Entity Shareholding Total Assets Interest Bearing Debt Debt/Total Assets
% KShs. Million KShs. Million %
Two Rivers Development 58% 26,311 9,206 35%
Vipingo Development 100% 16,355 - 0%
Pearl Marina 100% 10,135 - 0%
Uhuru Heights 100% 922 - 0%
Rasimu 100% 604 - 0%
Total Assets 54,327 9,206
KShs. 4.2b of the Two Rivers debt is guaranteed by Centum the rest is non-recourse to Centum
19Private Equity
Managed by
20Private Equity| Centum Value Fund I
Track Record
Fund I performance Examples of Centum Capital’s value add to portfolio companies successfully exited
Gross IRR1 achieved since
26% 2009
• Centum engineered a share swap merger with three Kenyan bottlers
• Economies of scale drove opex & capex synergies
26% 4.2x • Expanded into new territories & diversified into new product lines.
Multiple achieved on
2.4x invested capital
• Centum strengthened core competitive advantage & established new business lines
• Defined their long-term funding strategy
Out of 15 investments 39% 3.5x • Improved organization & governance structures
10 successfully exited
• Launched 3 new product lines that increased revenue by 45%
Trade As the most common exit • Increased Ugandan AUM by KES 7.6bn through 11 new mandates
strategy
sale 24% 2.1x • Improved operational efficiency through roll out of new portfolio management platform
Gross IRR Multiple on cost
1. Fund I performance track record as per RisCura “Centum Investment Company Plc: Performance measurement” (updated to include ABL, NBL & KingBev exits and valuations as at 30th
September 2019). A 25.7% Gross $IRR is equivalent to a Net $IRR of 22.8% on the same terms basis as Fund II.
21Private Equity| Centum Value Fund I
Almasi Case Study: Timeline & Value Creation Levers
2012 2013 2014 2015 2016 2017 2019
• Consolidation of Kisii, Rift • Centum’s shareholding • Investment in a 36,000
Valley and Mount Kenya
increases to 47.4% bph PET Line
Bottlers’ into Almasi with the
following shareholding: • Centum’s shareholding
- Kisii 24.17% increases to 52%
• Exit of Centum’s entire
- Rift Valley 48.53% • Investment in a 36,000
bph RGB Line 54% stake to CCBA
- Mt Kenya 45.09% • Investment in Almasi’s
Distribution network and • EV/EBITDA multiple of
• Centum becomes majority
• EV/EBITDA multiple of 5.9x; Trade 10.5x on exit; EBITDA of
shareholder with 51%
EBITDA of Kshs. 633 million Kshs 1,835 million
• Centum’s shareholding
• Post consolidation shareholding 42.8% increases to 54%
Revenue Enhancement Capital Growth
• Product range diversification through PET investment • Equity Capital raise of USD 16Mn to & Debt Capital raise at
Value Creation
Interventions
affordable rates to fund expansion
Efficiency improvement
Organization Effectiveness
• Revenue synergies through territory coordination
• Recruited a high caliber group management team
• Cost synergies through optimization of franchise with KO
• Strengthened corporate governance
• Management synergies through shared service centre
Risk Reduction
• Capex synergy through rationalized capex spending
• Reduction in both internal and external risks
22Private Equity| Centum Value Fund I
Almasi Case Study: Impact of Value Creation Levers
Almasi EBITDA in KShs. Millions and Value Creation Attribution in KShs. Millions
Adj. EV/EBITDA multiple
2013 - 2018
11,770
864
4,000 12 3,230 +8.4%
9.9
10 +31.5%
3,000 3,211
7.3 8
6.4 6.7
+31.3%
5.9 2,374
2,000 4.9 6 1,238
2,014
1,806 1,845 117 +12.1%
1,560 4 -1.1%
1,499 +18.0%
1,000
896 2
607
Opening Follow-on Change in Revenue Earnings Multiple Dividends Total Value
- 0 Valuation Investment Net Debt Growth growth - Expansion
2013 2014 2015 2016 2017 2018 (2012) Margin
Expansion
Increase in annual Gross revenue EBITDA margins
Impact
EBITDA growth
1.2x physical cases from 5.4% CAGR over 2013 22.8% achieved as at 2018 up 3x in 5 years
12.8 million in 2013 to 2019 from 10.3% in 2012
23Private Equity| Centum Value Fund I
Exit of Almasi Beverages and Nairobi Bottlers Limited
Compared to the historic dividend and dividend …..repayment of the debt represented an
yield between FY15 to FY19… incremental recurrent income KShs. 1,489 million
450.0 5%
407.6
KShs. Million
400.0
4% Bottler Net Proceeds 18,602
350.0
325.3 Invested in Marketable Securities 6,477
302.2 304.1 298.6 3%
300.0
Interest Savings on Debt Paid 990
KShs. Million
250.0 2.4%
2% Projected Interest Income from Marketable
907
1.9% Securities
1.8% 1.8% 1.8%
200.0
Total Savings & Interest Income 1,897
153.8 1%
150.0 0.9%
Peak Dividends 408
100.0 0%
FY15 FY16 FY17 FY18 FY19 Average Net Savings and Interest Income 1,489
Dividends (KES Million) Dividend Yield (%)
24Private Equity| Centum Value Fund I
Exit of King Beverage Limited
100% stake
Total Investment KShs. 602 Million
2014 2019
To validate business assumptions, Centum + The business was unable to scale up
Centum invests into volumes and two options were available
Carlsberg agree to an import model of distribution
King Beverage with to build traction
the objective of 1 Invest in the plant for local production
carrying out local The intention was to achieve trigger volumes by
production mid-2019 and move to a 10-year local production
2 Exit
model
Centum opted to exit the business as the volumes did not warrant further investment and this decision enabled a
partial cost recovery of KShs. 135 million
25Private Equity| Centum Value Fund I
Sidian Bank
Sidian has experienced declined growth in overall income mainly due to interest rate capping, however in a bid
to recover from market shocks, management has been able to reverse the business into profit through growth
of NFI and other interventions
Sidian’s Non-funded Income to Funded Sidian’s Profit (Loss) After Tax KShs. 3.2 billion
Income Post Rate Cap FY 2016 to 30 Sept. 2019 Facilities from FMO and IFU
FY 2016 to 30 Sept. 2019 67
28
KShs. 17.6 billion +5%
596
2016 2017 2018 2019 YTD
Customer Deposits
1,045
KShs million
KShs million
As at 30 September 2019
656
1,085 KShs. 1.1 million +41%
3,096 Non-funded Income
2,014 2,118
1,491
KShs. 67 million 138%
Profit After Tax
2016 2017 2018 2019 YTD (395)
(422)
Interest Income Non-Funded Income
40% +5%
Interest Debt/Total
Liquidity Ratio
KShs. Million Total Assets Bearing Debt Assets
9%
Sidian 24,234 2,227 9%
Debt to Total Assets
26Private Equity| Centum Value Fund I
Longhorn Publishers
Longhorn continues to diversify away from traditional markets as it expands regionally and reduced reliance on
Kenya government orders
Longhorn Publisher’s EBIT and EBIT 9 markets
Margins Geographical operations
FY 2014 - 2018
450 30%
24.5%
25%
350
24% Market Share in KE
20%
19%
KShs million
KShs. 1.6 billion -5%
As at 30 June 2019
250 15%
14% 14%
357
Revenue
10%
150 8% 248
196 5% KShs. 185 million +1%
105 120 Profit
50 0%
2014 2015 2016 2017 2018
EBIT EBIT Margin
KShs. 7.8 +84%
Interest
Share Price
KShs. Million Total Assets Bearing Debt Debt/EBIT
1.9x
Longhorn 2,001 684 1.9x
Debt to EBIT
27Private Equity| Centum Value Fund II
Fund I Track Record
Centum has invested in 15 deals with 10 exits with a focus on high growth consumer facing businesses
Fair value of Dividends since
% of Centum Cost of investment investment inception Gross IRR
Company Industry Investment Date
holding (USD 'M) (KES )
30/09/2019 (USD 'M)
Current Portfolio
Longhorn Publishing Apr – 2009 60.20% 8.3 11.1 2.4 11.4%
Isuzu Automotive Apr – 2009 17.80% 12.2 22.4 10.5 15.3%
Sidian Financial Services Apr – 2009 82.20% 47.9 40.9 0.0 -2.8%
Zohari Financial Services Dec – 2016 100.00% 2.1 2.2 0.0 1.8%
NAS Food & Beverage Apr – 2009 15.00% 1.9 8.4 4.9 89.9%
Achieved a 72.4 85.0 17.8
Gross IRR of
26% over Company Industry
Holding
Period
% of fund's
holding sold
Cost of
investment
Realised
gains/losses
Multiple on
Cost (MOC)
Gross IRR
(KES)
Exit method
2009-2019 (months) (USD 'M)
KWAL Consumer 96 26.40% 3.3 10.5 3.2 20.8% Trade sale
period RVR Transport 14 10.00% 0.8 1.0 1.3 4.4% Secondary
UAP Insurance 69 24.20% 10.9 57.1 5.2 39.9% Trade sale
AON Minet Insurance 85 21.50% 2.1 10.1 4.9 52.4% Trade sale
Almasi Consumer 126 53.94% 27.7 105.1 3.8 25.9% Trade Sale
Exits NBL Consumer 126 27.62% 8.2 8.3 1.0 37.4% Trade Sale
Carbacid Manufacture 23 22.80% 5.3 14.4 2.7 66.9% Secondary
KingBev Consumer 63 100.00% 4.7 1.1 0.2 -14.8% Secondary
GenAfrica Asset Management 53 73.40% 12.5 23.2 1.9 23.7% Trade sale
Platcorp Financial Services 63 36.00% 8.8 26.6 3.0 38.9% MBO
Total realisations 84.2 257.5 3.0
Highlighted above are investments made post-2009
28Private Equity| Centum Value Fund II
Rationale for Fund Structure
Opportunities exist that exceed
Centum's own capital
We have identified opportunities to
invest in that exceed Centum's own
capital
Fund II Consequently, there is need to
With strong leadership, we leverage 3rd party capital
find the best market
Given the current conditions;
leading targets in our
We are seeing opportunities for expertise sectors in East
investment in assets; resulting Arica and target to fully
in realistic entry multiples and optimize the companies
with significant upside potential
to achieve target returns With access to external
capital, we will realize Fund
Risk management
II and deliver sustainable
Through pooled funds, we will be
and high returns
able to significantly lower the risk
exposure
We target market leaders, seeking controlling stakes with an opportunity to create value holistically
29Development
Managed by
30Development
Status Update on Power Assets
37.5% Stake 51% Stake
KShs. 1.86 billion nil
Carrying Value Carrying Value
0% 0%
Total Debt/Asset Ratio Total Debt/Asset Ratio
Milestones to date Milestones to date
✓ Power Purchase Agreement (PPA) ✓ Power Purchase Agreement (PPA)
✓ Government of Kenya Letter of Support ✓ Government of Kenya Letter of Support
✓ Land acquired ✓ Electricity Generation License
✓ Commenced exploratory drilling ✓ Environmental Impact Assessment License
Akiira has undertaken additional surface studies with The EIA License that had been issued to the Amu Power was
initial results being positive. revoked on June 26, 2019. Amu Power has opted to appeal the
The target is to embark on drilling in the next financial decision before the High Court
year In accordance with IFRS 9, a provision is made in the view of
the uncertainties surrounding the timing of closure on these
matters
Anticipate upside on the basis that the case will be dispensed
with positively in favour of Amu Power
31Development
Status Update on Africa Crest Education and Greenblade
17.6% Stake 100% Stake
KShs. 828 million Greenblade KShs. 278 million
Carrying Value Carrying Value
0%
Growers 0%
Total Debt/Asset Ratio Total Debt/Asset Ratio
Enrolment of Students Production in Tonnes
200 300
220
150
200
100 117
156 98
100
50
74 27
54
0 0
2017 2018 2019 2016 2017 2018 2019YTD
Near term priority: Expansion of the portfolio within Focus is to enter new markets with additional products
Africa through investment in greenfield and brownfield such as chervil, dill, coriander to increase production and
locations sales
32Marketable Securities
Managed by
33Marketable Securities
Performance Highlights
Performance Highlights and Cash Generation Performance: April 2015 to Present
KShs. Million Sep-19 Sep-18 200
Opening Portfolio Value 3,159 3,349 180
160
Interest Income 48 65
140
Dividend Income 73 68 120
100
Cash Return: Interest + Dividends 121 133 80
Capital Gains/ (Loss) (139) (395) 60
40
Total Investment Income (17) (263)
20
Portfolio Time Weighted Return (%) -1.20% -8.80%
-
MSCI EFM Africa ex-ZA Index (%) 1.50% -16.80%
Nairobi NSE 20 Share Index (%) -14.60% -25.20%
Marketable Securities Portfolio NSE20 Share Inedx MSCI Africa ex-ZA
Closing Portfolio Value 2,810 3,081
Returns: Performance:
MSP Portfolio has remained resilient in the face of a The portfolio has consistently delivered strong market
bearish market environment. In H1 2019, fixed income beating returns and acted as a provider of liquidity for the
assets contributed positively to portfolio return with Group
downward pressure coming from Kenyan, Botswanan and
West African equities
34Marketable Securities
Asset Allocation
Asset Allocation as at 30 September 2019
Unit Trusts • Going forward, the strategic focus of the portfolio will be
20%
to enhance its ability to generate significant and consistent
cash flow for the Group
- The portfolio has generated KShs. 3.5 billion in
Equities liquidity for the Group since 2014
47%
• To this end, the weight of Fixed Income is set to increase
with Equities diminishing
• The fixed income portfolio will be allocated to issuers with
Fixed Income & high credit quality while the remaining equities portfolio
Deposits
33%
will retain its original diversified, pan-African strategy
35CSR Engagement
Managed by
36Ajiry
Tackling Youth Unemployment
• Ajiry’s mission is to create empowerment and employment, for individuals as well as small businesses/start ups
• Ajiry’s strategy is to utilise two main platforms stated below to tackle this challenge:
1 Ajiry App 2 Ajiry Centres
• Progressive Web Application (PWA) • Tribus-TSG is set to open 10 employment
launched in May 2019 by Tribus – TSG centres across ten counties to support self-
• The platform allows the youth to connect employed persons through training,
and network, free from the controls of financing and access to markets for their
third-party intermediaries products and services
• To date, Ajiry has over 18,580 skills listed, • The Ajiry Centres are anchored on three
advertised 10,000+ job connections with pillars
over 5,000 successful hires - Capacity Enhancement: Additional
skills such as branding, digital
marketing and business skills;
- Financing: Microfinance, monetary
and non-monetary aid;
- Market Access: Link to local and
international markets
37Financial Performance 38
Key Performance Drivers

                  Increase in investment income by 206% to KShs. 12.39 billion
 Realised Gains

 One-off          One-off impairment provisions of KShs. 2.29 billion primarily due to Amu Power KShs. 2.10 billion
 Provisions

39
Consolidated Income Statement KShs. millions HY 20 HY 19 %Δ Sales 4,775 4,818 (1%) Cost of sales (3,158) (3,114) 1% Gross profit 1,617 1,704 (5%) Operating and administrative expenses (1,363) (1,314) 4% Trading profit 254 390 (35%) Financial services: - Income from provision of financial services 1,904 1,608 18% - Interest expenses (474) (519) (9%) - Net impairment of loans and advances (198) (192) 3% - Operating and administrative expenses (1,224) (988) 24% Operating profit from financial services 8 (92) 109% Investment operations: Investment income 12,391 4,055 206% Realised gains on disposal of investments 12 20 (41%) Project and development management fees 12 39 (70%) Operating and administrative expenses (575) (684) (16%) Impairment of assets (2,287) - (100%) Finance costs (2,037) (1,230) 66% Share of profits of associates and jv after tax (62) (105) (41%) Profit before tax 7,716 2,392 223% Income tax expense (926) (312) 196% Profit for the year 6,791 2,080 226% 40
Consolidated Statement of Financial Position
KShs. millions                                 HY 20       FY 19      %Δ
Property, plant and equipment                   3,868     11,068    -65%
Investment property                            40,031     40,034      0%
Goodwill and intangible assets                  1,238      2,495    -50%
Investment portfolio:
- Associates                                    1,859      2,921    -36%
- Joint ventures                                4,806      7,065    -32%
- Unquoted equity investments                   4,531      4,146      9%
- Quoted investments                            1,035      1,561    -34%
- Government securities and corporate bonds     3,950      3,470     14%
- Assets held for sale
Loans and advances                              14,256     13,189     8%
Inventory                                        1,262      2,147   -41%
Receivables and other assets                     8,394      8,276     1%
Cash and cash equivalent                        18,516      5,393   243%
Total assets                                  103,746    101,764      2%
Borrowings                                      22,236     26,871   -17%
Customer deposits                               17,489     14,817    18%
Payables, accruals and other liabilities         5,381      5,613    -4%
Deferred tax liabilities                         1,799      2,888   -38%
Total liabilities                              46,905     50,188     -7%

Net asset value                                56,841     51,576    10%
41
Financial Performance: Company Total Return Statement
KShs. millions          HY 20    HY 19         %Δ    •   Profitability was driven by:
Dividend income           387      267        45%          -   KShs. 2.64 billion gains from disposal of
Interest income           235      622       (62%)             Almasi and Nairobi Bottlers
Realised gains           2,240   1,245       100%
Other income              161      (0)   (46,919%)         -   KShs. 2.3 billion impairment provision,
Total income            3,022    2,133        42%              primarily on debt investment in Amu
Portfolio costs          (312)   (267)        17%              Power
Finance costs          (1,228)   (874)        40%
Operating profit        1,483     992         49%
Impairment of assets   (2,287)       -     (100%)
Profit before tax       (804)     992      (181%)
Income tax expense       (800)    (62)     (106%)
Profit for the year    (1,604)    930      (273%)
Unrealised gains           58      165       (21%)
Total return           (1,546)   1,095     (154%)

Return on op. NAV       -2.9%    2.4%

42
Company Statement of Financial Position
KShs. millions                       HY 20     FY 19      %Δ    KShs. millions            HY 20    FY19     %Δ
Investment portfolio:
                                                                Borrowings                9,914   16,145   (39%)
- Investment in Subsidiaries        31,374    42,157    (26%)
                                                                Other Liabilities         3,294    2,899    14%
- Debt Investment in Subsidiaries   15,437    15,696     (2%)
                                                                Total Liabilities        13,207   19,044   (31%)
- Investment in Associate                 -    6,916   (100%)

- Investment in Joint Venture             -    2,098   (100%)   Shareholder Funds        50,255   52,600    (4%)
- Unquoted Investments               4,024     3,619      1%
                                                                Equity and Liabilities   63,463   71,644   (11%)
- Quoted Investments                    37        53    (30%)
Total Portfolio                     50,872    70,538   (28%)

Other Assets                           645       853    (24%)

Cash and Equivalents                 11,945      253   4626%
Total Assets                        63,463    71,644   (11%)    NAV Per Share (KShs.)     75.52    79.05    (4%)

        NAV per share dropped by 4% during the period on account of impaired assets and dividend pay-out

43
Company Statement of Financial Position
Company Gearing & Liquidity
The company closed the half year period with a
Company Level Gearing liquidity position of KShs. 13.6 billion
KShs. Million
HY20 FY19
Cash, fixed and call deposits as shown on the
11,945
balance sheet
Corporate Bond II
Marketable securities portfolio 2,810
KShs. 6,378 million KShs. 6,367 million 0.2% Total cash and marketable securities 14,755
Term Loan Less
KShs. 0 KShs. 7,636 million 100% Short term facilities as shown on the balance
3.535
sheet
Total Current liabilities paid in October 2019 1,599
KShs. 6,378 million KShs. 14,003 million 54% Net Cash and Marketable Securities 9,621
Undrawn committed facilities available to
4,000
Company
Total liquidity available to Company 13,621
44Company Statement of Cash Flows KShs. millions HY 20 HY 19 Cash flows from operating activities Net cash generated from operating activities 19,776 2,165 Cash flows from investing activities Purchase of PPE - (13) Investments in subsidiaries (45) (561) Net debt investment in subsidiaries (502) (726) Purchase of shares in unquoted investments (117) - Net cash used in investing activities (663) (1,299) Cash flows from financing activities Net (repayments in) / proceeds from borrowings (6,360) (111) Interest paid on borrowings (1,060) (806) Net cash generated from financing activities (7,420) (917) Net increase in cash and cash equivalents 11,693 (51) At start of period 253 1,078 At end of period 11,945 1,026 45
Outlook
Outlook| FY 19/20
                                                                 Marketable
         Real Estate                 Private Equity                                         Development
                                                                 Securities

•    Leverage new             •   Evaluating new          •   Invest in cash-         •   Unlock value across
     developments that are        opportunities that          generative investment       the development
     market validated             meet the investment         instruments in line         portfolio in line with
•    Continue to focus on         criteria                    with our strategic          the value creation
     sales-led development    •   Pursue first close of       objectives                  plans across the
     model                        the fund                                                underlying assets

•    Close pipeline of land                                                                 -   ACE – drive
     sales                                                                                      enrollment and
                                                                                                expansion into
                                                                                                new regions
                                                                                            -   Akiira – finalize
                                                                                                exploratory
                                                                                                drilling
                                                                                            -   Greenblade
                                                                                                Growers – market
                                                                                                expansion

47
Q&A
Appendices
Private Equity| Centum Value Fund I
Portfolio Carrying Value
KShs. millions                         HY20        FY19 Valuation Method    Multiple

Almasi Beverages Limited                  -     9,851.14 Market multiples   9.60x
Nairobi Bottlers Limited                  -     6,912.21 Market multiples   9.60x
Sidian Bank Limited                 3,470.27    3,314.67 Market multiples   0.85x
Isuzu (E.A.) Limited                2,321.59    2,020.89 Market multiples   7.15x
Nabo Capital Limited                  453.01      522.48 Net asset value    N/a
NAS Servair                           874.56      882.19 Market multiples   5.89x
Longhorn Kenya Limited              1,155.12    1,039.85 Market price       N/a
Centum Business Solutions Limited     965.58      854.99 Net asset value    N/a
ACE Holdings Limited                  827.97      711.33 Cost               N/a
Zohari Leasing Limited                239.53      266.35 Net asset value    N/a
Others (PPE, Receivables)             157.93       61.82                    N/a

Total                               10,348.92   26,437.93
50
Real Estate
Portfolio Carrying Value
KShs. millions                        HY20         FY19

Athena Properties Limited            502.14      351.64

Rasimu Limited                       604.08      604.30

Two Rivers Luxury Apartments               -      37.92

Two Rivers Development Limited     8,706.21     9,897.78

Vipingo Development Limited        14,203.41   13,865.55

Vipingo Estates Limited             1,601.29    1,567.07

Uhuru Heights Limited                776.31      819.41

Centum Development Limited          9,037.76    8,710.18

Centum Development Kenya Limited     140.39

                                   35,571.59   35,853.84
51
Development
Portfolio Carrying Value
KShs. millions HY20 FY19
Amu Power Limited
- 2,097.55
Akiira Geothermal Limited
1,858.98 1,542.12
King Beverage Limited -
533.98
Greenblade Growers Limited
278.37 248.59
Assets Under Development 4.01 298.42
Total 2,141.36 4,720.67
52Marketable Securities
Portfolio Carrying Value
KShs. millions HY20 FY19
Centum Exotics Limited 2,773.21 3,781.64
Centum - QPE 36.90 52.58
Total
2,810.11 3,834.22
53Impact of Investment in Amu Power to NAV
Impact of Amu Power Provision on Total Assets
• Amu Power Company Limited (‘Amu Power’) historically carried
(2.1)
at cost as per International Financial Reporting Standards
Kshs. Billion
71.6
65.5 63.4 • NEMA Tribunal ruling to revoke the ESIA issued to Amu Power with
management tasked to carry out a fresh ESIA study
FY19 HY20 Amu Power HY20
Unadjusted Provision • This decision has reduced the activities on the project site and
towards closure of milestones
• Amu Power has appealed the decision to invalidate the ESIA
Impact of Amu Power Provision on NAV
license
• Prudent to make 100% provision for the investment made to date
(2.1)
• Anticipate upside on the basis that the case will be dispensed
Kshs. Billion
with positively in favour of Amu Power
52.6 52.3
50.2
FY19 HY20 Amu Power HY20
Unadjusted Provision
54Centum Investment Company Plc
9th Floor South Tower, Two Rivers
P.O. Box 10518 – 00100
Nairobi Kenya
Tel: (+254) 20 228 6000 / (+254) 709 902000
Email: investorelations@centum.co.keYou can also read