APPLICATION OF FACEBOOK'S PROPHET ALGORITHM FOR SUCCESSFUL SALES FORECASTING BASED ON REAL-WORLD DATA - arXiv
←
→
Page content transcription
If your browser does not render page correctly, please read the page content below
International Journal of Computer Science & Information Technology (IJCSIT) Vol 12, No 2, April 2020

         APPLICATION OF FACEBOOK'S PROPHET
          ALGORITHM FOR SUCCESSFUL SALES
       FORECASTING BASED ON REAL-WORLD DATA
        Emir Žunić1,2, Kemal Korjenić1, Kerim Hodžić2,1 and Dženana Đonko2
                     1
                     Info Studio d.o.o. Sarajevo, Bosnia and Herzegovina
  2
      Faculty of Electrical Engineering, University of Sarajevo, Bosnia and Herzegovina

ABSTRACT
This paper presents a framework capable of accurately forecasting future sales in the retail industry and
classifying the product portfolio according to the expected level of forecasting reliability. The proposed
framework, that would be of great use for any company operating in the retail industry, is based on
Facebook's Prophet algorithm and backtesting strategy. Real-world sales forecasting benchmark data
obtained experimentally in a production environment in one of the biggest retail companies in Bosnia and
Herzegovina is used to evaluate the framework and demonstrate its capabilities in a real-world use case
scenario.

KEYWORDS
Sales forecasting, Real-world dataset, Prophet, Backtesting, Classification

1. INTRODUCTION
Generating product-level sales forecasts is a crucial factor in the retail industry since inventory
control and production planning plays an important role in the competitiveness of any company
that provides goods for its customers. While accurate and reliable forecasts can lead to huge
savings and cost reductions by facilitating better production and inventory planning,
competitive pricing and timely promotion planning, poor sales estimations are proven to be
costly in this domain since it is well-known that goods shortages cause lower profits and can
easily lead to customer dissatisfaction. Furthermore, not only the excess inventory may force the
store to sell goods at lower prices, or even worse lead to inventory write-offs, higher than
needed inventory levels also increase warehousing costs.

In the real-world scenario, the business environment in the retail industry is highly dynamic and
often volatile, which is predominantly caused by holiday effects and competitor behaviour. As a
result, contrary to the widely available academic datasets used to demonstrate and benchmark
various time-series forecasting methods, real-world sales data in this domain carry various
challenges, such as highly non-stationary historical data, irregular sales patterns, and highly
intermittent sales data.

A module that would be able to forecast sales with a reasonably high accuracy, augmented by
the module for highly-reliable classification of the product portfolio according to the expected
level of forecastability, would be of great use for any company operating in the retail industry.

To bridge the gap towards the application of time-series forecasting in the real-world scenario in
the retail industry, the focus of this work is set on the development of the module for reliable
DOI: 10.5121/ijcsit.2020.12203                                                                        23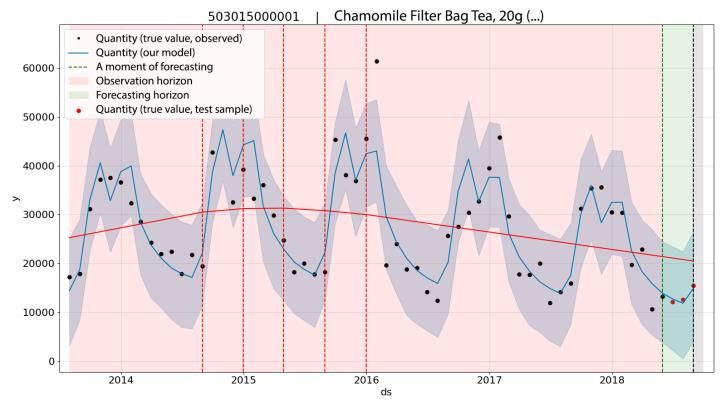
International Journal of Computer Science & Information Technology (IJCSIT) Vol 12, No 2, April 2020
classification of the product portfolio according to the expected level of forecasting reliability.
The results are presented on the example of dataset experimentally obtained in a production
environment in one of the biggest retail companies in Bosnia and Herzegovina. Although
generating sales forecasts anywhere between the daily and annual horizon is certainly possible,
a particular focus has been put on monthly and quarterly sales forecasts since it was concluded
from discussions with clients that the aforementioned period is of the greatest interest for
production and inventory planning.
The structure of this paper is as follows: section Literature review offers a general description of
previous studies relating to the use of the different approaches and algorithms in related retail
sales forecasting problems, and methods for solving. Section Methodology gives an overview of
the framework by briefly explaining a structure of input dataset, data filtering and preprocessing
steps, the process of product portfolio selection, the Prophet tool, performance metrics and
forecastability analysis using backtesting experiments, and guidelines for classifying the product
portfolio, whereas section Results shows the capabilities of the proposed forecasting framework
in a real-world use case scenario. The conclusions drawn from the results in terms of the
proposed objective are given in section Conclusions, with a brief description of directions for
future work, further development and application of the proposed framework.
2. LITERATURE REVIEW
To estimate future sales, the process of sales forecasting is used. Those accurate processes help
companies to predict all kinds of performances and to make important business decisions.
Company forecasts can be based on trends in economy, past sales data and comparisons in
industry. Already established companies can easily predict future sales, which are based on past
business data. New companies must create their forecasts on information, not being verified
enough, such as competitive intelligence and market research. Sales forecasting enables
approach into company’s workforce, resources and cash flow. Predictive sales data is crucial for
business in order to get investment capital.
Retail businesses must use their resources in an efficient way and make strategic decisions to
make their revenues increased and stable, especially when conditions are getting more
competitive. There are three main types of retail sales forecasting:
Time-series sales forecasting,
Sales forecasting based on Artificial Neural Networks,
Using complex hybrid methods.
There are many studies in the literature with different simple and complex methods used for
modelling sales data to forecast future sales.
In the paper by Aras et al. [1] the brilliant literature overview and comparative study on retail sales
forecasting between single and combination methods is given. The obtained results in this paper
suggested that the combination methods achieve better results than the individual ones. Also,
the comparison between these methods and company’s current system was done. Several other
interesting facts are mentioned in this paper in the literature review section, as follows.
Sales data from the period of 10 years (from 1979 to 1989) were analysed by Ansuj et al. [2] in
terms of ARIMA (Autoregressive Integrated Moving Averages) model with interventions and
the ANN (Artificial Neural Network) model. Forecasts of the ANN model were more
appropriate than the ARIMA ones. Comparative studies were made of traditional methods and
ARIMA models with ANN models by Alon et al. [3], as well as a multivariate regression for
aggregate retail sales in economic conditions that are stable and winter’s exponential smoothing.
24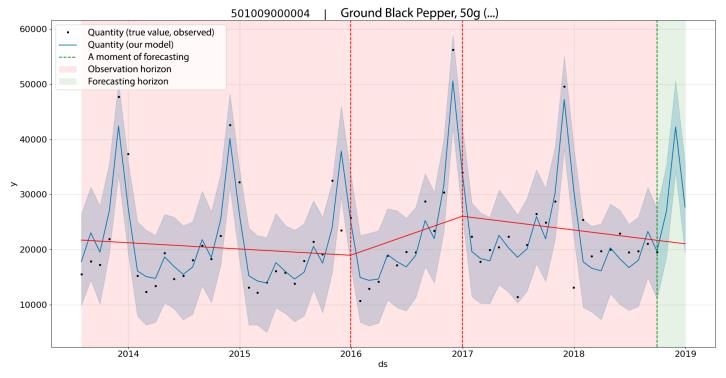
International Journal of Computer Science & Information Technology (IJCSIT) Vol 12, No 2, April 2020
Results showed that the ANN models were the best. Frank et al. [4] created the women’s
apparel sales using the ANN model (which results were the best in terms of R2 evaluation
statistics), Winter’s three parameter model and a single seasonal exponential smoothing. In
sales forecasting, ANN models were the best of all. Aburto and Weber [5] created a
replenishment system for a Chilean supermarket by using a hybrid methodology of two stages,
whose forecasts were better in comparison to ANN and ARIMA models. There were not many
sales failures in hybrid methodology, and there were lower inventory levels.
Au et al. [6] compared the performance of evolutionary neural networks for sales forecasting
with the ARIMA seasonal model and totally connected neural network. Evolutionary neural
networks produced more accurate forecasts. For forecasting retail sales, Pan et al. [7] suggested
a hybrid method. That method integrates a neural network (EMD-NN) with an empirical mode
decomposition to forecast retail sales. The conclusion was that the seasonal ARIMA model and
the classical ANN model were less superior compared to the EMD-NN one. Performance with
hybrid method is better in volatile economic conditions. In comparison made by Dwivedi et al.
[8], the ANFIS (Adaptive Network-based Fuzzy Inference System) method was the most
appropriate of all the other methods being compared, including ANN and linear regression and a
neuro-fuzzy modelling approach. Aye et al. [9] made a performance out of 26 models (ANN,
ARIMA, AFRIMA, etc.) in forecasting South Africa’s aggregate seasonal retail sales. Results
showed that nonlinear ANN model was outperformed by other models also being nonlinear.
In comparison of Ramos et al. [10], the results did not show any difference between the state
space models and ARIMA model with automatic algorithms in forecasting sales of women’s
footwear products. Fabianová et al. [11] made an analysis of refrigerator sales from a retail
store. Results were better in achieving the total revenue by Monte Carlo simulation and using
sensitivity analysis for variables identification. Kolassa [12] observed forecast accuracy
measures not being appropriate for count data. He took into consideration discrete predictive
distributions for forecasting daily sales. Ma et al. [13] presented the results of examination of
the case of Stock Keeping Unit (SKU) level retails store sales by using a four step
methodological framework. This research showed that improvements were achieved by
exploiting the intra red category information, not the inner one. Sales forecasting detailed
review was provided in this way. Jiménez et al. [14] wanted to have forecasts for online sales
being more accurate and also the relevant features of the solid products affecting the sales, so he
proposed a selection methodology of a novel feature.
Retail product sales data are contained of multiple seasonal cycles of different lengths. For
example, beer daily sales data shown in one experiment exhibit both weekly and annual cycles.
Sales are high during the weekends and low during the weekdays, high in summer and low in
winter, and high around Christmas. Some sales data depend on the nature of the business and
business locations. So, models used in forecasting must control multiple seasonal patterns.
Ramos and Fildes [15] use models with additional flexibility but parsimonious complexity to
capture the seasonality of weekly retail data: trigonometric functions prove sufficient.
Papacharalampous and Tyralis [16] consider the performance of random forests and Facebook’s
Prophet in forecasting daily streamflow up to seven days ahead in a river in the US. Both these
forecasting methods use past streamflow observations, while random forests additionally use
past precipitation information. They use a naïve method based on the previous streamflow
observation, as well as a multiple linear regression model utilizing the same information as
random forests. The obtained results suggest that random forests perform better in general
terms, while Prophet outperforms the naïve method for forecast horizons longer than three days.
Based on the knowledge about the sales forecasting, it is worth mentioning that we are currently
working on integrating this framework into our previously developed products for the retail
industry as a big Smart supply chain management (SCM) concept (Zunic et al. [17, 18, 19]).
Also, the proposed forecasting method together with the global positioning system (GPS) data
25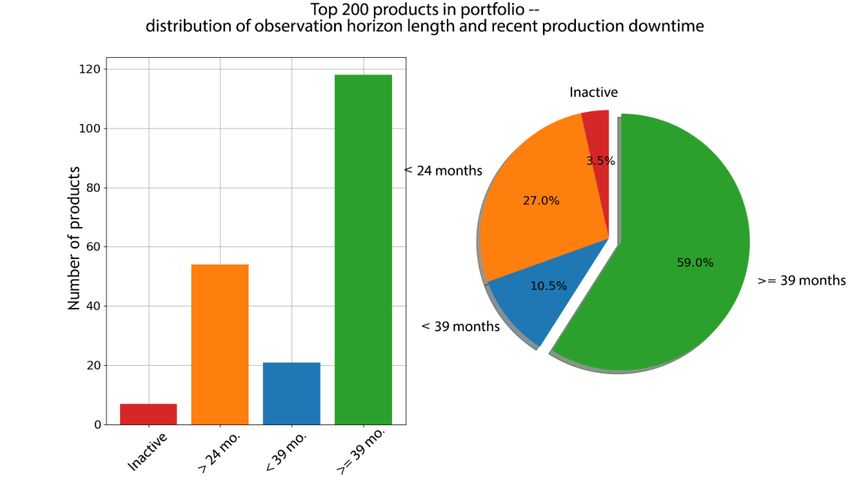
International Journal of Computer Science & Information Technology (IJCSIT) Vol 12, No 2, April 2020

could be successfully used to determine some parameters and constants of the real-world
vehicle routing problems (VRP), such as unloading time, road and time distances between
customers and so on (Zunic et al. [20, 21, 22]).

3. METHODOLOGY
A module that would be able to forecast sales with a reasonably high accuracy, augmented by
the module for highly-reliable classification of the product portfolio according to the expected
level of forecastability, would be of great use for any company operating in the retail industry.
The proposed model for successful sales forecasting based on real-world data is shown in
Figure 1.

                              Figure 1. Proposed sales forecasting model.

The upper part (1) in the illustrated model can be represented as the "offline" segment in the
whole approach, for purposes of model accuracy and classification. The second part (2)
represents the sub-process of successful sales forecasting.

3.1. Input Dataset

To develop a framework for sales forecasting, the following columns were assumed to be
available in the real-world input dataset which is structured as a table of records:

    1)   item_code - unique identifier of the product in a portfolio
    2)   date - date of transaction
    3)   quantity - the quantity sold in a given transaction
    4)   unit_price - the unit price at which the product was sold (optional, not used in
         forecasting)

A sample of input dataset is shown in Table 1.

                                 Table 1. A sample of the input dataset

                         item_code             date         quantity        unit_price
                 0     501001000001         2010-01-02        399            1.3300
                 1     501001000001         2010-01-04        812            1.3380
                 2     501001000001         2010-01-05        516            1.3310

3.2. Data Filtering and Preprocessing

Several steps were taken during the preprocessing phase to transform a table of records into a
convenient form:
                                                                                                         26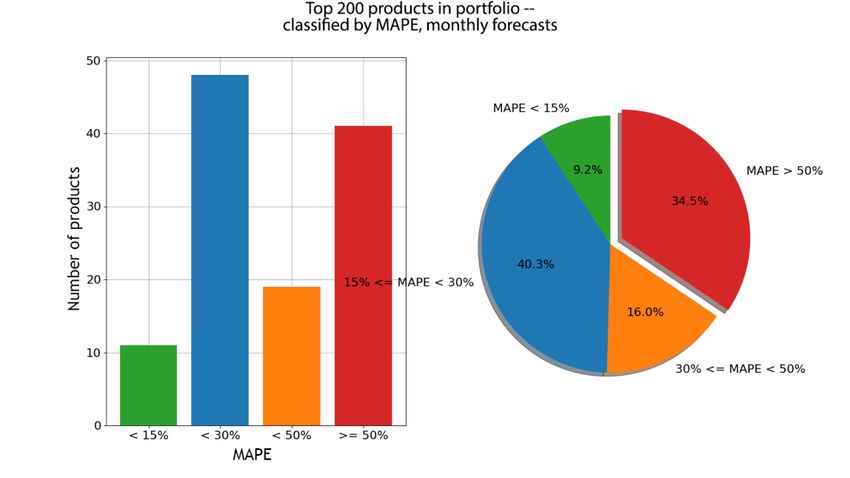
International Journal of Computer Science & Information Technology (IJCSIT) Vol 12, No 2, April 2020
filtering by date, in order to remove irrelevant historical data (e.g. it was decided not to
use more than six years of historical data)
conversion of quantities into the same unit (e.g. pieces, packs, bundles, pallets, etc.)
data aggregation in time domain at the product level (i.e. daily sales data were
converted into monthly sales)
This process is illustrated in Figure 2.
Figure 2. The illustration of data filtering and preprocessing step for a single item in
the product portfolio
3.3. Product Portfolio Selection
To simplify the analysis by limiting it to a reasonable number of products from the portfolio, but
at the same time properly deal with a long tail phenomenon present in sales data of any
company in the retail industry, the products are first sorted by their importance.
Based on industry experience and discussion with clients in real field, it was concluded that
several different criteria can be used to sort the product portfolio by relevance:
1) the total profit per product over the last year (if the profit per sale is available, which is
a rarity),
2) the total financial turnover (i.e. net sales) per product over the last year (if the unit price
per sale is available, which is often a case),
3) the total quantity sold per item over the last year (if none of the aforementioned data is
available).
One can conclude that the second criterion is a quite good approximation of the first one since
the percentage profit per product is usually comparable across the product portfolio. On the
other side, the third criterion is a fairly loose approximation since the unit price per item may
vary significantly, but it is the best that can be done if the price data is not available.
Afterwards, to perform forecastability analysis and product portfolio classification, as well as to
present capabilities of sales forecasting framework and initial results to the client, the focus is
27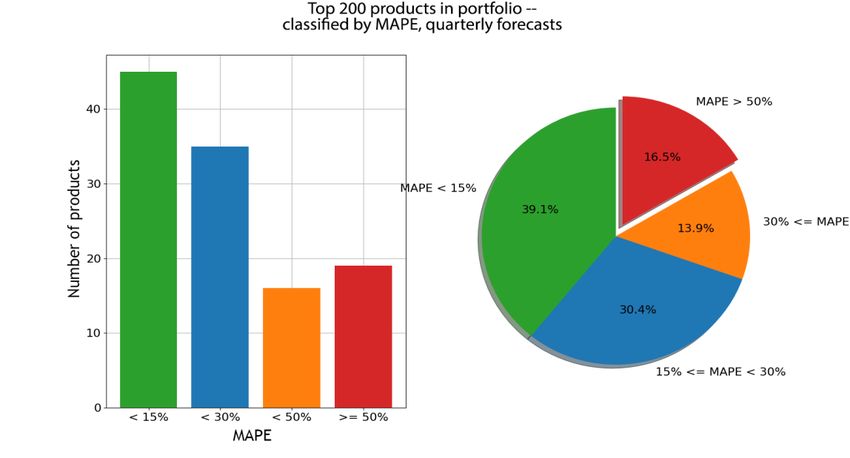
International Journal of Computer Science & Information Technology (IJCSIT) Vol 12, No 2, April 2020
set on the Top N products that cover 90% of the total profit/turnover/quantity over the last year.
In a practical application of sales forecasting framework, after obtaining initial results in this
way, one can easily re-run the experiment for the entire product portfolio and deploy the model.
In the next step, products that are not suitable for product portfolio classification framework are
filtered out according to the following requirements:
minimum length of observation horizon: 39 months (at least 24 months of historical
data is required for reliable estimation of trend and/or seasonal effects, additional 12
months of data for repeated backtesting experiments and three months of data to
measure the accuracy of quarterly forecasts),
maximum allowed production/sales downtime: 3 months (the product is considered to
be inactive if zero sales are recorded for more than 3 months of the most recent history).
Since there is usually a non-negliable number of products with a historical data available for
more than 24 months but less than 39 months (i.e. products for which forecasts can be
generated, but backtesting cannot be done as described in the following subsection since there is
no enough historical data available), it is desirable to explain to clients that forecasting is still
possible but reliable estimation of forecasting accuracy cannot be calculated for these products.
In that case, it is suggested to use sales forecasting results in a semi-automated manner, (i.e.
with a human-in-the-loop).
3.4. Prophet - a Tool for Time Series Forecasting at Scale
The basic building block of the proposed framework for sales forecasting and product portfolio
classification is a tool/method for generating high-quality time-series forecasts. Despite the fact
that there are numerous tools/methods that can be applied, it was decided to use Facebook’s
Prophet tool for this research since it is capable of generating forecasts of a reasonable quality at
scale.
Prophet, an open-source software released by Facebook’s Core Data Science team, is a
procedure developed for forecasting time series data based on an additive model where non-
linear trends are fit with yearly, weekly, and daily seasonality, plus holiday effects. It works best
with time series that have strong seasonal effects and several seasons of historical data. Prophet
is robust to missing data and shifts in the trend, and typically handles outliers well. According to
Taylor and Letham [23] research, Prophet is used in many applications across Facebook for
producing reliable forecasts and performs better than any other approach in the majority of
cases.
In this paper, Facebook’s Prophet tool is used for modelling the dynamics of sales for items in a
product portfolio without using additional regressors, with the aim of generating monthly and
quarterly sales forecasts. It is worth mentioning that an empirical method for tweaking model
parameters is used to incorporate domain knowledge into the proposed framework, but the same
parameters are used for the entire product portfolio to avoid overfitting. It is empirically
concluded that at least 24 months of historical data is required for reliable estimation of trend
and/or seasonal effects. An example of using Facebook’s Prophet tool to forecast the future
sales for the product with sales per month time series is shown in Figure 2 for the next three
months is illustrated in Figure 3.
28International Journal of Computer Science & Information Technology (IJCSIT) Vol 12, No 2, April 2020
Figure 3. The illustration of using Prophet tool to forecast sales of the product with sales per month
time series illustrated in Figure 2
3.5. Performance Metrics
Two performance metrics are used for measuring forecasting accuracy, calculating the expected
level of forecasting accuracy and classifying product portfolio accordingly:
the relative or percentage error (PE) for individual monthly/quarterly forecasts, and
the mean absolute percentage error (MAPE) for quantifying the overall accuracy.
The percentage error (PE), which can be calculated as:
y forecast ytrue
PE 100% (1)
ytrue
is mainly used to measure the accuracy of individual monthly/quarterly forecasting outputs
generated by the model, while the mean absolute percentage error (MAPE), calculated as:
1 n y i forecast y i true
MAPE 100% (2)
n i 1 y i true
is used to quantify the overall accuracy of the forecasting framework and calculate the expected
level of reliability useful for classifying the product portfolio.
These metrics are selected for use because of their simplicity, very intuitive interpretation, as
well as the fact they work well if there are no extremes in the data. Based on the interaction with
clients, it is concluded that a clear and intuitive interpretation of forecasting accuracy metrics in
terms of relative error plays a crucial role in the acceptance of the sales forecasting framework
as a decision-making tool in the retail industry.
29International Journal of Computer Science & Information Technology (IJCSIT) Vol 12, No 2, April 2020
3.6. Forecastability Analysis using Backtesting Experiments
To calculate a reliable estimation of the expected level of forecasting accuracy in terms of
percentage error, an expanding window backtesting strategy is implemented. Past conditions are
simulated by setting the present moment anywhere in the past, building a model using historical
data to forecast future sales and see how accurately it would have predicted actual data.
One can assume that, with enough repetitions of simulating past conditions, a highly-reliable
estimation of the expected level of forecastability can be calculated without having to wait for a
new event to happen in order to compare it with previously generated forecasts and draw
conclusions. To take into account yearly seasonality effects, it is recommended to carry out at
least 12 repetitions of backtesting experiment with one month step size should be done, which is
the reason why the limit for the minimum length of observation horizon is set to 39 months (i.e.
at least 24 months of historical data is required for reliable estimation of trend and/or seasonal
effects, 12 months for repeated backtesting experiments and three months of data to measure
accuracy of quarterly forecasts).
In this research, the backtesting experiment is repeated 12 times with one-month step size for
items selected from the product portfolio. At each step, a Prophet model is fitted to the data
from the historical data (i.e. observation horizon) and monthly sales forecast for the next three
months (i.e. forecasting horizon) are compared with the observed sales for the same period in
order to calculate percentage error (PE) for monthly and quarterly forecasts. Then, the expected
level of forecastability is calculated as the mean absolute percentage error (MAPE) over
repeated backtesting experiments, which is used to quantify the expected level of forecasting
reliability.
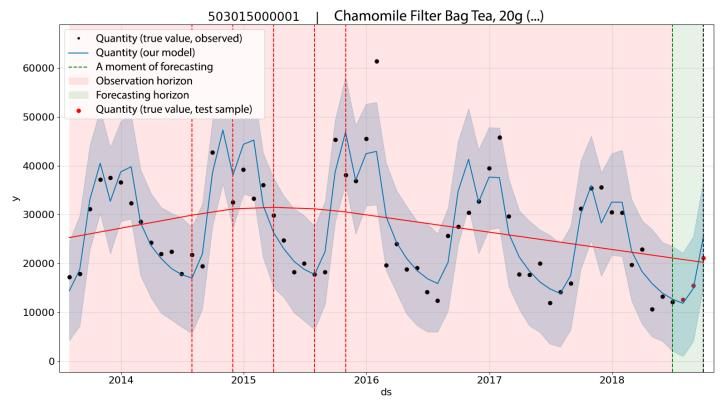
An example of performing forecastability analysis for a single item in the product portfolio is
illustrated in Figures 4 and 5.
Figure 4. Step 1/12 of backtesting experiment illustrated on an item in a product portfolio
30International Journal of Computer Science & Information Technology (IJCSIT) Vol 12, No 2, April 2020
Figure 5. Step 2/12 of backtesting experiment illustrated on an item in a product portfolio
For the analysed item (Chamomile Filter Tea, 200g) the monthly mean absolute percentage
error (MAPE) is:
1 n y i forecast y i true
MAPE
n i 1 y i true
100% = 8.00% (3)
The quarterly forecast MAPE for the same item is:
1 n y i forecast y i true
MAPE
n i 1 y i true
100% = 6.06% (4)
The obtained results for all the analysed items (real-world usa case scenario) are presented in
the next section.
4. RESULTS
The proposed sales forecasting and product portfolio classification framework is evaluated in a
real-world use case scenario with Real-world sales forecasting benchmark data published by
Žunić [24], which is obtained experimentally in a production environment in one of the biggest
retail companies in Bosnia and Herzegovina. Dataset is placed on 4TU.ResearchData in order to
be available to the rest of the researchers, as a new benchmark data.
In this dataset, a total number of 581 items in product portfolio are observed, while 400 of these
were active (i.e. non-zero sales are observed at least once) over the past year.
According to the guidelines proposed in the previous section, items in a product portfolio are
ordered by the total financial turnover (i.e. net sales) per product over the last year and Top 200
items are selected with the aim of covering approximately 90% of total financial turnover.
31International Journal of Computer Science & Information Technology (IJCSIT) Vol 12, No 2, April 2020
4.1. Product Portfolio Classification
The first criterion used to classify the product portfolio is based on the observation horizon
length and the recent sales downtime, so the following categories might be identified:
1) Inactive products: a subset of the product portfolio with items that have recent sales
downtime of three or more months
2) Products with observation horizon shorter than 24 months: a subset of the product
portfolio with items that cannot be forecasted nor classified according to the expected
level of forecastability
3) Products with observation horizon shorter than 39 months: a subset of the product
portfolio with items that can be forecasted but cannot be classified according to the
expected level of forecastability
4) Products with observation horizon at least 39 months long: a subset of the product
portfolio with items that can be both forecasted classified according to the expected
level of forecastability
Classification of Top 200 products in a portfolio by this criterion is illustrated in Figure 6.
Figure 6. Classification of Top 200 products by the criterion based on the observation
horizon length and the recent sales downtime
The second criterion for classifying product portfolio, which can be applied to a subset of
products with observation horizon at least 39 months long, is based on the expected level of
forecasting accuracy calculated as mean absolute percentage error (MAPE) for repeated
backtesting experiments.
For example, binning products into the following class intervals might be interesting:
1) MAPE ≤ 15%
2) 15% < MAPE ≤ 30%
3) 30% < MAPE ≤ 50%
4) MAPE > 50%
32International Journal of Computer Science & Information Technology (IJCSIT) Vol 12, No 2, April 2020
Classification of 113/200 products with observation horizon at least 39 months long (from the
list of Top 200 products in a portfolio) by this criterion both for monthly and quarterly forecasts
is illustrated in Figures 7 and 8.
Figure 7. Classification of 113/200 products with observation horizon at least 39 months long:
MAPE of monthly forecasts
Figure 8. Classification of 113/200 products with observation horizon at least 39 months long:
MAPE of quarterly forecasts
5. CONCLUSIONS AND FUTURE WORK
By evaluating its performance in a real-world use case scenario, the proposed framework
demonstrated capabilities of generating reasonably accurate monthly and quarterly sales
forecasts, as well as a great potential for classification of the product portfolio into several
33International Journal of Computer Science & Information Technology (IJCSIT) Vol 12, No 2, April 2020
categories according to the expected level of forecasting reliability: approximately 50% of the
product portfolio (with a sufficiently long historical data) can be forecasted with MAPE < 30%
on a monthly basis, while approximately 70% can be forecasted with MAPE < 30% on a
quarterly basis (40% of which with MAPE < 15%).
It is important to mention that these approximately 40% of the product portfolio which can be
forecasted with MAPE < 15% on a quarterly basis are mostly the best selling items of the
aforementioned retail company, with more than 80% of annual share (financial) in the whole
portfolio. Based on those facts, the obtained results are more than satisfactory in real-world
scenario of sales forecasting.
With the aim of expanding a set of products to which the proposed framework can be applied,
future work will also include the development of appropriate sales forecasting method
applicable to products with observation horizon shorted than 24 months. This group of products
represent a non-negligible part of the product portfolio, which is a major limitation of the
proposed framework that will be tacked in the future. Further development of the proposed
framework may include an automated approach for hyper-parameters tuning and optimization,
modelling the impact of price changes, promotional activities and changes in the product
portfolio, integrating multiple forecasting tools besides Prophet (such as X-13ARIMA-SEATS)
and addressing some of its limitations described in this paper.
ACKNOWLEDGEMENTS
The authors want to thank the company “Info Studio d.o.o." from Sarajevo, Bosnia and
Herzegovina, for making this research possible through funding and providing access to
necessary data.
REFERENCES
[1] Aras, S., Deveci Kocakoç, İ. and Polat, C. (2017). Comparative study on retail sales forecasting
between single and combination methods. J. Bus. Econ. Manag.
https://doi.org/10.3846/16111699.2017.1367324
[2] Ansuj, A. P., Camargo, M. E., Radharamanan, R., and Petry, D. G. (1996). Sales forecasting using
time series and neural networks. Computers & Industrial Engineering 31(1): 421–424.
https://doi.org/10.1016/0360-8352(96)00166-0
[3] Alon, I., Qi, M., and Sadowski, R. J. (2001). Forecasting aggregate retail sales: a comparison of
artificial neural networks and traditional methods. Journal of Retailing and Consumer Services
8(3): 147–156. https://doi.org/10.1016/S0969-6989(00)00011-4
[4] Frank, C., Garg, A., Sztandera, L., and Raheja, A. (2003). Forecasting women’s apparel sales
using mathematical modelling. International Journal of Clothing Science and Technology 15(2):
107–125. https://doi.org/10.1108/09556220310470097
[5] Aburto, L., and Weber, R. (2007). Improved supply chain man-agement based on hybrid demand
forecasts. Apl. Soft Computing 7(1): 136–144. https://doi.org/10.1016/j.asoc.2005.06.001
[6] Au, K. F., Choi, T. M., and Yu, Y. (2008). Fashion retail forecasting by evolutionary neural
networks. International Journal of Pro-duction Economics 114(2): 615–630.
https://doi.org/10.1016/j.ijpe.2007.06.013
[7] Pan, Y., Pohlen, T., and Manago, S. (2013). Hybrid neural network model in forecasting aggregate
US retail sales. Advances in Business and Management Forecasting 9: 153–170.
https://doi.org/10.1108/S1477-4070(2013)0000009013
[8] Dwivedi, A., Niranjan, M., and Sahu, K. (2013). A business intelli-gence technique for forecasting
the automobile sales using Adaptive Intelligent Systems (ANFIS and ANN). International Journal
of Computer Applications 74(9): 7–13. https://doi.org/10.5120/12911-9383
[9] Aye, G. C., Balcilar, M., Gupta, R., and Majumdar, A. (2015). Forecasting aggregate retail sales:
the case of South Africa. International Journal of Production Economics 160: 66–79.
https://doi.org/10.1016/j.ijpe.2014.09.033
34International Journal of Computer Science & Information Technology (IJCSIT) Vol 12, No 2, April 2020
[10] Ramos, P., Santos, N., and Rebelo, R. (2015). Performance of state space and ARIMA models for
consumer retail sales forecasting. Robotics and Computer-Integrated Manufacturing 34: 151–163.
https://doi.org/10.1016/j.rcim.2014.12.015
[11] Fabianová, J., Kačmáry, P., Molnár, V., and Michalik, P. (2016). Using a software tool in
forecasting: a case study of sales forecasting taking into account data uncertainty. Open
Engineering 6(1): 270–279. https://doi.org/10.1515/eng-2016-0033
[12] Kolassa, S. (2016). Evaluating predictive count data distributions in retail sales forecasting.
International Journal of Forecasting 32(3): 788–803.
https://doi.org/10.1016/j.ijforecast.2015.12.004
[13] Ma, S., Fildes, R., and Huang, T. (2016). Demand forecasting with high dimensional data: the case
of SKU retail sales forecasting with intra-and inter-category promotional information. European
Journal of Operational Research 249(1): 245–257. https://doi.org/10.1016/j.ejor.2015.08.029
[14] Jiménez, F., Sánchez, G., García, J. M., Sciavicco, G., and Miralles, L. (2017). Multi-objective
evolutionary feature selection for online sales forecasting. Neurocomputing 234: 75–92.
https://doi.org/10.1016/j.neucom.2016.12.045
[15] Ramos, P., and Fildes, R. (2018). An evaluation of retail forecasting methods for promotions. In.
Lancaster: Dept. Management Science.
[16] Papacharalampous, G. A., and Tyralis, H. (2018). Evaluation of random forests and Prophet for
daily streamflow forecasting. Advances in Geoscience 45: 201-208. https://doi:10.5194/adgeo-45-
201-2018
[17] Zunic, E., Hodzic, K., Hasic, H., Skrobo, R., Besirevic, A., and Donko, D., (2017). Application of
advanced analysis and predictive algorithm for warehouse picking zone capacity and content
prediction. in ICAT 2017 - 26th International Conference on Information, Communication and
Automation Technologies, Proceedings. 1-6. https://doi.org/10.1109/ICAT.2017.8171629
[18] Zunic, E., Besirevic, A., Delalic, S., Hodzic, K., and Hasic, H. (2018). A generic approach for
order picking optimization process in different warehouse layouts. in 2018 41st International
Convention on Information and Communication Technology, Electronics and Microelectronics,
MIPRO 2018 - Proceedings. 1000-1005. https://doi.org/10.23919/MIPRO.2018.8400183
[19] Zunic, E., Delalic, S., Hodzic, K., Besirevic, A., and Hindija, H. (2018). Smart Warehouse
Management System Concept with Implementation. in 2018 14th Symposium on Neural Networks
and Applications, NEUREL 2018. 1-5. https://doi.org/10.1109/NEUREL.2018.8587004
[20] Zunic, E., Hindija, H., Besirevic, A., Hodzic, K., and Delalic, S. (2018). Improving Performance
of Vehicle Routing Algorithms using GPS Data. in 2018 14th Symposium on Neural Networks
and Applications, NEUREL 2018. https://doi.org/10.1109/NEUREL.2018.8586982
[21] Zunic, E., and Đonko, D. (2019). Parameter setting problem in the case of practical vehicle routing
problems with realistic constraints. in Proceedings of the 2019 Federated Conference on Computer
Science and Information Systems, FedCSIS 2019. https://doi.org/10.15439/2019F194
[22] Žunić, E., Đonko, D., and Buza, E. (2020). An Adaptive Data-Driven Approach to Solve Real-
World Vehicle Routing Problems in Logistics. Complexity. https://doi.org/10.1155/2020/7386701
[23] Taylor, S. J., and Letham, B. (2018). Forecasting at scale. The American Statistician, 72(1), 37-45.
https://doi.org/10.1080/00031305.2017.1380080
[24] Žunić, E. (2019). Real-world sales forecasting benchmark data. 4TU.Centre for Research Data.
https://doi.org/10.4121/uuid:b9f3df9e-08bc-4331-96da-7cabfa8970c0
AUTHORS
Emir Žunić is a PhD candidate in Electrical Engineering with over 10 years of
experience in the fields of Software Engineering, IT, Data Mining, Business Process
Management, Document Management and Optimizations. He currently works as the
Head of AI/ML Department at Info Studio d.o.o. Sarajevo. Also, he is the Co-
Founder and CIO of edu720 d.o.o. Sarajevo. In the Academic Area, he also has
experience in working as a Teaching Assistant/Industry Expert at the Faculty of
Electrical Engineering, University of Sarajevo. In the past, he also worked as an
Industry Expert at the Sarajevo School of Science and Technology. He has currently
published 44 scientific papers at prestigious conferences and journals. He is an Editorial Board Member
on several scientific conferences and journals.
35International Journal of Computer Science & Information Technology (IJCSIT) Vol 12, No 2, April 2020
Kemal Korjenić is a research engineer and data scientist at Info Studio d.o.o. Sarajevo. He gained his
bachelor and master degree at the Faculty of Electrical Engineering, University of Sarajevo.
Kerim Hodžić is a Teaching Assistant at the Faculty of Electrical Engineering, University of Sarajevo
and a research engineer at Info Studio d.o.o. Sarajevo. He gained his bachelor and master degree at the
Faculty of Electrical Engineering, University of Sarajevo. He is a PhD student at the Faculty of Electrical
Engineering, University of Sarajevo.
Dženana Đonko is a Full Professor at Faculty of Electrical Engineering, University of Sarajevo with
enormous experience in the fields of data mining, machine learning and software engineering. She has
published more than 50 scientific papers at prestigious conferences and journals. She is an Editorial
Board Member on several scientific conferences and journals.
36You can also read