FISH SKIN FRESHNESS LEVEL BY INTEGRATED RGB MULTICOLOUR IMAGE PROCESSING FROM QUALITY INDEX METHOD (QIM) ASSESSMENT
←
→
Page content transcription
If your browser does not render page correctly, please read the page content below
Malaysian Journal of Computing, 6(1): 667-678, 2021
Copyright © UiTM Press
eISSN: 2600-8238 online

      FISH SKIN FRESHNESS LEVEL BY INTEGRATED RGB
      MULTICOLOUR IMAGE PROCESSING FROM QUALITY
             INDEX METHOD (QIM) ASSESSMENT

     Aina Rasyiqah binti Mohd Hanif1, Khairul Naim Abd. Aziz2*, Muhammad Akmal
             Roslani3, Sharir Aizat Kamaruddin4 and Zamzila Erdawati Zainol5
                Faculty of Applied Sciences, Universiti Teknologi MARA, Perlis Branch,
                             Arau Campus, 02600 Arau, Perlis, Malaysia
            1
                ainarasyyy@gmail.com, 2*khairul87@uitm.edu.my, 3akmalroslani@uitm.edu.my,
                             4
                               shariraizat@uitm.edu.my, 5zamzila396@uitm.edu.my

                                                    ABSTRACT

The colour of the fish skin is one of the important factors to determine the freshness of a fish.
There is potential to use the fish images as an alternative to determine the fish freshness.
However, the freshness relationship of the fish skin image to the Red, Green, Blue (RGB)
multiple colour channel needs to be elucidated to achieve an accurate interpretation of fish
freshness. The objective of this study is to determine the freshness of the fish samples using
QIM assessment and to extract the RGB colour value from fish skin images. Finally, to
establish the relationship between the QIM scores ranging from 1 (fresh) to 3 (spoiled) and
RGB value for freshness indicator using fish images. The effects of temperature, environment,
and storage method have been shown to play an important role in determining the rate of
deterioration towards the quality and freshness level in fish. From this study, a freshness
indicator based on Quality Index Method (QIM) and RGB value for Queenfish and Threadfin
was created. Based on the QIM score, Threadfin was easier to deteriorate as compared to
Queenfish from its leaner body type properties. Different fish would reflect different freshness
reading as Threadfin is in a fresh state when it possesses QIM score of 1 with RGB values
range between of 143 to 172. As deterioration progresses, the QIM score is at 3 and the RGB
values are ranging from 132 to 161. While Queenfish is found to be in a fresh state when it
acquires QIM score of 1 and the RGB values are in the range of 148 to 170. It starts to spoil
when the QIM score is at 3 and the RGB values are ranging from 154 to 184.
Keywords: Fish Freshness, Freshness detector, Quality Index Method, RGB colour
processing

Received for review: 20-08-2020; Accepted: 14-10-2020; Published: 29-01-2021

1.      Introduction

Freshness is a basic requirement to measure the quality of fish. The quality of a fish
may be affected by characteristic changes deeply which result in a progressive loss of
in terms of their quality and taste. Moreover, the quality of fish can be described as
the aesthetic appearance and freshness or degree of spoilage of the fish. There are
many factors that influence the shelf life of fish such as handling and storage
conditions (Sornam et al., 2017). Quality of fish changes after catching due to
                                                          667

This open access article is distributed under a Creative Commons Attribution (CC-BY SA) 3.0 license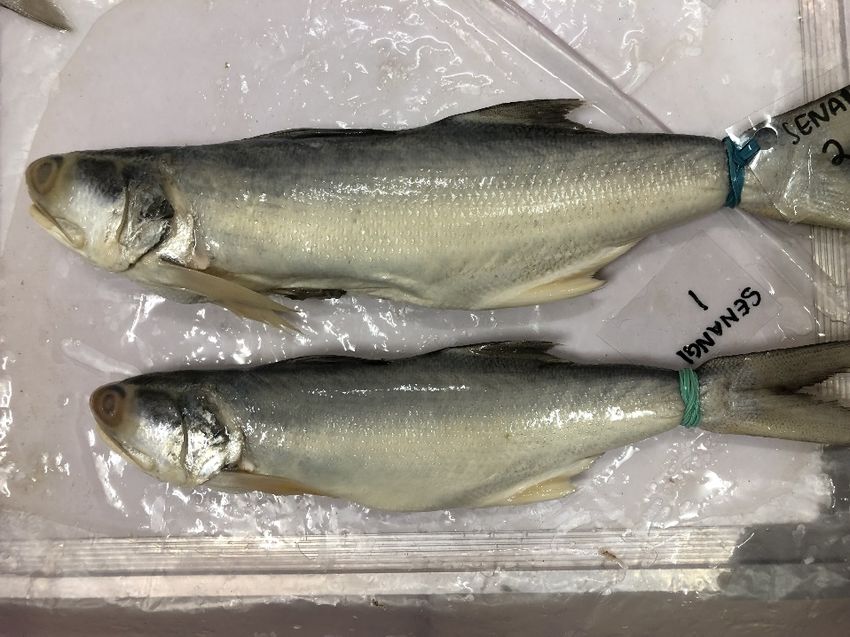
Hanif et. al., Malaysian Journal of Computing, 6(1): 667-678, 2021

chemical reaction and microbial spoilage, where the psychrotolerant gram-negative
bacteria, such as Pseudomonas spp. and Shewanella spp. can cause deterioration to
the fish, even on chilled fish (Ikape, 2017).
        Consumers often describe the characteristics of fresh fish as a pleasant and
neutral smell, shiny and bulging eyes, bright red colour gills, and naturally metallic
glow skin. Microbiological, biochemical, and sensory methods have been used to
assess the fish freshness during handling and storage. In contrast to that, Zaragoza et
al. (2012) state that those methods are expensive, time-consuming, and require skilled
personnel to evaluate the freshness of the fish. Therefore, this study implemented the
image processing technique as an alternative to assess the freshness of the fish as it is
non-destructive and non-hazardous (Sengar et al., 2018).
        Redness (R) by using Red single colour channel also look promising to
differentiate fish freshness but redness could also indicate sign of mishandling and
burst blood vessel which mostly appears on fish eyes (Aziz et al., 2020). Aguil et al.
(2018) reported that consumers will decide whether the fish is fresh or stale by only
looking at the eyes and gills of the fish, which shows the lack of use for fish skin to
body area as an indicator to determine the fish freshness. According to Sengar et al.
(2018), the colour of the fish skin is one of the important factors to determine the
freshness of a fish. Up to today the use of fish images may contribute a big help as the
cheapest fish freshness detector. However, the freshness relationship of the fish skin
image to the Red, Green, Blue (RGB) colour channel needs to be elucidated to
achieve an accurate interpretation of fish freshness.
        The main goal of this study is to produce a sensory fish freshness detector
based on fish skin by using image interpretation based on the Quality Index Method
(QIM) scores. This sensory detector system will enable users to interpret data without
having any contact with the samples. The first objective of this study is to determine
the freshness of the fish samples using QIM assessment. Next, is to extract the RGB
colour value from fish skin images, and finally to investigate the relationship between
the QIM scores and RGB value for freshness indicator by using the Statistical
Package for the Social Sciences (SPSS) software.
        The findings in this study are hoping to make an impact on society by
producing a sensory fish freshness system that can detect the freshness of fish
accurately especially in commercial areas such as market, home, or anywhere. All
consumers should get the advantages to detect the fish freshness without having any
basic skills in the fishery and prevent any health problems from eating stale fish.
Besides, this study promotes a hygienic method of sampling as it only requires fish
images without having any contact with the fish. Therefore, consumers can check the
condition of fish at the market in a short period of time.

2.     Methodology

The study starts with storing all the samples collected in a proper storage method, followed by
QIM assessments to determine fish freshness level and images acquisition for multicolour
RGB extractions. The images were process and latter scrutinized to investigate the
relationship between each and integrated colour RGB channel toward fish freshness level.

                                                      668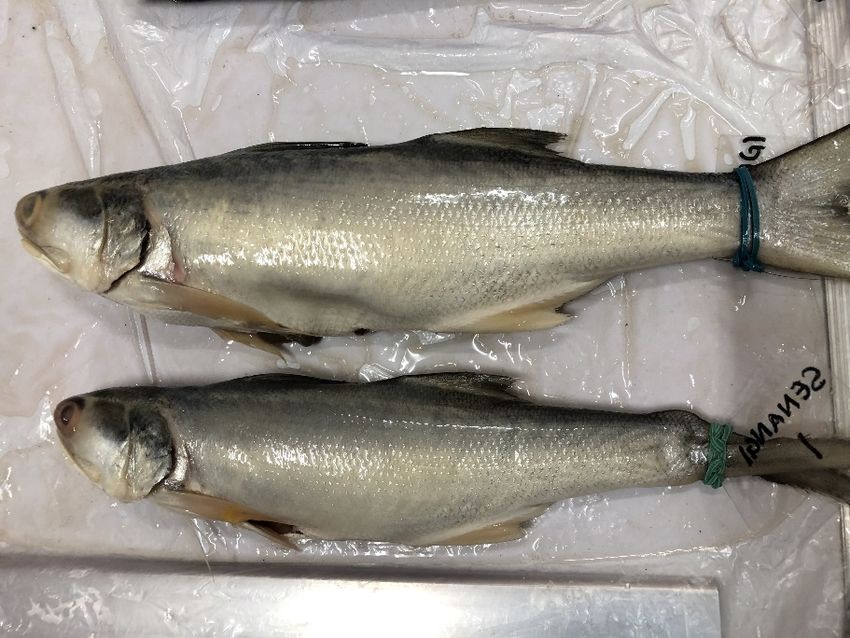
Hanif et. al., Malaysian Journal of Computing, 6(1): 667-678, 2021

2.1    Fish Sampling, Storage and Icing

In this study, there were two types of fish used for sampling which were Scomberoides
commersonnianus (Queenfish) and Eleutheronema tetradactylum (Threadfin). They are a
major commercial species in the coastal regions of Malaysia as they supply globally most to
the catch production (Griffiths et al., 2006; Mahabubul et al., 2012). For each species, ten
samples were collected and labelled with tag from 1 to 10.
         The fish samples were completely surrounded by crushed ice during storage. Crushed
ice is preferred to larger pieces because it cools fish more rapidly. According to Shawyer &
Pizzali (2003), it is preferred to use crushed ice for storage because this allows good contact
with the fish. The fish should not be wrapped in paper or plastic because a layer of air will
trap between the fish and ice as that situation can slow down the cooling process (Clucas &
Johnson, 1990). This storage method requires the fish to be layered with ice in an insulated
icebox is known as Bulking method (Huss, 1995). The method is chosen as it can be
temporarily or permanently mounted on board the boat for transportation to the market.
Firstly, the first layer of ice which was the lowest layer should be 5 cm of thickness. The ice
should be layered between the fish and spread along the sides, top and bottom of the box. The
samples were all covered with crushed ice at an average temperature of 0°C and left for three
days. These steps were repeated on days 3, 6, 9, and 12.

2.2    QIM Assessment

The fish freshness was immediately evaluated by the Quality Index Method (QIM). Based on
Shabani et al. (2019), QIM is a method that allows us to assess the fish freshness rapidly and
accurately. Each assessment was carried out by 10 trained panels among students of Marine
Technology. Fish samples were assessed by the panels for their sensory characteristics such
as colour, appearance, texture, odour, and taste. There are few skin characteristics that
correlate to the score that was used to demonstrate the level of degradation. Referring to Diler
& Genc (2018), they have adapted four evaluations focusing on skin which are appearance,
mucus, odour and texture. However, in this study odour was discounted as it later only
considering the visible effect on fish skin from the images. Due to that the parameters which
were evaluated for the skin are the appearance, texture, and mucous with a score ranging from
1 to 3 (Table 1), where 1 represents fresh, 2 is normal and 3 for spoil. The panels had to fill
the form each day for 14 days continuously.

                     Table 1. Characteristics of Sensory Features in QIM Score Sheet
                                  Feature        Characteristics Score
                                                  Bright, shining     1
                                Appearance        Slightly bright     2
                                                        Dull          3
                                                      In rigor        1
                                  Texture          Firm, elastic      2
                                                        Soft          3
                                                Clear, no clotting    1
                                  Mucous          Milky, clotted      2
                                                 Yellow, clotted      3
                                     Adapted: Diler & Genc (2018)

                                                      669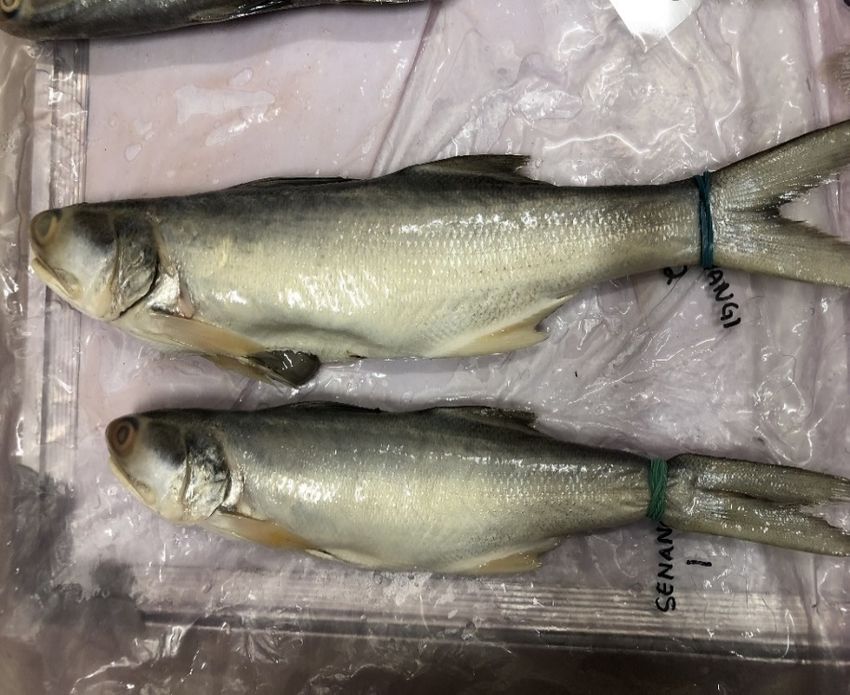
Hanif et. al., Malaysian Journal of Computing, 6(1): 667-678, 2021

2.3    RGB Evaluation and Image Processing

In order to obtain the RGB value, the sample images were captured between 30–40 cm by
using a camera from the iPhone 8 smartphone equipped with a 12-megapixel and resolution
of 750x1334 pixel built-in display in JPEG format. The RGB colour features of fish images
were then extracted by using a processing software called ImageJ. The software can provide a
reading of each R, G, and B colour channel from an image. The image was stored as an 8-bit
integer providing a range of possible values from 0 to 255 via histogram. Usually, 0 is
considered black while 255 is taken white. The raw images were cropped out to region on
interest (ROI) and analysed by using histogram from the ImageJ. The ROI were set for fish
skin, considering for the fish body from the area between fish operculum and pectoral fin up
to the caudal peduncle (Table 2 & 3). In the cropped image, values such as mean, mode,
standard deviation, and count of the RGB value were measured from the histogram.

3.     Results and Discussions

The relationship between sensory feature and day of storage can be achieved through the
average value of QIM scores to determine which fish species spoils faster. The QIM scheme
is comprised of three sensory features that the panels analysed. In Figure 1, the score began to
increase as the day started to increase as well. It was found that the Threadfin was easier to
deteriorate as compared to the Queenfish. This can be seen where Threadfin started to
deteriorate on the third day but Queenfish remained to be in fresh state until the fourth day.
Overall, both graphs showed a clear upward trend in the number of scores obtained by
appearance, texture and mucous. An increase in the number of scores means that each feature
contributes to the process of degradation of the fish. By comparing the two graphs as in
Figure 1, Threadfin tends to run a higher risk of becoming spoiled faster than Queenfish.

      Figure 1. The Comparison between QIM Score against Day of Storage for The Threadfin and
                                        Queenfish Samples

3.1    Appearance

The most important characteristic of a fish is its freshness where it can be seen on the
appearance of fish skin. Fish that is in extremely fresh state will not possess dull appearance.
Lougovois & Kyrana (2005) state that a freshly caught fish has shiny and iridescent skin,
which coated with a thin layer of mucous that is almost transparent and evenly spread.
However, as the days increased, the appearance of the fish skin started to change from bright

                                                      670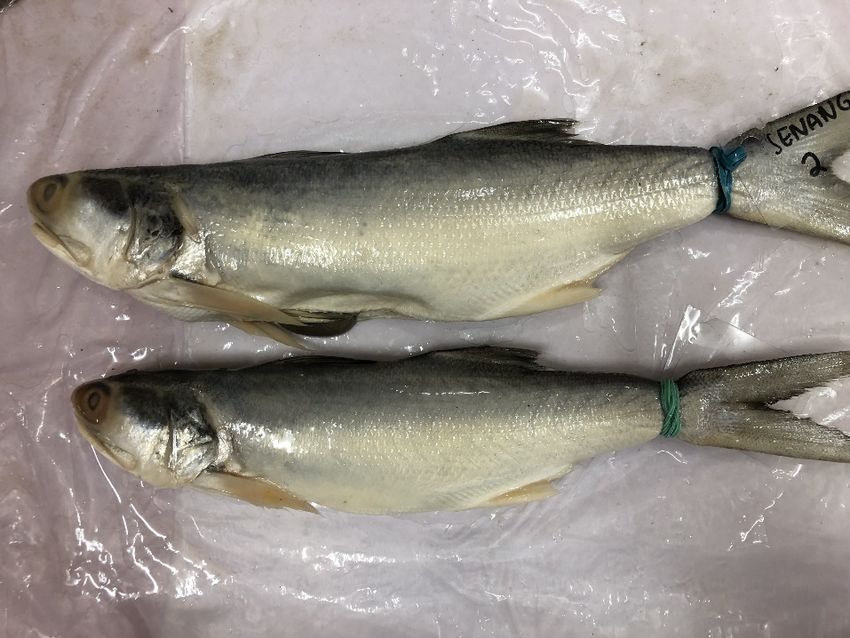
Hanif et. al., Malaysian Journal of Computing, 6(1): 667-678, 2021

and shiny to dull. In this study, Threadfin and Queenfish got the dullest appearance at the end
of the assessment.
          Figure 2 shows the trendline of the appearance for Queenfish and Threadfin.
Trendline graph displays trendline equation and R-squared (R2) value. According to
Cheusheva (2019), trendline equation is a formula that finds a line that best fits the data points
while R2 value measures the trendline reliability that is the closer R2 is to 1, the better the
trendline fits the data. In this study, r value represents the correlation between days of storage
and QIM scores for both species. The r value for Queenfish and Threadfin are 0.966 and
0.965 respectively. This indicates that the correlation between days of ice storage and QIM
score of Queenfish is higher compared to Threadfin and that means the trendline of Queenfish
fits the data better due to the R2 = 0.9325 is close to 1. Furthermore, the factor that contributes
to the changes of appearance of fish skin should be temperature. Temperature influences the
level of fish discoloration by affecting the susceptibility to autooxidation of fish myoglobin
(Ashie et al., 1996).

                   Figure 2. The Trendline of Appearance for Queenfish and Threadfin

3.2      Texture

Texture of the fish plays a major role in determining the level of fish freshness. In this study,
a rigor texture indicates that the fish is in a fresh state. Nonetheless, at the end of assessment,
both species had a soft texture. Based on Figure 3, the correlation between days of storage
and QIM score of Queenfish is r = 0.964 which is higher than Threadfin that only possesses r
= 0.946. As the appearance assessment, the trendline for texture fits the data better is
Queenfish since the R2 value is 0.93 that is nearer to 1. The factor that contributes to an
increased rate of fish muscle softening is that the muscle tissue of fish undergoes faster
spoilage than mammalian muscles (Masniyom, 2011). That is because the muscles of fish
have less connective tissue compared to the mammals (Ashie et al., 1996).
         Besides, the degradation of collagen inside the intramuscular connective tissue leads
to texture changes in the muscle (Masniyom, 2011). Fish has a fast resolution of rigor mortis
compared to terrestrial animals (Lougovois & Kyrana, 2005). Temperature also affects the
deterioration process by slowing down most biochemical activities at low temperatures and
speeding them up at high temperatures. The biochemicals changes were attributed to
denaturation of enzyme or protein at low temperatures (Ashie et al., 1996). It has been shown
that temperature has some effect on breaking the stress and rigor tension of muscle fibres.

                                                      671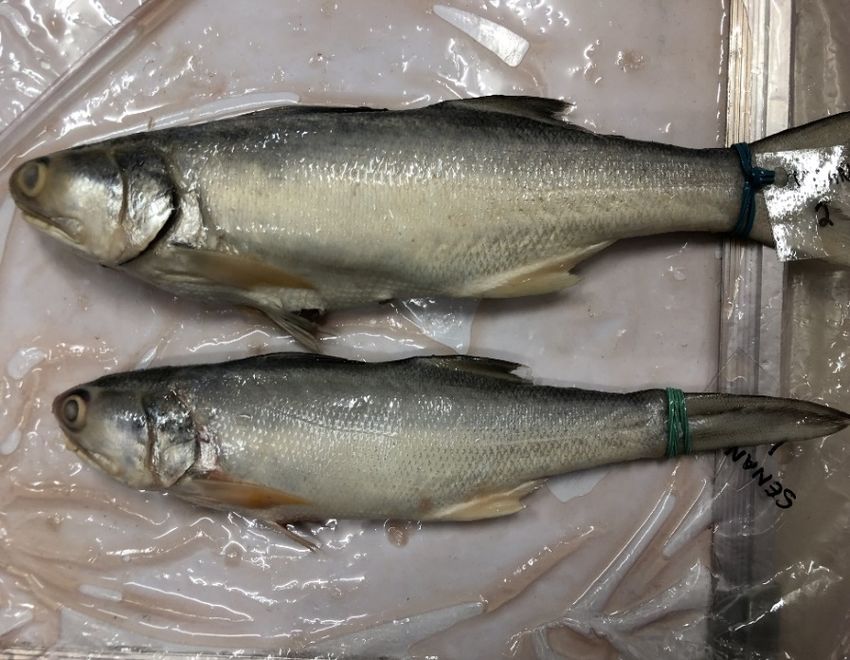
Hanif et. al., Malaysian Journal of Computing, 6(1): 667-678, 2021

This causes muscles to gap and ultimately decreases the rate of depletion of energy reserves at
low temperatures, which will extend the pre-rigor duration. However, as the temperature
rises, an increasing proportion of the muscle fibres gain enough energy to surpass the tissue’s
inherent strength, which thus break, resulting in tension (Ashie et al., 1996).

                     Figure 3. The Trendline of Texture for Queenfish and Threadfin

3.3    Mucous

A clear and no clotting mucous show that the fish is in a good condition. However, as the
days go by, there were changes observed on the fish skin mucous. The mucous was still clear
during the initial day but it was seen to have a major change on day 6. The mucous started
becoming milky and coagulated on the skin. Threadfin experienced an obvious change on the
mucous as it began becoming milky on day 6 and day 7 and turned to yellow on day 14.
Whereas, Queenfish had no change on the mucous.

                     Figure 4. The Trendline of Mucous for Queenfish and Threadfin

        Figure 4 shows the correlation between days of storage and QIM score of Queenfish
and Threadfin samples which are r = 0.035 and r = 0.799 respectively. The correlation of
Threadfin is higher compared to Queenfish. Besides, the R2 value of Threadfin is 0.6388
which is closer to 1 and that leads the trendline to fit the data better. According to Esteban

                                                      672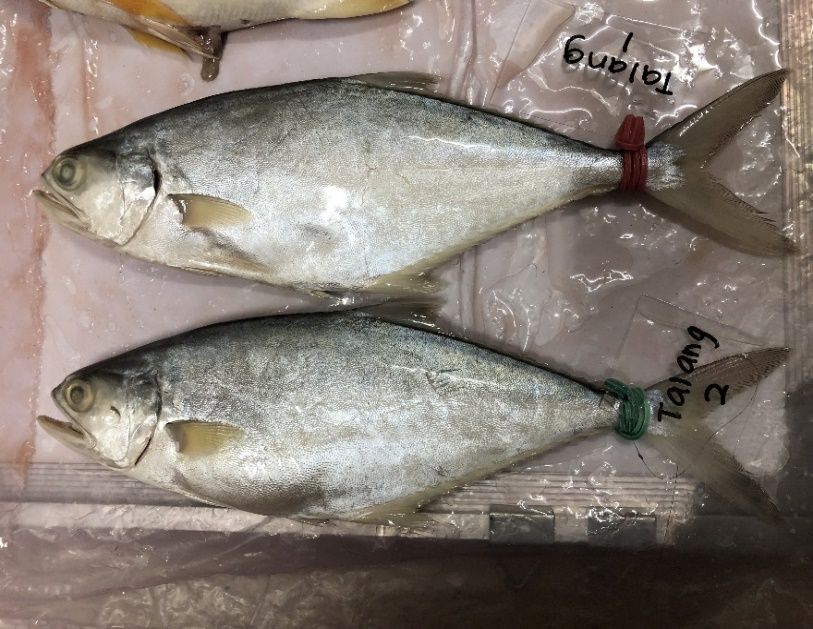
Hanif et. al., Malaysian Journal of Computing, 6(1): 667-678, 2021
(2012), fish skin mucous functions as a natural, physical, biochemical, dynamic, and
semipermeable barrier allowing nutrients, water, gases and hormones exchange. The surface
slime of freshly caught fish may contain substantial bacterial load. Such bacteria start
attacking the flesh causing spoilage when the fish is dead and develop undesirable compound.
In this study, the scales of Threadfin are covered by a mucous coating to protect them from
fungus and external parasites.
3.4 Fish Deterioration
There are several factors that could affect the rate of spoilage in fish for example storage
temperature, physical damage and intrinsic factors. Firstly, Shawyer & Pizzali (2003) state
that physical damage can happen with poor handling of the fish. This is because the fish is
soft and easily damaged, therefore poor handling results in bacterial contamination of fish
meat and allows enzymes to be released, and this will accelerate the rate of spoilage.
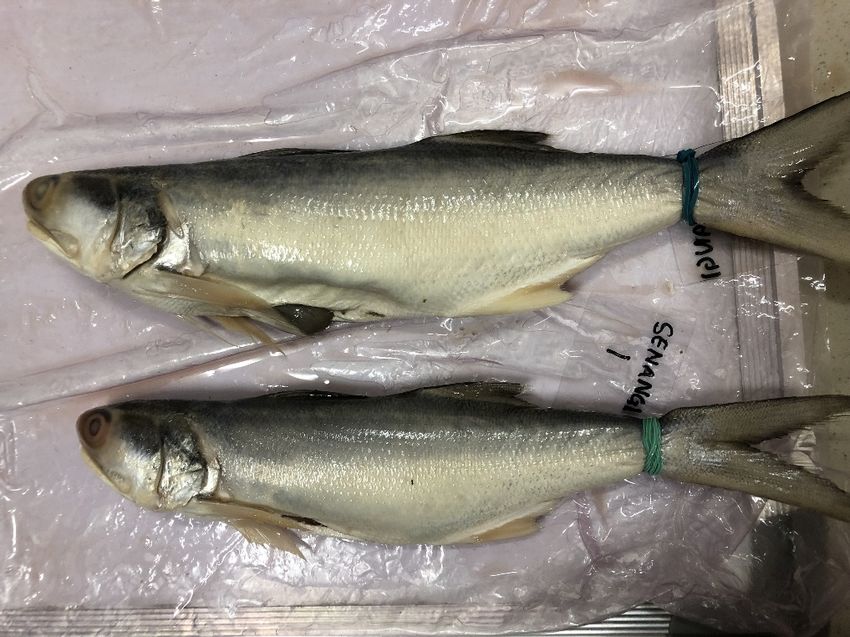
Table 2. The Skin Changes in Queenfish Within 14 Days of Storage
Day Day Day
0 1 2
Day Day Day
3 4 5
Day Day Day
6 7 8
Day Day Day
9 10 11
Day Day Day
12 13 14
673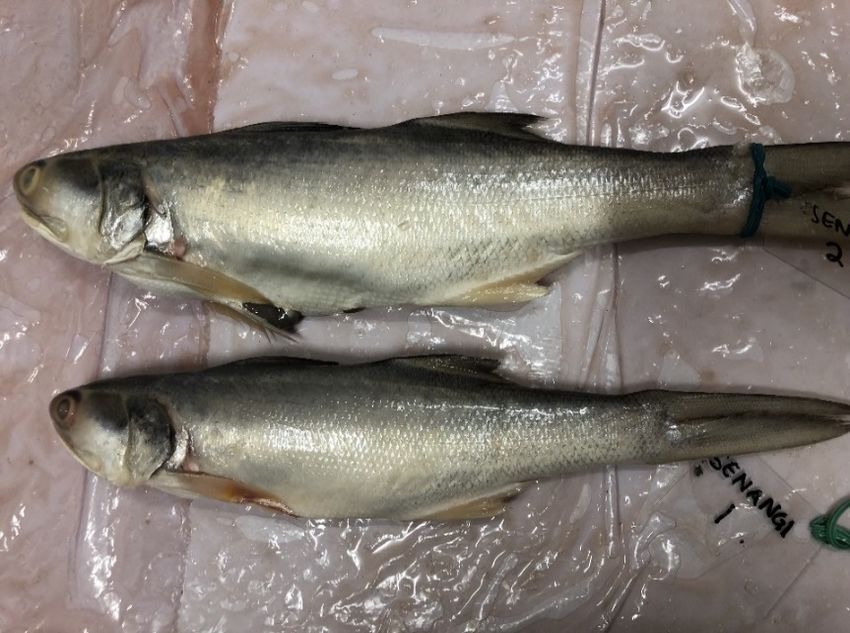
Hanif et. al., Malaysian Journal of Computing, 6(1): 667-678, 2021

         In this study, Threadfin was observed to have more physical damages compared to
Queenfish. Secondly, Threadfin have a higher fat content in the flesh compared to Queenfish
and fatty species like Threadfin degrades faster than Queenfish which is a leaner species
(Shawyer & Pizzali, 2003). Other than that, the thickness of the skin also brings an effect
towards the level of spoilage in fish. According to Shawyer & Pizzali (2003), fish with a thin
skin has a faster rate of spoilage than fish with a thick skin. In this study, Threadfin spoiled
faster than Queenfish due to the thin skin of fatty pelagic fish. Thin skin makes it easier for
enzymes and bacteria to penetrate faster, thus speeding up the spoilage rate of fish (Huss,
1995).

                   Table 3. The Skin Changes in Threadfin Within 14 Days of Storage

Day                                   Day                            Day
 0                                     1                              2

Day                                   Day                            Day
 3                                     4                              5

Day                                   Day                            Day
 6                                     7                              8

Day                                   Day                            Day
 9                                    10                             11

Day                                   Day                            Day
12                                    13                             14

         Next, the entire fish samples were observed to have a soft texture and belly rupture
towards the final day which is day 14. According to Ghaly et al. (2010), autolytic enzymes
reduced the consistency of texture during the early stages of deterioration. Hypoxanthine and
Formaldehyde production results in extensive autolysis leading to meat softening, rupture of
the belly wall and drainage from the blood water containing both protein and oil. Other than
that, Proteolytic enzymes present in fish muscles after catch lead to post-mortem degradation
of the muscle during storage and processing. The process of deterioration causes the fish to
have a pungent and strong fishy odour at the end of assessment. The smell is due to odourless
chemical known as Trimethylamine oxide that contains in the fish tissue. Then, the chemical
is broken down into two new chemicals which are ammonia derivatives by the bacteria in the
fish body that leads the fish to smell bad (Glass, 2003).

3.6    Evaluation of RGB Value

                                                      674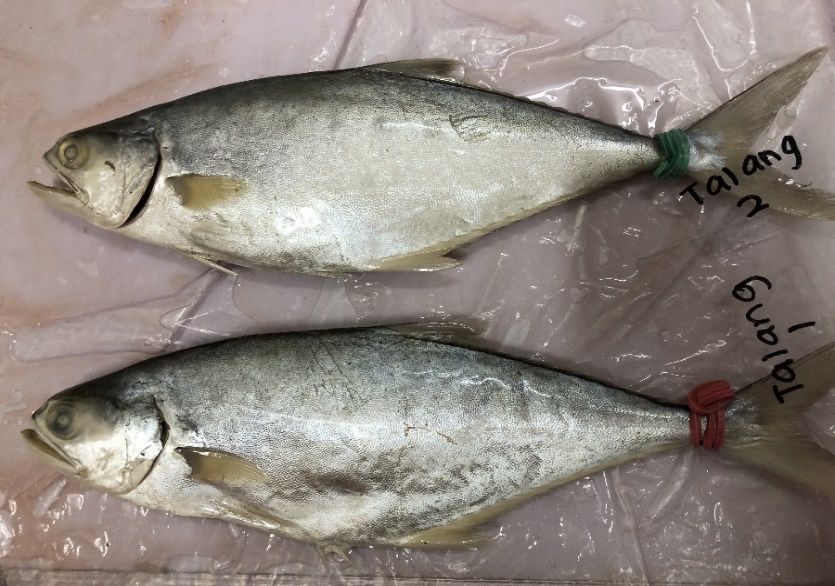
Hanif et. al., Malaysian Journal of Computing, 6(1): 667-678, 2021

RGB refers to red, green and blue colour that can be combined together to produce various
colours. The RGB value of an image ranging from 0 to 255, where 0 is black and 255 is white
or full saturation. The mean for red, green and blue values were calculated and tabulated in a
graph form. Based on Figure 5, the blue value of Queenfish tends to have the lowest mean
compared to red and green values. The mean for blue value is in the range of 148 to 173 from
day 1 until day 14. Meanwhile, the mean for red and green values ranges from 162 to 184 and
from 161 to 185 respectively. Furthermore, the graph shows an upward trend in the mean
value obtained for each day.

                 Figure 5. The Correlation between Mean Value and Day for Queenfish

                  Figure 6. The Correlation between Mean Value and Day for Threadfin

        Next, Figure 6 displays the correlation between the RGB mean values against day for
Threadfin. The graph shows a downward trend in the mean value obtained from day 1 until
day 14. The mean value of blue is the lowest among the three colours. The mean of red and
green tend to have a quite similar value. The mean for blue value is in the range of 132 to 158
while the mean for red and green values ranges from 145 to 172 and 143 to 169 respectively.
In contrast, the mean value of RGB for Queenfish is higher than the mean value of RGB for
Threadfin. This indicates that the skin of Threadfin degrades faster compared to the skin of
Queenfish as referred to the mean of blue value for Threadfin which is ranging from 132 to
158.

                                                      675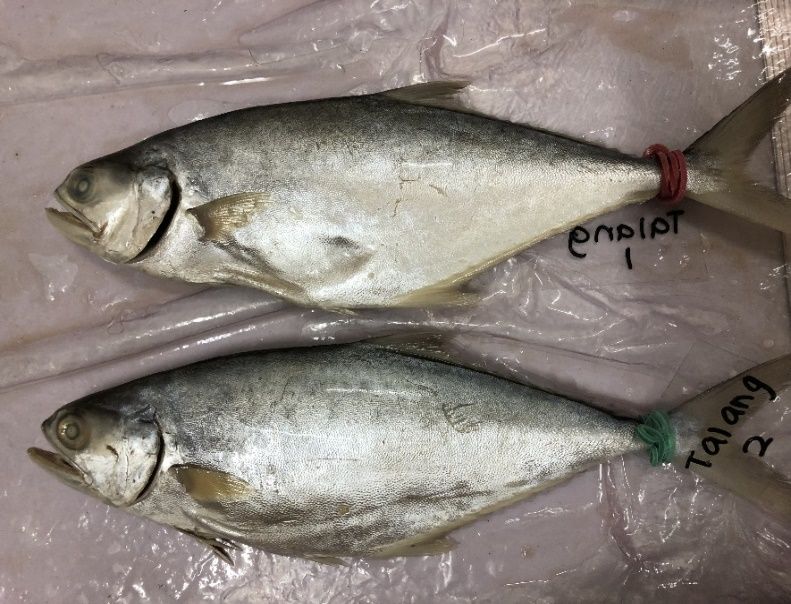
Hanif et. al., Malaysian Journal of Computing, 6(1): 667-678, 2021

3.7      The Relationship between QIM Score and RGB Value

The relationship between QIM score and RGB value can be determined by the freshness
condition of the entire fish samples during the period of 14 days. Based on the findings,
Threadfin was found to be in a fresh state from day 1 until day 2 when the QIM score was at 1
and the mean of RGB value was in the range of 158 to 171 for red, 158 to 169 for green, and
143 to 157 for blue. From day 3 up to day 8, the QIM score was 2 and the mean of RGB value
ranges from 145 to 163 for red, 143 to 161 for green, and 136 to 152 for blue. This indicates
that the condition of Threadfin during the period was stale. Threadfin began to spoil from day
9 until day 14 due to the QIM score of 3 and the mean value for red, green and blue ranges
from 149 to 161, 149 to 161 and 131 to 143 respectively.
         Besides, Queenfish possessed QIM score of 1 and the mean of RGB value ranging
from 162 to 170 for red, 160 to 168 for green, and 148 to 155 for blue from day 1 until day 4.
This shows Queenfish was in a fresh condition. From day 5 until day 11, the condition of
Queenfish was stale when the QIM score was at 2 and the mean of RGB value was in the
range of 165 to 182 for red, 166 to 184 for green, and 159 to 172 for blue. Queenfish started
to deteriorate when the QIM score reached 3 and the mean of RGB value ranging from 164 to
183 for red, 164 to 184 for blue, and 154 to 171 for blue. This condition happened on day 12
until day 14.
         On top of that, the independent sample t-test was used to compare means of QIM
score and RGB value for 14 days. The hypothesis was to test the significant differences
between QIM score and RGB value towards the fish freshness level. The significant value for
Queenfish is p < 0.05, thus it can be concluded that there is a significant difference between
QIM score and RGB value towards the fish freshness level. Next, the significant value for
Threadfin is also p < 0.05, therefore there is also significant difference between QIM score
and RGB value towards the Threadfin fish freshness level.

4.     Conclusion and Recommendations

In conclusion, the effects of temperature, environment, and storage method have been shown
to play an important role in determining the rate of deterioration towards the quality and
freshness level in Queenfish and Threadfin. From this study, a freshness indicator based on
Quality Index Method (QIM) and integrating multicolour channel RGB value for Queenfish
and Threadfin was created. Based on the QIM score, Threadfin was easier to deteriorate as
compared to Queenfish from its leaner body type of fish properties. Queenfish possessed QIM
score of 1 from day 1 until day 4, score of 2 from day 5 until day 11, and score of 3 from day
12 until day 14. Threadfin possessed QIM score of 1 from day 1 until day 2, score of 2 from
day 3 until day 8, and score of 3 from day 9 until day 14. Other than that, based on the RGB
value, the mean of blue value was the lowest among the three colours. The mean of RGB
value obtained for Threadfin was in the range of 145 to 172 for red, 143 to 169 for green, and
132 to 158 for blue from day 1 until day 14. Whereas the mean of RGB value for Queenfish
was ranging from 162 to 184 for red, 161 to 185 for green, and 148 to 173 for blue from day 1
to 14.
         Threadfin is in a fresh state when it possesses QIM score of 1 with RGB values range
between of 143 to 172. As deterioration progresses, the QIM score is at 3 and the RGB values
are ranging from 132 to 161. While Queenfish is found to be in a fresh state when it acquires
QIM score of 1 and the RGB values are in the range of 148 to 170. It starts to spoil when the
QIM score is at 3 and the RGB values are ranging from 154 to 184. As the changes of
integrating each RGB colour channel is considered strongly related and significantly different
with every scores of QIM for both samples, the findings of this study could contribute to an

                                                      676
Hanif et. al., Malaysian Journal of Computing, 6(1): 667-678, 2021
extensive study for a new parameter and the development of devices that includes image
analysis for fish freshness determination.
For future research, there are several types of ice can be used for storage instead of
crushed ice such as tube ice and flake ice. Flake ice is considered to be the best option for
chilling fish. This is because it will not cause the fish to bruise due to the less sharp edges of
the ice. It also offers the fish surface to have a good contact with the ice (Kinnunen, 2016).
Besides, its surface area is wide that allows it to hydrate and increase the moisture of the fish,
providing rapid chilling. While for the RGB value which is used to measure the level of the
fish freshness, it can be replaced by using other colour spaces. The recommended colour
spaces that can be used are Hue, Saturation and Value (HSV) or Lightness of colour, redness
vs greenness and yellowness vs blueness (L*a*b). A segmentation mask for a colour image
will be determined by different colour space.
Acknowledgement
The authors would like to thank Universiti Teknologi MARA, Perlis branch, Arau campus for
providing a helpful environment to conduct this study. The authors also would like to thank
the cooperation given by Lembaga Kemajuan Ikan Malaysia (LKIM), Kuala Perlis in carrying
out this study. Many thanks to the academic and administration staff, as well as Marine
Research Station (MARES) UiTM Perlis for their effort and recommendations to help in
improving this article.
References
Aguil, A. J. C., Repuyan, G. J. G., Anacan, R. M., & Valeriano, A. P. Z. (2018, October).
Freshness Assessment of Milkfish (Chanos Chanos) Using LabVIEW: Image Processing.
In TENCON 2018-2018 IEEE Region 10 Conference (pp. 1252-1257). IEEE.
Ashie, I. N. A., Smith, J. P., Simpson, B. K., & Haard, N. F. (1996). Spoilage and shelf‐life
extension of fresh fish and shellfish. Critical Reviews in Food Science & Nutrition, 36(1-
2), 87-121.
Aziz, K. N. A., Anthonysamy, S. I., Zainol, Z. E., Roslani, M. A., & Kamaruddin, S. A.
(2020). Fish Freshness Detector Using Sensory Quality Index Method and Digital Image
Processing Evaluation. In Charting the Sustainable Future of ASEAN in Science and
Technology (pp. 13-22). Springer, Singapore.
Cheusheva, S. (2019). Excel trendline types, equations and formulas. Available at
https://www.ablebits.com/office-addins-blog/2019/01/16/excel-trendline types-equations-
formulas/
Clucas, I. J., & Johnson, S. E. (1990). Use of ice by artisanal fisherfolk. NRI Technical Leaflet
(United Kingdom). Natural Resources Institute Technical Leaflet (United Kingdom).
Diler, A., & Genç, İ. Y. (2018). A practical quality index method (QIM) developed for
aquacultured rainbow trout (Oncorhynchus mykiss), International Journal of Food
Properties, 21:1, 858-867, DOI: 10.1080/10942912.2018.1466326
Esteban, M. A., (2012). An overview of the immunological defenses in fish skin. ISRN
immunology, 2012, 1-29.
677Hanif et. al., Malaysian Journal of Computing, 6(1): 667-678, 2021
Ghaly, A. E., Dave, D., Budge, S., & Brooks, M. S. (2010). Fish spoilage mechanisms and
preservation techniques. American journal of applied sciences, 7(7), 859-877.
Glass, D. (2003). Why Fish Smell More than Meat. Available at
https://indianapublicmedia.org/amomentofscience/why-fish-smells-more-than-meat.php
Griffiths, S. P., Fry, G. C., & Van Der Velde, T. D. (2006). Population dynamics and fishery
benefits of a large legal size of a pelagic sportfish, the Talang queenfish, Scomberoides
commersonnianus, in northern Australia. Fisheries Research, 82(1-3), 74-86.
Huss, H. (1995). Quality and quality changes in fresh fish. Rome: FAO. Available at
http://www.fao.org/home/en/
Ikape, S. I. (2017). Fish spoilage in the tropics: A review. Octa Journal of Biosciences, 5(2),
34-37.
Kinnunen, R. (2016, September 14). Doing this one thing will improve the quality of sport
caught fish. Available at
https://www.canr.msu.edu/news/doing_this_one_thing_improve_quality_of_sport_caught
fish_msg16_kinnunen16
Lougovois, V. P., & Kyrana, V. R. (2005). Freshness quality and spoilage of chill-stored
fish. Food policy, control and research, 1, 35-86.
Mahabubul, G., Zamidi, I., Samat, A., Zaidi, C., Mazlan, A., Al-, A. Q., & Simon, K. (2012).
Fecundity and Temporal Reproductive Cycle of Four Finger Threadfin (Eleutheronema
tetradactylum) in Malaysian Coastal Water. Asian Journal of Animal and Veterinary
Advances, 7(11), 1100-1109.
Masniyom, P. (2011). Deterioration and shelf-life extension of fish and fishery products by
modified atmosphere packaging. Songklanakarin Journal of Science &
Technology, 33(2), 181-192.
Sengar, N., Gupta, V., Dutta, M. K., & Travieso, C. M. (2018, February). Image Processing
Based Method for Identification of Fish Freshness Using Skin Tissue. In 2018 4th
International Conference on Computational Intelligence & Communication Technology
(CICT) (pp. 1-4). IEEE.
Shabani, F., Beli, E., & Rexhepi, A. (2019). Sensory Freshness Assessment of Ice Stored
Rainbow Trout (Oncorrhynchus mykiss). Turkish Journal of Agriculture – Food Science
and Technology, 7(10), 1597.
Shawyer, M., & Pizzali, A. M. (2003). The use of ice on small fishing vessels (No. 436). Food
& Agriculture Organisation.
Sornam, M., Radhika, A., & Manisha, M. (2017). Fish Freshness Classification Using
Wavelet Transformation and Fuzzy Logic Technology. Asian Journal of Computer
Science and Information Technology, 7(2), 15-21.
Zaragoza, P., Ribes, S., Fuentes, A., Vivancos, J. L., Fernández-Segovia, I., Ros-Lis, J. V., ...
& Martínez-Máñez, R. (2012). Fish freshness decay measurement with a colorimetric
array. Procedia engineering, 47, 1362-1365.
678You can also read