Model for High Dynamic Range Imaging System Using Hybrid Feature Based Exposure Fusion
←
→
Page content transcription
If your browser does not render page correctly, please read the page content below
J. Intell. Syst. 2021; 30:346–360

Research Article

Bagadi Ravi Kiran*, Vatsavayi Valli Kumari, and KVSVN Raju

Model for High Dynamic Range Imaging
System Using Hybrid Feature Based Exposure
Fusion
https://doi.org/10.1515/jisys-2018-0412
Received Oct 13, 2018; accepted Aug 14, 2019

Abstract: The luminous value is high for many natural scenes, which causes loss of information and occurs in
dark images. The High Dynamic Range (HDR) technique captures the same objects or scene for multiple times
in different exposure and produces the images with proper illumination. This technique is used in the various
applications such as medical imaging and observing the skylight, etc. HDR imaging techniques usually have
the issue of lower efficiency due to capturing of multiple photos. In this paper, an efficient method is proposed
for HDR imaging technique to achieve better performance and lower noise. The Luminance-Chrominance-
Gradient High Dynamic Range (LCGHDR) method is proposed to obtain the proper luminous value of images.
The same scenario is captured at different exposure are processed by the proposed method. Based on these
feature values extracted from the different images and exposure fusion technique was developed that helps
for the proper imaging. This experiment was evaluated and analyzed by comparing with the other methods,
which showed the efficiency of the proposed method. This method needs only 124.594 seconds for the com-
putation, while existing method need 139.869 seconds for the same number of images.

Keywords: Exposure, Exposure Fusion, High Dynamic Range, Luminance-Chrominance-Gradient HDR

1 Introduction
The real world scene has the dynamic range of the higher orders of magnitude much larger than the conven-
tional digital imaging system [1]. The details of the image lost due to the underexposure and overexposure.
The single image does not provide the information of the objects due to some loss of data in the images [2]. The
multiple image of the same scenario with the different exposure can provide the needed information about
the image, because different exposure of the image gives the different data [3]. The advancement in the image
acquisition technique helps to overcome the issues present in the current imaging system and capture the
scene with the higher value of dynamic range in the image from the exposure between the bright and dark
places [4, 5]. The photometric and colorimetric information calculated from captured images has been highly
used in scientific and engineering applications like an environment evaluation, for example, Unified Glare
Rating (UGR) measurement for office or road monitor, medical imaging and graphics rendering consists of
image-based lighting.
     Many approaches proposed to capture the image with the proper dynamic range and some methods mea-
sure luminance to capture the HDR image [6]. The basic method is to capture the image simultaneously with

*Corresponding Author: Bagadi Ravi Kiran: Andhra University College of Engineering, Visakhapatnam, Andhrapradesh,
India-531162; Email: brk2007@gmail.com
Vatsavayi Valli Kumari: Andhra University College of Engineering, Visakhapatnam, Andhrapradesh, India; Professor-
Department of CS&SE, Andhra University college of Engineering; Email: vallikumari@gmail.com
KVSVN Raju: Gayatri Vidya Parishad College for Degree and PG Courses, Rushikonda, Visakhapatnam, Andhrapradesh, India,
530 045; Email: kvsvn.raju@gvptc.edu.in

  Open Access. © 2020 B. Ravi Kiran et al., published by De Gruyter.        This work is licensed under the Creative Commons
Attribution 4.0 License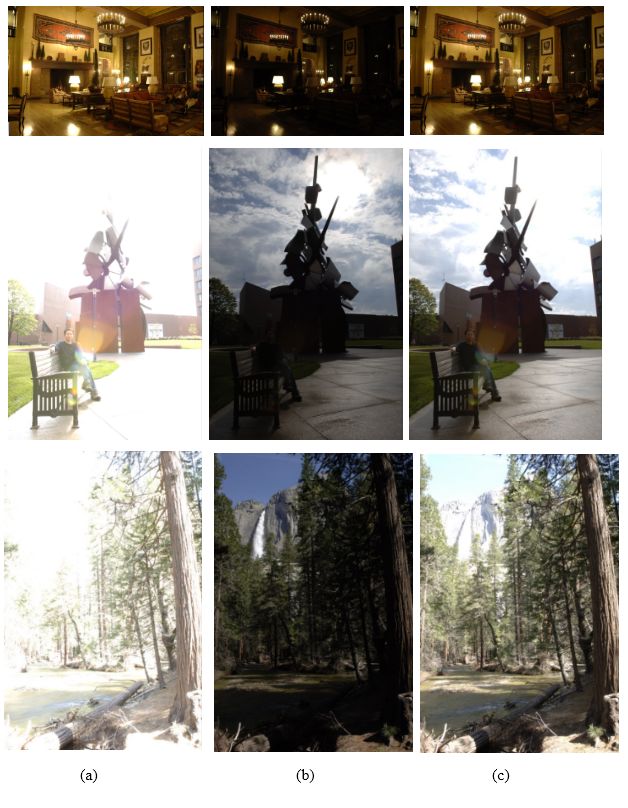
Exposure Fusion of HDR Imaging System Using Hybrid Feature | 347

the different exposure and then irradiance spatial dimensions of the same scenario [7]. The captured images
mapped to an HDR based efficient image reconstruction algorithm [8]. The exposure time of the camera de-
pends on the lens aperture, shutter speed, and International Organization of Standardization (ISO) levels;
the exposure time controls the intensity of the light incident on the image sensor [9]. The long exposure time
capture the dim details, whereas the bright area details captured using the short exposure time [10]. So, this
is difficult to provide the proper illumination image without noise by the previous methods in HDR imaging.
In this research, a Luminance-Chrominance-Gradient High Dynamic Range (LCGHDR) used for the effective
HDR imaging technique and to reduce noise in the image. This method extracts the Luminance, chrominance
and gradient value from the different exposure images and it produces the image with proper exposure. The
proposed HDR method compared with state-of-art methods such as BAR, AEE, false position and secant for
the evaluation purpose in the manner of efficiency and Signal to Noise Ratio (SNR). The proposed method
have the higher efficiency in fusing the image and provide the HDR image with high quality and low compu-
tational time. The proposed method showed higher performance compared to the other method.

2 Literature review
Current research technologies in the HDR imaging were reviewed in this section. This gives the current tech-
niques in the HDR imaging and also their advantages and limitations for the respective research.
     Xiaomin Wu, et al. [11] created a colorimetric method for the reconstruction in CIEXYZ with the camera
device implementation to attain the accurate colorimetric and luminance information of the HDR scene. The
colorimetric characterization transformed the individual RGB values of the picture into the related to CIEXYZ
values with unlimited capture. The weighing function calculated according to the value of characterization
accuracy fused with XYZ values. The performance was verified by the two phases of experiments and under
the constant relative Spectral Power Distribution (SPD) of lighting it outperformed the traditional ones, it has 2
CIELAB units less than the traditional one and in the illuminations of different Correlated Color Temperatures
(CCTs) is 3.5 CIELAB. The HDR reconstruction under mixed lighting conditions uses a standard color checker.
     Qingsen Yan, et al. [12] utilized the sparse representation framework to remove ghost from the HDR image
using the synthesis algorithm. The ghost artifacts created due to the adjacent Low Dynamic range (LDR) image
and the moving object sparsity. The problem formulated into the two processes, those are, detection of moving
object and ghost free HDR generation. The proposed method has the higher performance than the existing
methods based on the textures and colors. The overall performance of this technique was better and in the
few databases, the value of the Peak Signal to Noise Ratio (PSNR) was less than those other methods.
     Yuije Wu, et al. [13] established the calibrated embedded system for quasi real-time lighting for HDR sky
monitoring. The direction of the device was set in direct of a test module with unilateral-facades to calculate
the distribution of the luminance in sky and the ground dome. The measurement of the luminance distribu-
tion made for the sun, landscape and ground dome, and on-board luminance processed on the device. This
proposed method and the Perez all-weather sky model was compared and this method attained the more
reliable, which had the 10%-25% more accuracy due to HDR imaging and luminance mapping in transient
lighting computation of horizontal luminance. This can possibly help to improve the system that rejects the
sun’s component in the luminance map.
     Yang Song, et al. [14] proposed exposure condition analysis method depends on the quality evaluation
method for the tone-mapped HDR images. First, local exposure property is analyzed for the segmentation of
HDR exposure model that used to separate image. The two new quality features such as abnormal exposure
ratio and exposure residual energy extracted. The color-based feature was also extracted from the different ex-
posure region. The quality evaluation model implemented by regression training. The ability of the model to
calculate the quality of tone-mapped HDR images showed in their experiment. The Pearson linear correlation
coefficients are higher than 0.88; this technique has the high consistent with human visual perception.
     Hyuk-Ju Kwon, et al. [15] proposed the new method in the HDR blending algorithm, which used only
the dual-exposure image. The least squares method used in the proposed algorithm and it also included the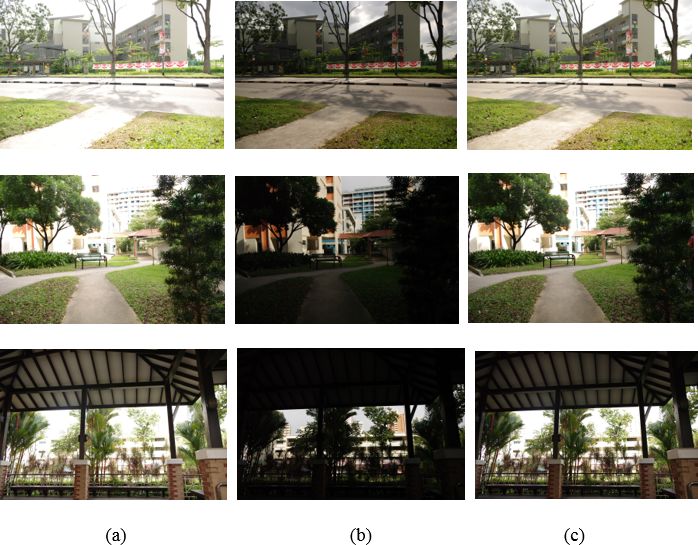
348 | B. Ravi Kiran et al.

spatial and intensity weighting functions. The error point was reduced and improved the function of camera
response using the weighting function. In addition, a constraint was added to correct the white balance in
the brightness level. The result showed that the proposed technique outperformed the existing methods. This
method was not evaluated in the real time function and this gives the efficiency of the system.
     The importance of the luminance property of HDR method is shown in the research [11] and [13]. The
sparse value of the image is very useful in HDR imaging and for ghost elimination in HDR [12], which may
contain some noise. The quality measure based on texture and color was proposed in [14], and this method
limited to preserving the image. The luminance property alone cannot provide higher efficiency and other
feature are need to be extracted. However, the quality of the images produced by the existing method is not
efficient for practical use and loss in the images are high. The existing method features is not involves in pre-
serving the image quality. The existing method doesn’t use the combination of the luminous, chrominance
and gradient features. The proposed method differ from the existing method in the form of three features
extraction such as Luminous, Chrominance and Gradient. These features are fused to provide the proper lu-
minous in HDR image. These limitations in HDR imaging method are overcome by proposing LCGHDR method
and increase the efficiency of HDR.

2.1 Limitations of Previous studies
The sparse representation framework [12] has better performance in HDR imaging. However, this does not
provide the HDR with high quality. This tends to loss in the details of the image. The existing method still
lacks in the provide the output images with less noise. The computation time is another factor is need to be
considered. The studies in the survey [11–15] doesn’t show much efficiency in the quality of the image. The
new technique is required to effectively perform the HDR function without affecting the image quality. The
comparison of the HDR imaging methods is shown in Table 1.

Table 1: Comparisons of previous studies

  Author(s)           Methods                Datasets       Advantages          Limitations           Performance
                                                                                                       evaluation
 Xiaomin Wu,        colorimetric            Simulated       The color is    Need to develop the          Average
  et al. [11]      characteriza-              data         reconstructed      method for mixed          luminous
                        tion                                 effectively.   lightning condition.      value = 1.33.
Qingsen Yan,       Sparse Repre-            Door, arch        Fusion is       The quality of the     PSNR = 16.12.
 et al. [12]         sentation             and sculpture     performed      output image is not
                                              garden           without              high.
                                             dataset.         artifacts.
 Yujie Wu, et        Calibrated             Simulated       Accuracy is      The output image        Relative error
   al. [13]          Embedded                  data         high in this       are having high          = 11%.
                      System                                  method.       luminous value and
                                                                            affects the details of
                                                                                   images.
Yang Song, et      Tone mapping            Tone-mapped     Error value is   The accuracy of the         RMSE =
   al. [14]          based on                  Image        low in this      method is need to          0.8342.
                     exposure                Database        method.            be increased.
                                               (TMID)
  Hyuk-Ju            Spatial and             Simulated       The color      The higher exposure            -
 Kwon, et al.         intensity               dataset      distortions is   image is need to be
    [15]             correlation                             reduced.           considered.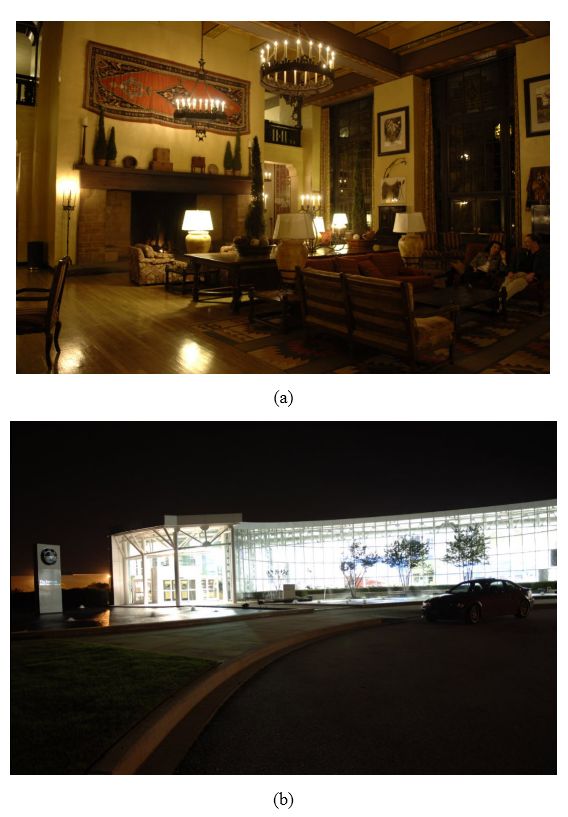
Exposure Fusion of HDR Imaging System Using Hybrid Feature | 349

3 Proposed method
The images from the database used as an input and the features such as luminance, chrominance and gra-
dient were extracted from those images. An exposure fusion technique was developed based on the features
and provide the image with the proper luminance. The higher luminance image and lower luminance images
used as input. The experimental result compared with other existing method in the HDR imaging. The flow
chart of the LCGHDR method is shown in the Figure 1. The illustration of the dataset and algorithm of this
method is given below.

Figure 1: The flow chart of LCGHDR method

Pseudo code
    1. Begin
    2. Read image \\the input images with high exposure I H .
    3. Check whether the scenario is under exposure, over exposure or proper exposure using the mean
       luminance value of the image. The mean luminance value of the image is 0 to 100 is under exposed,
       100 to 150 is properly exposed and 150 above is over exposed.
    4. If       over exposed
             a. L H = L
             b. Measure L, C and G.     \\Measure the mean value of high exposure image L H .
             c. Fuse L, C and G.
    5. If Else Lower exposed
             a. L L = L
             b. Measure L, C and G;
             c. Fuse L, C and G;
    6. Else
             a. L = L;
    7. End
    8. End
350 | B. Ravi Kiran et al.
The input images is measured in terms of exposure value. If the input images is under expose and lower
exposure, then measure the luminous, chrominance and gradient value. Fuse the value to provide the proper
exposure image with other exposure image.
A. Database collection
The HDR Photographic Survey is the exclusive HDR database and consists of detailed colorimetric/luminance
measurements [16]. The images have the contents and challenges with the data for the HDR algorithm. This is
a publicly available database and this can be followed for the non-commercial research purpose. The attempt
was made to collect the datasets up to 40 images and having 106 images in total by now. Twenty-eight images
in the database have been accompanying colorimetric, appearance data and the several data associated with
the remaining data in the images. The thumbnail is available in the database to view the image and the images
can be downloaded in the OpenEXR file. The database size is more than 13GB and this database inspired from
the nineteenth century photographic survey of the American west. This database and stimulated database
used to understand the performance of this method. Figure 1 shows the sample images from the database.
Apart from this, simulated dataset are used. The ten scenes were captured with different exposure for each
scene.
B. Exposure Fusion
The luminance, the two chrominance and gradient components are denoted as Y, U, V, respectively. Let
z = [z R , Z G , Z B ] be an image in the RGB space and ζ = [ζ Y , ζ U , ζ V , ζ G ] is the same images in the luminance,
chrominance and gradient space. The RGB value of the image are denoted in Roman letters and gradient
values are denoted in Greek letters. The transformation of the image from the RGB to the manner of luminance,
chrominance and gradient is defined in the matrix form as ζ = zA, where A is the matrix normalized in
such a way that if z(−) √︁ ∈ [0, 1]3 , then ζ (−) ∈ [0, 1] × [−0.5, 0.5]2 . The hue and saturation can be defined as
U (︀ )︀2 (︀ )︀2
H = arctan ζζ V and S = ζ U + ζ V , respectively.
Consider a set of images ζ i = [ζ iY , ζ iU , ζ iV , ζ iG , i = 1, ...., N in the luminance-chrominance-gradient space,
captured with different exposure time ∆t i and with LDR, assuming ζ (x) ∈ [0, 1] × [−0.5, [︁ 0.5]2 , where
]︁ X =
Y U U G
[x1 , x2 ] is a pixel representation. The objective is to obtain the single HDR image ζ̃ = ζ̃ , ζ̃ , ζ̃ , ζ̃ in the
same color space. In this method, the luminance, chrominance and gradient values are processed separately.
1. Luminance component composition
The multiple images captured from the same scenario with the different exposure times used to calculate the
luminance channel. The sufficient amount of pixels is taken with increasing monotonical values between
under and over-exposure images. Using these pixels, the camera response function is fitted and applied an
Singular Value Decomposition (SVD) solver. In this research, 100 pixels are considered as sufficient in most
cases. The camera response measured only once and used for the input values as linearization in all HDR
compositions of the same device.
The HDR luminance component calculated by a pixel wise weighted average of input luminance and as
a weighting function, Gaussian function with a mean of 0.5 and a standard deviation of 0.2 thus ensuring
a smaller impact of the under or over-exposed pixels. The calculation of the logarithmic HDR luminance
obtained as Eq. (1).
N
ω Y (ζ iY (x))(g(ζ iY (x)) − ln∆t i )
∑︀
Y i=1
ln ζ̃ (x) = (1)
N
ω Y (ζ iY (x))
∑︀
i=1Exposure Fusion of HDR Imaging System Using Hybrid Feature | 351
From the Eq. (1), is the camera response function and the value of the HDR luminance is measured in the
logarithmic scale. After applying the natural exponential, the resulting values are positive, normally span-
ning [10−4 104 ] thus being truly HDR.
2. Chrominance component composition
There is no camera response required for the chrominance components and the color saturation is taken for
the weight the chrominance. If the value of the color saturation is high in the image, that means the valuable
chromatic information is present in more pixel and the weight is higher. More specifically, ω UV (S) = S α , where
1 > α < 2. In this method, we found that α = 1.5 is a good choice. The mean value is set when the pixel is over
and under exposed, it will less saturated than the correct exposure. The mean value is less than one is under
exposed and more than two involves in over-exposed. In order to preservation of color in the image, the same
weight is used for the both chromatic components and compose any chromatic component C ∈ {U, V } as
Eq. (2).
N
ω UV (S i (x))ζ iC (x)
∑︀
C i=1
ζ̃ (x) = (2)
N
UV
∑︀
ω (s i (x))
i=1
Where S i denotes the saturation of ζ i . Bearing a convex combination of the input chrominances, the range of
ζ̃ C (x) is again in [−0.5, 0.5]. The distinct pixel value possible number is greater than in the original source
sequence.
3. Gradient value of the image
The weighted map of the gradient information is generated for static and dynamic scenario and similarly to
Canny detection, the first derivatives of 2-D Gaussian filter g(x, y; σ d ) in the x- and y- directions to extract the
gradient information is given in the Eq. (3) & (4).
∂
I xi (x, y) = I i (x, y) ⊗ g(x, y; σ d ) (3)
∂x
∂
I yi (x, y) = I i (x, y) ⊗ g(x, y; σ d ) (4)
∂y
Where I xi (x, y) and I yi (x, y) are the partial derivatives of image I i (x, y) along the x- and y- directions, respec-
tively. Standard deviation σ d is set to two pixels in the experiments and the gradient magnitude reflects the
maximum change in pixel values, whereas the angle points out the direction related to the maximum change.
These two components calculated in the following Eq. (5).
√︁
2
ζ̃ G (x, y) = |I yi (x, y)|2 + |I xi (x, y) (5)
The luminance, chrominance and the gradient values used to develop for exposure fusion and this pro-
vide the image with proper illumination. The brief description of the fusion method using the feature values
is given below.
C. Fusion Method
A luminance range reduction operator is T and define its output, the reduced-range luminance image, as
ζ (x) ∈ [0, 1]. This is the most effective approach in term of the chromatic channels. The sRGB gamut does not
allow the rendering of the very dark or very bright and saturated colors, which is present in the real scenes and
captured in the HDR images. Therefore, there is a need for a chromatic feature and hue intact while sacrificing
saturation in order to fit into the sRGB gamut. Introducing a scaling factor δ for the two chrominance will scale352 | B. Ravi Kiran et al.
down the saturation and not change the hue. The scheme is used to guarantee sRGB values present in color
space transformation itself, which is described as follows.
Let B = A−1 be the luminance, chrominance and gradient to RGB transformation matrix and define the
gray (achromatic) image and its chromatic complement image in RGB space by
⎡ ⎤T
T(ζ̃ Y (x))
z gray (x) = [z Rgray (x) z Bgray (x)] = ⎣ 0 ⎦ B.
⎢ ⎥
0
⎡ ⎤T
0
z chrom (x) = [z Rchrom (x) z Gchrom (x) z Bchrom (x)] = ⎣ζ̃ U (x)⎦ B.
⎢ ⎥
ζ̃ V (x)
T T
⎡ ⎤
T(ζ̃ G (x))
ż grad (x) = [ż Rgrad (x) ż Ggrad (x) ż Bgrad (x)] = ⎣ 0 ⎦ B.
⎢ ⎥
0
Remark that z gray (x) is truly a gray image because in RGB to luminance, chrominance and gradient trans-
forms b1,1 = b1,2 = b1,2 . Look for a map δ ≥ 0, calculated in the Eq. (6) and (7).
ż(x) = ż gray (x) + δ (x) z chrom (x) ∈ [0, 1]3 + ż grad (x) (6)
This can be define by δ(x) = min{1, δ R (x), δ g (x), δ B (x)}
⎧ R
z gray (x) R
⎪ −z Rchrom (x) if z chrom (x) < 0
⎪
⎪
⎨ R
δ R (x) = 1−z gray (x) R (7)
⎪ z Rchrom (x) if z chrom (x) > 0
⎪
if z Rchrom (x) = 0
⎪
1
⎩
Where δ g and δ B are defined analogously. Thus, δ is the largest one, which allows the condition (1) to
hold. It is easy to realize that the hue of z(x) is not influenced by δ, whereas the saturation is measured
proportionally to it. The low dynamic range image z(x) has colors which consists of the same hue as those in
the HDR image ζ̃ and which are desaturated a little, as it needed to fit within the sRGB gamut.
The fused image can be defined in the Eq. (8) with luminance, chrominance, and gradient space as
ζ̇ (x) = [T(ζ̃ Y )(x)δ(x)ζ̃ U (x)δ(x)ζ̃ V (x)T(ζ̃ G (x)] (8)
The luminance, chrominance and gradient image ζ can be compressed and stored directly with an arbi-
trary method and for display transformed into RGB using the matrix B. This method evaluated and its perfor-
mance presented in the experimental result section.
4 Experimental Result
The experiment conducted in the software of MATLAB (R2017b) with the system specification of 4GB of RAM
and 3.0 GHz processor. The value of iteration was set at 50 and the various images with different exposure
considered as input and process the image. The iteration value above 50 is static for almost every image in
the dataset. Hence, the iteration value is set as 50. The output obtained as a properly illuminated image and
that image took for the evaluation. This method was evaluated in terms of efficiency and Signal to Noise
ratio (SNR). The other existing methods were also processed in the same dataset and compared it with the
proposed method. The database has the same images with different illumination and it consists of the few
sets of images. The proposed method is evaluated with the existing method in the same hardware resources
with same images. Each set of images have the fifteen similar image capture in the different exposure. The
HDR techniques used for the 10 set of images and obtain the image with proper illumination.Exposure Fusion of HDR Imaging System Using Hybrid Feature | 353
The input images obtained from the HDR Photographic Survey dataset and 106 images are used as an
input image for evaluation. The feature values such as luminance, chrominance and gradient values extracted
from the images. The fusion technique was developed based on the feature value and it provided the proper
illumination measure. The two input images of the HDR Photographic Survey database are shown in the
Figure 3 (a) & (b) with the high illumination in 3 (a) and low illumination in 3 (b) for three images like living
room, lawn, and forest respectively. The output image with the proper illumination is given in the Figure 3
(c). The two input images of stimulated dataset are shown in the Figure 4 (a) & (b) for three images such as
building 1, building 2 and park, the output of respective image is shown in the Figure 4 (c).
Figure 2: HDR Photographic Survey (a) Ahwahnee Great Lounge image with low luminance (b) Zentrum image with low lumi-
nance
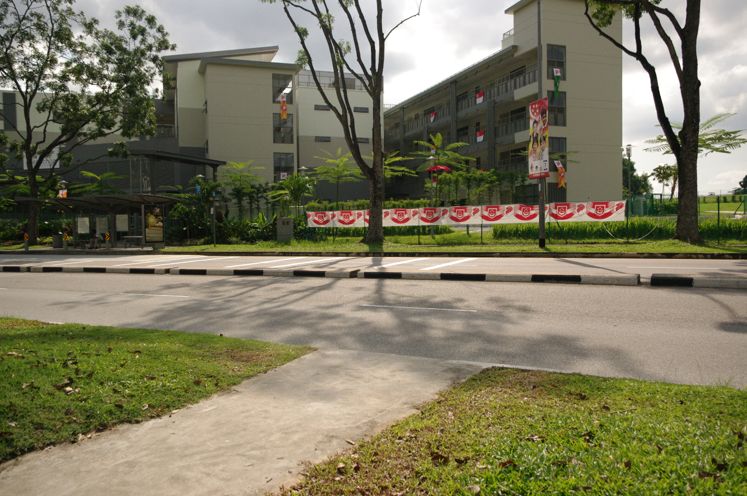
Figure 3: Sample image of building from Stimulated database354 | B. Ravi Kiran et al.
Figure 4: (a) Input image with high luminance (b) Input image with low luminance (c) output image
A. Performance evaluation in HDR Photographic Survey database and Simulated database
The BAR and Adaptive Exposure Estimation (AEE) [17] were compared with the LCGHDR to analyze its func-
tion in the manner of percentage of lost, shots, and Time efficiency (Table 1). The proposed method showed
higher performance in terms of the time compared to the other two methods (BAR and AEE). The BAR method
uses the three shots of the picture for HDR, and LCGHDR, AEE uses two shots. The pixel lost value denoted
as a percentage of the pixel lost in fusion technique, which measured from the comparison of input and
output image. Some captured images of lost value are equal to zero, which shows no loss in the fusion tech-
N
∑︀
nique. The time efficiency T i (s) is the total time computation for the exposure fusion with total number
i=1
of caption. The LCGHDR method requires only two captured images and less time for the HDR imaging. In
Simulated database, the ten scenes were captured in total and there are 15 images with different illumina-
tion is captured for each scene and used for HDR imaging. In HDR photographic survey database, the BAR
method need 218.734 seconds for the 96 images and AEE method took total 81 images in 139.869 seconds. The
proposed method requires 124.594 seconds for the 81 images.Exposure Fusion of HDR Imaging System Using Hybrid Feature | 355
The mean luminous value for the five images from the simulated dataset are shown in the Table 2. The
Mean luminous value of the two inputs and one-output images for the five images presented in the Table 2. The
mean value of the highly exposed input images having the higher luminance value and for the low exposed
image has the low luminance value. These images used to measure the feature values and exposure fusion
helps to produce the image with a proper illuminant value.
Table 2: Comparison of BAR, AEE and LCGHDR
N
∑︀
Number of scene Methods Number of shots % Lost T i (s)
i=1
1 BAR 3 1.61 0.301
AEE 2 1.61 0.025
LCGHDR 2 1.61 0.014
2 BAR 3 0 0.301
AEE 2 0 0.101
LCGHDR 2 0 0.85
3 BAR 3 0 0.301
AEE 2 0 0.04
LCGHDR 2 0 0.021
4 BAR 3 0 0.301
AEE 2 0 0.05
LCGHDR 2 0 0.032
5 BAR 3 0 0.301
AEE 2 0 0.034
LCGHDR 2 0 0.015
6 BAR 3 0 0.301
AEE 2 0 0.025
LCGHDR 2 0 0.012
7 BAR 3 0 30.282
AEE 2 0 13.067
Proposed LCGHDR 2 0 11.042
Table 3 gives the PSNR value for the input images and output images. The input images are Low Dynamic
Range (LDR) images and output images are fused images. The four Scenes of images used to measure the
PSNR value. The two input images used for each case and average PSNR measure compared with the output
images. This shows that the PSNR value for the output image is higher than the input images.
Table 3: Mean value for the input and output images
Scenes Images Mean luminous value
High exposed input image Low exposed input image Output image
Scene 1 Living room 162 95 124
Scene 2 Forest 168 92 112
Scene 3 Building 1 184 72 134
Scene 4 Building 2 173 93 132
Scene 5 Park 167 82 121356 | B. Ravi Kiran et al.
B. Signal to Noise Ratio
The SNR is measured for this method and compared it with other methods. In the AEE method, the four
different conditions made for comparative purpose namely A (LO = 3 and HI =253), B (LO = 16 and HI =240),
C (LO = 56 and HI =200), and D (LO = 106 and HI = 150). The proposed LCGHDR has been compared with
the AEE method with four different conditions, BAR method and Ground Truth (GT) images. The SNR value is
measured by ratio of HDR value () over the standard deviations (). The SNR values measured using the Eq. (9)
and shown in the Table 4. (︂ )︂
E xy
SNR xy = 20 × log10 (9)
σ xy
Table 4: PSNR value for the images
Images Average PSNR value of input image Output image PSNR value
Scene 1 24.24 28.51
Scene 2 25.74 30.54
Scene 3 22.15 27.94
Scene 4 24.78 28.78
The proposed LCGHDR method has been compared with the other methods and AEE method with four
different conditions, shown in Table 4. The number of shots is given in the table with the total computation
time. The proposed method has the better SNR performance compared to the other method. The number of
shots of the proposed method is four and compared it with other methods. This provides high performance
compared to the other methods.
The graphical representation of the SNR values for the different method presented in the Figure 5. The AEE
method evaluated in the four different conditions and compared it with the proposed system. The proposed
system utilizes the four shots for its function and has higher SNR value compared to the other methods.
Figure 5: Stimulated dataset (a) High exposure Input image (b) Low exposure Input image (c) Output image with proper expo-
sureExposure Fusion of HDR Imaging System Using Hybrid Feature | 357
C. Evaluation in Stimulated dataset
LCGHDR has been compared with six methods in terms of control time in HDR imaging with seconds is shown
in Table 5. The four cases evaluated for the processing these six existing methods and the mean value is calcu-
lated. The control time stopped if the process takes more than 20 seconds for the processing. The HDR image
is need to be processed in less time and techniques required more than 20 second to process HDR is not ap-
plicable for the practical purposes [19]. The false prediction method requires more time for processing the
four cases as well as the Secant, Bisection and Kuno. The false prediction having the large time for the HDR
imaging of exceeding 20 seconds, Kuno has lower time of 0.08 seconds. The secant also has the exceeding
20 seconds and Bisection requires 0.48 seconds. The proposed method needs only less time for the computa-
tion except Kuno. But Kuno and Liang method often fails in processing the images. The Kuno method is not
iteration method, so convergences techniques is not applied that tends to create exposure error in the image.
The Liang method on the other hand doesn’t considered the underexposed part. As the results, this will cre-
ate tumbling effort in the most of the image. The Liang method has higher efficiency in time compared to all
other method and it causes a tumbling effect in its functions.
Table 5: SNR value for the different method
Methods Number of shots ∆t(s) SNR (dB)
AEE A [17] 3 14.79 27.19
AEE B [17] 4 15.02 30.47
AEE C [17] 5 31.32 32.58
AEE D [17] 16 61.22 33.57
GT [17] 55 151.43 35.32
BAR [18] 4 30.3 29.97
Proposed LCGHDR 4 12.58 36.27
Table 6: Control time in seconds for several methods
Control time in seconds
Mean Case 1 Case 2 Case 3 Case 4
False position [19] 20 20 20 20 20
Secant [19] 20 20 20 20 20
Bisection [19] 0.48 0.48 0.48 0.48 0.4
Kuno [20] 0.08 0.08 0.08 0.08 0.08
Liang [21] 0.35 0.24 0.16 0.56 0.44
Yuanhang [19] 1.23 0.72 0.48 2.6 1.12
Proposed LCGHDR 0.795 0.63 0.32 1.4 0.83
The graphical representation of the control time of the six methods showed in the Figure 6. The false pre-
diction method and Secant method require more than 20 seconds for image fusing. If any method performs
more than 20 seconds, then it stops immediately. The remaining method has the least time for the HDR imag-
ing and Kuno have the very less time for its function. There are four cases used to evaluate the performance
of the methods in the manner of the time (seconds). The proposed system showed the efficient time for the
processing of HDR imaging except Kuno and Liang. But, Kuno often fails in the processing and Liang has the
higher tumbling effects in their process.358 | B. Ravi Kiran et al. Figure 6: SNR comparison Figure 7: Control time D. Comparison Analysis The comparison has been done between the proposed LCGHDR method and existing method in terms of con- trol time. The LCGHDR method and existing methods are processed in the same hardware resources and the parameter is measured. The total computation time is measured for both existing and LCGHDR methods, which is shown in Table 6. The proposed LCGHDR achieved the notable result in the HDR technique com- pared to other methods. The area-based method was followed in the research [22] and high probability error occurred in this method due to poor specular detection. The study [23] used sigmoid-based mapping curve method and gamma expansion method was evaluated in the research [24]. Gwon Hwan An, et al. [25] pro- posed a method based on the tone mapping, which uses the adaptive specular region to identify the bright and dark region. This technique achieved high quality image using final mapping decision method with low execution time. The discrete cosine transform technique was used to generate the residual data and created the backward compatible image coding method for HDR [26]. In Table 6 the LCGHDR method is compared with other methods and shows that this technique is process with low computational time.
Exposure Fusion of HDR Imaging System Using Hybrid Feature |         359

Table 7: Computational time analysis of various HDR method

                                 Different techniques               Computational time
                                 Meylan et al. [22]                 1.2153
                                 Huo et al. [23]                    1.4100
                                 Masia et al. [24]                  0.9955
                                 Gwon Hwan An, et al. [25]          0.6599
                                 Seungcheol Choi, et al. [26]       1.3505
                                 HDRCloudSeg [27]                   0.6241
                                 LCGHDR                             0.5826

Table 8: Computation complexity of different methods

                                         Method           Computation Complexity
                                      False position           O(n log n)
                                          Secant                  O(n3 )
                                        Bisection              O(n log n)
                                           Kuno                   O(n2 )
                                         LCGHDR                 O(log n)

E. Computation Complexity
The computation complexity of the LCGHDR method is measured as O(log n). The computation time increases
as the size of input increases. The proposed method is highly based on the pixel value of the image. Hence,
the computational complexity is derived as O(log n).
    This experimental result clearly showed that the proposed LCGHDR method has higher efficiency and
higher SNR values. From the analysis, it is clear that LCGHDR technique performed using less number of
captures and produced a high detailed image.

5 Conclusion
The HDR imaging captures multiple images and give the proper illumination of the image for better under-
standing of information. The loss of information may occur in the high and low exposure; this makes the HDR
imaging as a more important method. The same images with different exposure are captured and analyzed
for the proper illumination. Now a days HDR techniques are highly used and in the smartphone camera. The
HDR imaging generally has the problem of low efficiency due to the process of capturing multiple images and
analyze for better illumination. LCGHDR method requires less captures for the function of HDR, which helps
in reduction of the performance time. The proposed method is evaluated on both benchmark dataset and
simulated dataset. The proposed method outperformed the existing methods in the terms of efficiency and
SNR. The PSNR values attained higher than the input images and this method executed in 124.594 seconds
while existing method has required 139.869 seconds for execution. The future work will be removing the ghost
artifacts in the HDR imaging without affecting the quality of the image.

References
[1]   S. Schulz, M. Grimm, and R.R. Grigat, “Using brightness histogram to perform optimum auto exposure,” WSEAS Transactions
      on Systems and Control, vol. 2, no. 2, p.93, 2007.
360 | B. Ravi Kiran et al.
[2] T. Grosch, “Fast and robust high dynamic range image generation with camera and object movement. Vision, Modeling and
Visualization,” RWTH Aachen, pp. 277-284, 2006.
[3] S.C. Hsia, and T.T. Kuo, “High-performance high dynamic range image generation by inverted local patterns,” IET Image
Processing, vol. 9, no. 12, pp. 1083-1091, 2015.
[4] S. Uda, F. Sakaue, and J. Sato, “Variable exposure time imaging for obtaining unblurred HDR images,” IPSJ Transactions on
Computer Vision and Applications, vol. 8, no. 1, pp. 3, 2016.
[5] P.J. Lapray, B. Heyrman, and D. Ginhac, “HDR-ARtiSt: an adaptive real-time smart camera for high dynamic range imaging,”
Journal of Real-Time Image Processing, vol. 12, no. 4, pp. 747-762, 2016.
[6] I. Popadić, B.M. Todorović, and I. Reljin, “Method for HDR-like imaging using industrial digital cameras,” Multimedia Tools
and Applications, vol. 76, no. 10, pp. 12801-12817, 2017.
[7] G.Y. Lee, S.H. Lee, H.J. Kwon, and K.I. Sohng, “Visual acuity-adaptive detail enhancement and shadow noise reduction for
iCAM06-based HDR imaging,” Optical Review, vol. 22, no. 2, pp. 232-245, 2015.
[8] W. Sun, C. Han, X. Xue, H. Lv, J. Shi, C. Hu, X. Li, Y. Fu, X. Jiang, L. Huang, and H. Han, “An HDR imaging method with DTDI
technology for push-broom cameras,” Photonic Sensors, vol. 8, no. 1, pp. 34-42, 2018.
[9] A.R. Várkonyi-Kóczy, S. Hancsicska, and J. Bukor, “Fuzzy information measure for improving HDR imaging,” In proceedings on
Recent Developments and New Direction in Soft-Computing Foundations and Applications, Springer, Cham, pp. 113-126, 2016.
[10] A.G. Patil, and S. Raman, “Tone Mapping HDR Images Using Local Texture and Brightness Measures,” In Proceedings of
International Conference on Computer Vision and Image Processing, Singapore, pp. 443-452, 2017.
[11] X. Wu, J. Fang, H. Xu, and Z. Wang, “High dynamic range image reconstruction in device-independent color space based on
camera colorimetric characterization,” Optik-International Journal for Light and Electron Optics, vol. 140, pp. 776-785, 2017.
[12] Q. Yan, J. Sun, H. Li, Y. Zhu, and Y. Zhang, “High dynamic range imaging by sparse representation,” Neurocomputing, vol. 269,
pp. 160-169, 2017.
[13] Y. Wu, J.H. Këmpf, and J.L. Scartezzini, “Characterization of a quasi-real-time lighting computing system based on HDR
imaging,” Energy Procedia, vol. 122, pp. 649-654, 2017.
[14] Y. Song, G. Jiang, M. Yu, Z. Peng, and F. Chen, “Quality assessment method based on exposure condition analysis for
tone-mapped high-dynamic-range images,” Signal Processing, 2017.
[15] H.J. Kwon, S.H. Lee, G.Y. Lee, and K.I. Sohng, “Radiance map construction based on spatial and intensity correlations between
LE and SE images for HDR imaging,” Journal of Visual Communication and Image Representation, vol. 38, pp. 695-703, 2016.
[16] M.D. Fairchild, “The HDR photographic survey,” In Proceedings of the Color and Imaging Conference, Society for Imaging
Science and Technology, vol. 2007, no. 1, pp. 233-238, 2007.
[17] M.A. Martínez, E.M. Valero, and J. Hernández-Andrés, “Adaptive exposure estimation for high dynamic range imaging applied
to natural scenes and daylight skies,” Applied optics, vol. 54, no. 4, pp. B241-B250, 2015.
[18] Barakat, N., Hone, A.N. and Darcie, T.E., 2008. Minimal-bracketing sets for high-dynamic-range image capture. IEEE Transac-
tions on Image Processing, 17(10), pp.1864-1875.
[19] Y. Su, J.Y. Lin, and C.C.J. Kuo, “A model-based approach to camera’s auto exposure control,” Journal of Visual Communication
and Image Representation, vol. 36, pp. 122-129, 2016.
[20] Kuno, T., Sugiura, H. and Matoba, N., 1998. A new automatic exposure system for digital still cameras. IEEE Transactions on
Consumer Electronics, 44(1), pp.192-199.
[21] Liang, J., Qin, Y. and Hong, Z., 2007, October. An auto-exposure algorithm for detecting high contrast lighting conditions.
In 2007 7th International Conference on ASIC (pp. 725-728). IEEE.
[22] L. Meylan, S. Daly, and S. Süsstrunk, “The reproduction of specular highlights on high dynamic range displays,” In Proceedings
on Color and Imaging Conference, Society for Imaging Science and Technology, no. 1, pp. 333-338, 2006.
[23] Y. Huo, F. Yang, L. Dong, and V. Brost, “Physiological inverse tone mapping based on retina response,” The Visual Computer,
vol. 30, no. 5, pp. 507-517, 2014.
[24] B. Masia, A. Serrano, and D. Gutierrez, “Dynamic range expansion based on image statistics,” Multimedia Tools and
Applications, vol. 76, no. 1, pp. 631-648, 2017.
[25] G.H. An, Y.D. Ahn, S. Lee, and S.J. Kang, “Perceptual brightness-based inverse tone mapping for high dynamic range imaging,”
Displays, vol. 54, pp. 1-8, 2018.
[26] S. Choi, O.J. Kwon, J. Lee, and Y. Kim, “A JPEG backward-compatible image coding scheme for high dynamic range images,”
Digital Signal Processing, vol. 67, pp. 1-16, 2017.
[27] Dev, S., Savoy, F.M., Lee, Y.H. and Winkler, S., 2018. High-dynamic-range imaging for cloud segmentation. arXiv preprint
arXiv:1803.01071.You can also read