U.S. county level analysis to determine If social distancing slowed the spread of COVID-19
←
→
Page content transcription
If your browser does not render page correctly, please read the page content below
Original research                                                                                                                                                                                                   Pan American Journal
                                                                                                                                                                                                                           of Public Health

U.S. county level analysis to determine If social
distancing slowed the spread of COVID-19
Tannista Banerjee1 and Arnab Nayak2

Suggested citation Banerjee T and Nayak A. A county level analysis to determine if social distancing slowed the spread of COVID-19 in the United
                   States. Rev Panam Salud Publica. 2020;44:e90. https://doi.org/10.26633/RPSP.2020.90

ABSTRACT                         Objective. To analyze the effectiveness of social distancing in the United States (U.S.).
                                 Methods. A novel cell-phone ping data was used to quantify the measures of social distancing by all U.S.
                                 counties.
                                 Results. Using a difference-in-difference approach results show that social distancing has been effective in
                                 slowing the spread of COVID-19.
                                 Conclusions. As policymakers face the very difficult question of the necessity and effectiveness of social
                                 distancing across the U.S., counties where the policies have been imposed have effectively increased social
                                 distancing and have seen slowing the spread of COVID-19. These results might help policymakers to make the
                                 public understand the risks and benefits of the lockdown.

Keywords                         Coronavirus; pandemics; behavior, social; quarantine; United States

   In March 2020, the World Health Organization (WHO) named                                                             the main source of infection, medical researchers worldwide
a new category of coronavirus (SARS-CoV-2) that has started                                                             advised early intervention in the form of strict social distancing
a global pandemic, causing the disease later named COVID-19.                                                            as the most definitive tool to slow the virus’ rapid spread and
This virus is said to have existed in bats for a long time, before                                                      save thousands of lives [4]. Compelled by such warnings and
it transferred from bats to humans and then from human-                                                                 some early validation of the effectiveness of the lockdown in
to-human sometime by the end of 2019 in Wuhan, China. The                                                               China and a few other countries, governments across the globe
disease spreads very rapidly from human-to-human as infected                                                            have been forced to resort to extreme economy-wide lockdowns
people transmit the virus when contaminating surfaces by                                                                of all but the most essential services.
touch or via droplets from coughing and sneezing [1-3]. Accord-                                                            Economists and data scientists around the world have
ing to the US Center for Disease Control and Prevention (CDC),                                                          already started thinking about the economic and social effects
the virus often spreads unbeknownst of a host with mild or no                                                           of the COVID-19. In the online book Economics in the Time of
symptoms and yet kills many in its wake.                                                                                COVID-19 edited by Baldwin and Mauro [5] many different
   After COVID-19’s emergence and spread in China, it started                                                           economic questions have been discussed by some leading
spreading globally via international air-travel and then through                                                        economists. The book analyzes possible economic effects of
community spread within its new host countries. The WHO                                                                 COVID-19, including macroeconomic effects, financial effects
declared COVID-19 a global pandemic in early March 2020, and                                                            and travel and trade sectors effects. However, the important
many countries’ health organizations began warning about the                                                            question that we concentrated on in this paper is: How the US
extreme contagiousness of the disease. Given that there is no                                                           consumers’ decisions to adhere to the social distancing regula-
effective pharmaceutical intervention against the virus and as                                                          tions are affecting the spread of the virus? For example, it has
socialization in common spaces, including the workplace, is                                                             been shown that non-pharmaceutical interventions like school

1
    Auburn University, Auburn, United States of America * Tannista Banerjee,                                            2
                                                                                                                            Mercer University, Atlanta, United States of America
    tzb0018@auburn.edu

      This is an open access article distributed under the terms of the Creative Commons Attribution-NonCommercial-NoDerivs 3.0 IGO License, which permits use, distribution, and reproduction in any medium, provided the
      original work is properly cited. No modifications or commercial use of this article are permitted. In any reproduction of this article there should not be any suggestion that PAHO or this article endorse any specific organization
      or products. The use of the PAHO logo is not permitted. This notice should be preserved along with the article’s original URL.

Rev Panam Salud Publica 44, 2020 | www.paho.org/journal | https://doi.org/10.26633/RPSP.2020.90                                                                                                                                           1
Original research Banerjee and Nayak • Analysis of social distancing in the United States
closures could lower the peak mortality of influenza pandemics Agriculture Economic Research Service, Rural-Urban Contin-
[6]. The objective was to analyze different measures of social uum Codes [12].
distancing using consumer movements from their home cen-
sus blocks and to their work census blocks. This generated a Inclusion and exclusion criteria
good measure of social distancing for populations in the United
States by each county for the last two months and allowed us to We dropped duplicate observations from counties in Wyo-
analyze the effects of the COVID-19 lockdown measures across ming and some counties from Alaska for which county
and within these counties. information was not available for any other data sources. We
also dropped one single FIPS code for which there was some
problem with data collection reported by Safegraph. Median
MATERIALS AND METHODS distance traveled from home is measured in meter and excluded
zero values.
Data
We connected several databases to create a complete data- Variable construction
base for our model design. Social distancing measures were
created from Safegraph [7] “social distancing” database. Safe- We used the daily census block-level database to create daily
graph’s unique database provides daily mobile devices data county level data. For the Completely_home_devicesit and Full_
for the U.S. and Canada. This database is collected by census time_workit variables for the county i on day t, we took total sum
block group level (12 digit FIPS codes). The period analyzed of the variables by the county level.
was from February 1, 2020 to March 31, 2020. The mobile device For both Median_home_timeit and Median_distance_traveledit
data tracks each consumer’s mobile device and provides raw variables we calculated the median weighted total number of
device counts. The population covered in the database, and in devices in the census block f for county i in t. We used STATA
this study, includes thousands of anonymous mobile devices’ function [aweight] in STATA16. Small geographical bias is pos-
customers from all across the U.S. states and territories. The sible as acknowledged by the data collectors. They tested the
number of total devices residing in homes in the census block reporting bias and calculated it to be less than one percent and,
by 12-digit FIPS code defines the total number of devices. Home therefore, the data is very accurate for this study. The weighted
is defined where the device spent last 6 weeks between 6 p.m. measures control for the effect of more populous counties.
and 7 a.m. The total number of devices that did not leave their Completely_home_devicesit, Full_time_workit, Median_home_
home location (geohash-7 measure) during the day defines the timeit and Median_distance_traveledit variables were our social
number of completely stay-at-home devices. distancing measures. That is, social distancing in this study
Full-time work location is specified if a device spent at least 6 was measured by what proportion of a county’s population is
hours a day between 8 a.m.- 6 p.m., at a location other than their staying home completely; how much time they were spend-
home location for at least 6 weeks. Total number of devices at ing indoors, versus outdoors, in public spaces like working
full-time work per day is provided by Safegraph. full-time, which is critical for this analysis. Further, we concen-
Next, we obtained information on distance and time spent trated on social distancing measures at individual county level
outside the home during the time. Median distance traveled because we matched the above social distancing measures with
from home is provided as the median distances travelled in county level COVID-19 infections data and NPIs data.
meters by the devices from the home locations within a day
(distances > 0). The database calculates the median across all Analysis design
of the devices (detailed description is available in [8]). Median_
home_timeit is presented in minutes for all devices included in The complete data is detailed enough to help us to measure
the total number of devices during the time period. Safegraph each consumer’s physical movement between counties and to
calculates this variable per devices by summing the observed different places of work. This allowed us to create a panel meas
minutes at home across the day. Then the database calculates ure of social distancing by each county and enabled to design a
the median of all these devices. difference-in-difference analysis of the impact of the lockdowns
We obtained county level non-pharmaceutical intervention on the rate of spread of COVID-19 after controlling for all county,
(NPIs) data from New York Times “See Which States and Cities time and county-time fixed effects. Difference-in-difference
Have Told Residents to Stay at Home” and Keystone “County analysis estimates the effect of NPIs through social distancing
level COVID-19 Non-pharmaceutical Database” [9]. The NPIs for the counties where NPIs were enacted compared to non-
include local government imposed social distancing regula- NPIs enacted counties. Thus we were able to filter out many
tions, including social distancing regulations for vulnerable unknown factors present, such as the numbers of tests done,
persons, social distancing of the general population, gathering availability of local test centers, general difference in demo-
size limitations, closure of public venues, closure of schools graphic, and political and public health infrastructures across
and universities, non-essential services closure and lock down these counties, among others.
between January 21, 2020 and March 31, 2020. The NPIs data is All the counties with NPIs enacted between February 1 and
also defined by county. March 31, 2020 served as our treatment counties. If a county
County level COVID-19 infections data was obtained from did not have any NPI then we considered that as a sample in
the Centers for Disease Control and Prevention Coronavi- the control group. We created a dummy variable, NPIs, which
rus updates [10, 11]. The rural-urban characteristics of the equals one if county i ordered NPIs on, or after day t (where day
county was obtained from the United States Department of 1 starts February 1, 2020), and zero otherwise. Our treatment
2 Rev Panam Salud Publica 44, 2020 | www.paho.org/journal | https://doi.org/10.26633/RPSP.2020.90Banerjee and Nayak • Analysis of social distancing in the United States Original research
counties were in states including New York and California, that after controlling for county, state, time and county-time
which have been extremely affected by COVID-19. fixed effects, counties where NPIs were enacted, full time work
To analyze the effect of these social distancing measures on and distance-travelled-from-home increased the COVID-19
COVID-19 cases and how this effect is working on the treatment cases by 54% (p-value 0.001) and 13% (p-value 0.001), respec-
counties comparing to the control counties, we estimated the tively. This might be because the first counties to have enacted
following difference-in-difference (DID) model: an NPI are also those which were fast becoming the infection
hot spots, combining with an artefact of the nature of the con-
In(cases)it = a1NPIit + lXit + Ct + t + Ui + eit (1) tagion that it can start an infection as early as within hours of
contact. Column 2 of Table 2 shows that at the five-day lag of the
where t represents the day starting from February 1, 2020 and interaction variables, distance-travelled-from-home increased
i represents the county. The ln(cases) presents the natural loga- the COVID-19 cases by 16% (p-value 0.001). Full-time-work
rithm of the number of confirmed COVID-19 cases. We added variables after NPIs were imposed, were no longer significant.
one to the raw cases, before taking the logs, to control for zeros. This is an interesting finding, as it might indicate exposure to
NPIit is our treatment variable. NPIit is a dummy variable, which the risks from full-time work not being significant anymore,
equals one if the county imposed NPIs on or before date t, and as awareness of the virus increases, and most people who are
zero otherwise. The parameter a1 measures the average effect of sick are staying at home or quarantining. On the other hand,
NPIs for county i after it was imposed on date t. Xit is a vector distance travelled from home now might indicate visits to the
of interactions of the social distancing variables with the NPIs. stores and other points of interest where likely the virus was
The parameter l measures the mean effect of NPIs as a result of spreading through droplets found in the air, or the other forms
the social distancing in county i comparing to control counties. of spread discussed in the introduction.
We also included separate county, county-time and state fixed After running the regressions with more days of lags for the
effects in Ct, time fixed effect (t) and a binary factor variable Uit interaction variables, we found significant negative effects of
as the urban-rural dummy variable that is equal to one if the Time-spent-at-home at the fifteen-day lag for the counties with
county is an urban county. eit is the county and time specific NPIs, as well as significant positive effects of NPI*full-time-work
error term. and NPI*distance-travelled-from-home in the treatment counties
Time invariant factors of a county or state, including geo- compared to control counties. Time spent at home decreased
graphical variables, political outlook, local public health and COVID-19 cases by 49%, 15 days after NPIs were enacted
demographic differences, state infrastructure differences, etc., compared to control counties (column 3). After 15 days of
were controlled in our modelling design for by the county enactment of the NPIs, the effects of full time work and dis-
and state fixed effects. The time fixed effects captured the time tance travelled from home on COVID-19 infection increased to
varying pan-USA variables. More importantly, the county-time 84% and 25% (compared to 54% and 13% immediate effects).
fixed effects were included to take account for any local county We have repeated the estimation with further days of lags, and
level time varying factors, such as local temperature variances found similar results till the 17th day lag. But given that much of
as well as the number of test centers set up and the number of the NPIs were enacted towards the end of our sample period,
tests that were being administered, etc. As a further robustness means we lose samples very quickly and the significance of the
measure, we clustered the standard errors at the county level. estimates disappears after the 17th day.
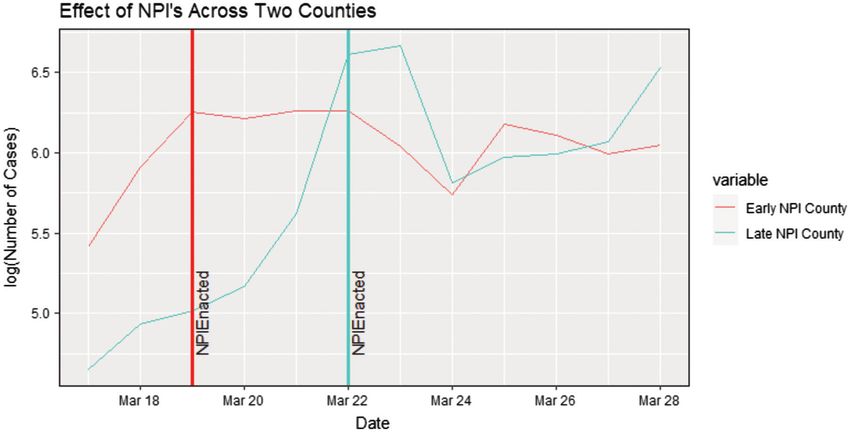
We re-estimated equation 1 with various lags. Figure 2 presents the effect on NPIs on the COVID-19 cases
across two counties. The red line presents the change in cases
RESULTS for the county (e.g., LA county, CA) where NPI was enacted
earlier and the blue line represents the change in COVID-19
We present the daily change in the natural logarithm of the cases for the county (e.g., Jefferson county, AL) where NPI was
confirmed number of cases [ln(cases)], daily number of com- enacted later in the March.
pletely stay at home devices and daily median time spent at
home (minutes) for each day during the duration of our study, DISCUSSION
in Figure 1 (A, B and C). Figure 1A shows the highest affected
states from the database, and it represents a sharp increase in COVID-19 has quickly made us realize that each of us, as
the number of cases after March 4, 2020 with California and socially responsible agents, have a major role to play in this dif-
New York seeing the highest number of cases. Figure 1B depicts ficult time. Yet, we also realize that we know very little about
that, in these highly affected states, there was a sharp increase the nature of the control of the COVID-19 so far within the U.S.
in percentage of devices stationed completely at home after and globally. Active research is going on around the world to
March 15, 2020 and people started spending more time indoors find a cure and vaccination for this deadly virus. However, it
after March 17, 2020. Together, figures 1B and 1C show that an will probably be months before we could see any viable and
increasing number of people started spending extended times effective vaccine for the COVID-19. Therefore, understanding
at home after March 11. California observed the highest num- the control measures of the viral disease is the most important
ber of people staying at home till the 3rd week of March, but question for the world at this current time. Non-pharmaceuti-
after that New Jersey was the state leading this measure. Table 1 cal control measures against infectious diseases have been used
presents the summary statistics of all the variables for all coun- throughout mankind’s documented history. These measures
ties and also by treated and control groups. have included school closure, as discussed and implemented
As noted above, we estimated equation (1) with the right for seasonal influenza pandemics [6]. The earliest literature
hand side treatment and interaction variables included at t, with studying the combined effect of quarantine, school closure,
a five days’ and a fifteen days’ lag. Column 1 of Table 2 shows and workplace distancing on COVID-19 infections include the
Rev Panam Salud Publica 44, 2020 | www.paho.org/journal | https://doi.org/10.26633/RPSP.2020.90 3Original research Banerjee and Nayak • Analysis of social distancing in the United States
FIGURE 1. (A) COVID-19 cases in natural logarithms (B) Proportion of population completely staying home (Represented here
at state level for graphing. Analysis at the county level) (C) Median time spent at home (aggregated to state level for graphing.
Estimation done at the county level)
A
B
C
4 Rev Panam Salud Publica 44, 2020 | www.paho.org/journal | https://doi.org/10.26633/RPSP.2020.90Banerjee and Nayak • Analysis of social distancing in the United States Original research
TABLE 1. Statistics summary of all variables
All counties Treated Counties Control Counties
Mean S.D. Mean S.D. Mean S.D.
COVID-cases (number) 2.92 8.40 38.57 8.52 1.95 8.30
Completely-stay-at-home 24.02 7.70 24.38 8.25 24.01 7.68
(number of devices)
Distance-traveled-from-home 29082.22 5459.11 17666.88 13018.8 29395.60 5534.98
(meter)
Full_time_work (number) 17.76 4.89 17.38 4.73 17.77 4.89
Median_home_time (minute) 644.68 365.10 718.15 446.69 642.66 362.39
Total Observations 177029.00 4332.00 172697.00
Note: Table 1 presents the summary statistics of different social distancing measures using the Safegraph data.
TABLE 2. Efffect of social distancing on daily COVID-19 cases is disaggregated and an advancement over the literature which
reported shows that social distancing, has a negative effect on the COVID-19
spread for the US population at the aggregate level [16].
Dependent Variable This study had some limitations. Not all population use cell
Natural log of Daily Confirmed COVID-19 Cases by County phones, and the social distancing data is collected from the cell
Unlagged 5-Day Lag effect 15-Day Lag effect phone data by Safegraph. A new survey conducted by the Pew
(1) (2) (3)
research center shows that 95% the U.S. population own some
kind of a cell phone and 81% own a smartphone [17]. However,
NPIs -0.52*** -0.03 -0.03***
the sample do not represent 100% of the population and if the
(0.09) (0.01) (0.01)
cell phone is switched off when the person is at home or goes
NPIs*Completely Home 0.54 0.49 -0.15 out of the house for a short duration and the cell phone does not
Devices
ping, then the observation will be missing from the database.
(0.94) (0.96) (0.215)
Given the vast coverage of the data, we are not concerned that
NPIs*Time Spent at Home -0.08 -0.19 -0.49***
the results will be influenced with this small bias. In future stud-
(0.12) (0.14) (0.03)
ies, it will be interesting to include additional measures of social
NPIs*Full-time work 0.54*** 0.27 0.84*** distancing by the points of interest visits and the durations of
(0.16) (0.18) (0.02) these visits by consumers. For example, the visit to the grocery
NPIs* Distance Travelled 0.13*** 0.16*** 0.25*** store, shopping malls, commercial establishments, airports or
From Home
other locations affects the COVID-19 infections differently. This
(0.01) (0.01) (0.00)
is outside the scope of this paper but, if undertaken, this analy-
Day Fixed Effects Yes Yes Yes sis will provide a complete picture of how social distancing in
County Fixed Effects Yes Yes Yes different segments of the economy is affecting the public health.
State Fixed Effects Yes Yes Yes
County day Fixed effect Yes Yes Yes Conclusion
Observations 1,77,029 1,44,551 80,315
Note: Table 2 presents the effect of social distancing on log(COVID cases) by county. Explanatory variables are the
interaction variables. Robust standard errors are shown in the parenthesis. ***, **, and * denote 99%, 95%, and
This paper analyzes the U.S. consumers’ decisions to adhere
90% levels of confidence. to the social distancing regulations and the effectiveness of
NPI, non-pharmacological interventions
social distancing on COVID-19. As people stay at home it can
reduce the spread of the virus by 49% after two weeks of the
cross-country study [13] and a study based specifically on Sin- social distancing decision, and as people start working full-
gapore [14]. Both these studies found a negative effect of NPIs time it increases the spread of the virus by 84% within two
on COVID-19 infections. China also proved that aggressive quar weeks. This result is close but more accurate to the prediction
antine measures can reduce the spread of the virus, but literature in the literature [18] that school closure and other NPIs reduce
[15] suggests that the same mechanism might not work for the COVID-19 cases by 60%. We conclude that as people spent
other countries. Therefore, the estimation of the effect of NPIs more time at home; did not work full-time; and, traveled less
through social distancing for the U.S. offers crucial insights. distance from home it reduced COVID-19 infections for the
The U.S. is currently facing an increasing threat of infection, county with about a two weeks lagged effect. Social distancing
combined with the dilemma of the process of reopening the is important in controlling the infections and it is important to
economy and risking thousands of lives to COVID-19 infections. encourage these non-pharmaceutical intervention within each
This paper contributes to this pandemic literature by analyzing county.
the exact lagged effect of the social distancing on the COVID-19
spread in the U.S. population. The novelty of the study is that it Author contributions. TB received the original data. TB and
analyzed the U.S. populations’ social distancing decision at the AN planned the analysis, analyzed the data and interpreted
individual consumer level and estimated the impact of social the results. TB and AN wrote the paper. All authors critically
distancing on the COVID-19 spread for the county. This analysis revised the paper, reviewed and approved the final version. The
Rev Panam Salud Publica 44, 2020 | www.paho.org/journal | https://doi.org/10.26633/RPSP.2020.90 5Original research Banerjee and Nayak • Analysis of social distancing in the United States
FIGURE 2. Effects of non-pharmacological interventions (NPI) across two counties with different NPI dates.
datasets used and/or analyzed during the current study are Conflicts of interest. None declared.
available from the corresponding author on reasonable request.
Acknowledgments. We thank Safegraph for generously pro- Disclaimer. Authors hold sole responsibility for the views
viding the social distancing metrics database for this analysis, expressed in the manuscript, which may not necessarily reflect
and Dr. Aditi Sengupta and Dr. Ayanangshu Nayak for their the opinion or policy of the RPSP/PAJPH and/or the Pan
helpful comment on an earlier version of the manuscript. American Health Organization (PAHO).
REFERENCES
1. Centers for Disease Control and Prevention. How COVID-19 Spreads. 12. United States Department of Agriculture Economic Research Ser-
Availablefrom:https://www.cdc.gov/coronavirus/2019-ncov/prevent- vice, Rural-Urban Continuum Codes. Available from: https://
getting-sick/how-covid-spreads.html. Accessed on March 10, 2020. www.ers.usda.gov/data-products/rural-urban-continuum-codes.
2. Di W, Tiantian W, Qun L, Zhicong Y. The SARS-CoV-2 Outbreak: aspx. Accessed on March 30, 2020.
What We Know. Int J Infect Dis. 2020 March; 94:44-48. 13. Dursun D, Enes E, Behrooz D. No Place Like Home: A Cross-National
3. Yang J, Zheng Y, Gou X, Pu K, Chen Z, Guo Q, Ji R, Wang H,Wang Assessment of the Efficacy of Social Distancing During the COVID-19
Y, Zhou Y. Prevalence of comorbidities in the novel Wuhan corona- Pandemic. JMIR Public Health Surveill. 2020 May 20. Available from
virus (COVID-19) infection: a systematic review and meta-analysis. https://preprints.jmir.org/preprint/19862/accepted.
Int J Infect Dis. 2020 May; 94:91-95. 14. Koo JR, Cook AR, Park M. Interventions to mitigate early spread of
4. Stephen SM. Global Infectious Disease Surveillance And Health COVID-19 in Singapore: a modelling study. Lancet Infect Dis. 2020
Intelligence. Health Aff. 2007; 26(4):1069-77. March.
5. Baldwin R, Mauro WB. Economics in the Time of COVID-19. 2020 15. Kupferschmidt K, Cohen J. China’s aggressive measures have
March. Available from https://voxeu.org/content/economics-time- slowed the coronavirus. They may not work in other countries.
covid-19. Science. 2020 March. Available from: https://www.sciencemag.
6. Alexandra MS, Martin SC, Howard M. Closing The Schools: Lessons org/news/2020/03/china-s-aggressive-measures-have-slowed-
From The 1918-19 U.S. Influenza Pandemic. Health Aff. 2009;28. coronavirus-they-may-not-work-other-countries.
7. Safegraph. https://www.safegraph.com/. 16. Charles C, Joseph G, Anh L, Joshua P, Aaron Y. Strong Social Dis-
8. Safegraph detailed data manual. Available from: https://docs.safe- tancing Measures In The United States Reduced The COVID-19
graph.com/docs/social-distancing-metrics. Accessed on March 1, Growth. Health Aff. 2020 May.
2020. 17. Mobile fact sheet. https://www.pewresearch.org/internet/fact-
9. The New York Times Coronavirus stay at home order. Available from: sheet/mobile/. Accessed on March 30, 2020.
https://www.nytimes.com/interactive/2020/us/coronavirus- 18. Roy M A, Hans H, Don K, Déirdre HT. How will country-based mit-
stay-at-home-order.html?auth=login-google. https://www.keystone igation measures influence the course of the COVID-19 epidemic?
strategy.com/coronavirus-covid19- intervention-dataset-model/. Lancet. 2020 March; 395(10228):931-934.
Accessed on March 30, 2020.
10. Centers for Disease Control and Prevention. Coronavirus updates.
Available from https://www.cdc.gov/coronavirus/2019-ncov/cases-
updates/cases-in-us.html. Accessed on March 30, 2020.
11. USA facts, coronavirus location maps. Available from. https://
usafacts.org/visualizations/coronavirus-covid-19-spread-map/. Manuscript received on 23 April 2020. Revised version accepted for publication
Accessed on March 30, 2020. on 3 June 2020.
6 Rev Panam Salud Publica 44, 2020 | www.paho.org/journal | https://doi.org/10.26633/RPSP.2020.90Banerjee and Nayak • Analysis of social distancing in the United States Original research
Análisis a nivel de condado para determinar si el distanciamiento social
ralentizó la propagación de la COVID-19 en los Estados Unidos
RESUMEN Objetivo. Analizar la efectividad del distanciamiento social en los Estados Unidos.
Métodos. Se empleó un método novedoso de contacto con teléfonos celulares (ping) para cuantificar las
medidas de distanciamiento social de todos los condados de EE.UU.
Resultados. Usando un enfoque de diferencia en diferencias los resultados indicaron que el distanciamiento
social ha sido efectivo para reducir la propagación de la COVID-19.
Conclusiones. A medida que los responsables de la formulación de políticas se enfrentan a la muy difícil
cuestión de la necesidad y la eficacia del distanciamiento social en Estados Unidos, los condados en los que
se han impuesto las políticas han aumentado efectivamente el distanciamiento social y en ellos se ha enlen-
tecido la propagación de la COVID-19. Estos resultados pueden ayudar a los responsables de las políticas a
hacer comprender a la población los riesgos y beneficios de las restricciones.
Palabras clave Coronavirus; pandemias; conducta social; cuarentena; Estados Unidos
Rev Panam Salud Publica 44, 2020 | www.paho.org/journal | https://doi.org/10.26633/RPSP.2020.90 7You can also read