Supplement V Case Study Explorations
←
→
Page content transcription
If your browser does not render page correctly, please read the page content below
Investigating the Undetected Early European Covid-19
Outbreak between December 2019 and February 2020 and
the Failures of Public Policy to Manage the Epidemic

May 2020

By Prof Dr Peer Ederer
Global Food and Agribusiness Network

The author can be contacted on Linkedin
All documentation can also be accessed on the author’s homepage
www.foodandagribusiness.org

Supplement V
Case Study Explorations
Case Study #1: The super-spreader event of Mitterteich Festival in Tirschenreuth county

Tirschenreuth is a remote part of Germany, bordering the Czech Republic in the northeastern
corner of the State of Bavaria. It is among the most rural places in Germany. With 67 inhabitants
per sqkm, it is the least populated county of Bavaria, one third of the Bavarian average and one
fourth of the German average. Out of 401 German counties it ranks #17 in lowest population
density 1. The nearest city with more than 100,000 population, Regensburg, is more than one
hour away by car. The county has 72,504 inhabitants and its capital has 8,707 inhabitants. The
population has been steadily shrinking since years 2, and more than half of the population is
older than 50 3. GDP per head is 25% below the Bavarian average 4. 33% of its households are
couples with children, compared to the German median of 26.8%. 13.3% of its households
have a senior living with younger generations, compared to a median of 9.7% for Germany.

Tirschenreuth Landkreis is the strongest infected county in Germany and one of the strongest
in all of Europe. Its confirmed rate of infection per capita is 8 times the German average, 5
times the Bavarian average, and more than twice the next strongest infected region in
Germany, Heinsberg (whose case study will be examined further below).

The likely super-spreader event which is partially responsible for this development is a
Starkbierfest (Strong Beer Festival) which was conducted in the city of Mitterteich, a local city
of 6,937 inhabitants, on Saturday, 07 March. The problem was first spotted 10 days later, on
17 March, when the number of confirmed covid-19 cases had suddenly risen to 47 cases in
the county, of which 25 came just from the city of Mitterteich. The first confirmed case in the
county was on 10 March. Authorities moved swiftly and put the city of Mitterteich under
quarantine as per Wednesday, 18 March. People were not allowed to leave their house unless
for urgent requirements, and nobody was allowed to enter or leave the city unless for work
(this preceded the German wide contact ban and Bavarian quarantine by 5 days).

The city also immediately formed a task force for tracing the infection chain and hired two
epidemiologists for this purpose. While the hypothesis focused quickly on the Starkbierfest, a
definitive link could not be drawn, and the results of the task force has not been made public
(may be there are no results). The mayor of the city said on 19 March, that he personally knew
half of the 25 infected people in Mitterteich, and none of them had visited the Starkbierfest 5.
At any rate, there is no other contender for being a super-spreader event. In the effort to contain
the spread of the disease, authorities claimed to attempt as much testing as they could, with
additional 40 persons working in the local public health authority (Gesundheitsamt) 6.

None of the measures were successful in containing the epidemic progression throughout the
wider region. By 22 April, the county of Tirschenreuth had 1069 cumulative confirmed cases.
The two neighboring counties of Neustadt and Wunsiedel had 730 and 690 confirmed cases
respectively, making them the second and third most infected counties per capita in Germany
after Tirschenreuth. By comparison, the city of Frankfurt am Main with ten times more
inhabitants as Tirschenreuth, likewise had 1105 confirmed cases on April 22. The two
neighboring counties also had local Starkbierfeste, but not on the same large scale.

The Tirschenreuth outbreak is deeply mysterious. A map of Germany shows how the epidemic
progressed in a radius of 100 kilometer around Tirschenreuth county, leading to far above
average infection rates in what is the rural community dominated region of Upper Palatinate of
Bavaria. As per 22 April, that macro-region with 1.3 million inhabitants was three times more
infected than the German average. This spread happened almost entirely throughout the
lockdown and quarantine periods. The map also shows, that in the four regional urban centers

                                             2    SV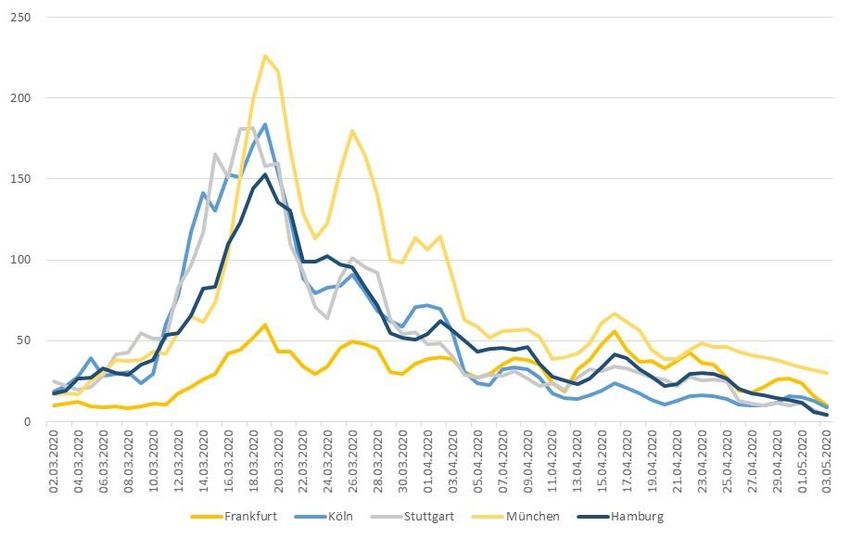
in this area, the cities of Weiden, Amberg, Bayreuth and Hof, the infection rates are lower by
one third than in their surrounding countryside. Clearly, this outbreak was driven by rural
dynamics, not by urban ones. But which ones?

Figure S V a): Map of Germany with counties shown by infection incidence

Source: RKI Dashboard

Moreover, observers of the Starkbierfest believe that its 1400 visitors were mostly younger
compared to previous editions 7. Apparently, the middle- and old-aged potential visitors had
already decided not to attend due to the corona news situation in the beginning of March. Until
April 22 there are 93 death cases in the county (119 as per 06 May). That gives Tirschenreuth
a death rate per 100,000 population of 129, which is 21 times more than the German average
of 5.9, and even higher than Italian Lombardy. At the end of April, Lombardy had a death rate
of 113 8, which in itself was six times higher than the Italian average. The covid-19 affected
population in Tirschenreuth is older than the average German affected population. If the
demographic of the confirmed cases is adjusted to the average German age profile, then 58
deaths would be expected, which is still a high number. At any rate, if the affected persons are
older than usual, how were they infected by the crowd at an event which was mostly young?

The high rate of confirmed cases is not due to possibly increased rates of testing in the county,
resulting from the early attention which authorities paid to the situation, and as was suggested
by the authorities. On the contrary, the death-incidence and age-adjusted identification rate
(CDAIR) is only 4.8%, around half of the German average rate. In the two neighboring counties
as well, the CDAIR is only 6.9 and 7.4%, respectively 20% and 14% below the German average,
suggesting a low discovery rate of the actual cases. Whatever was the testing strategy of the
local authorities in Tirschenreuth, it did not succeed to identify the real infection rates.

                                            3    SV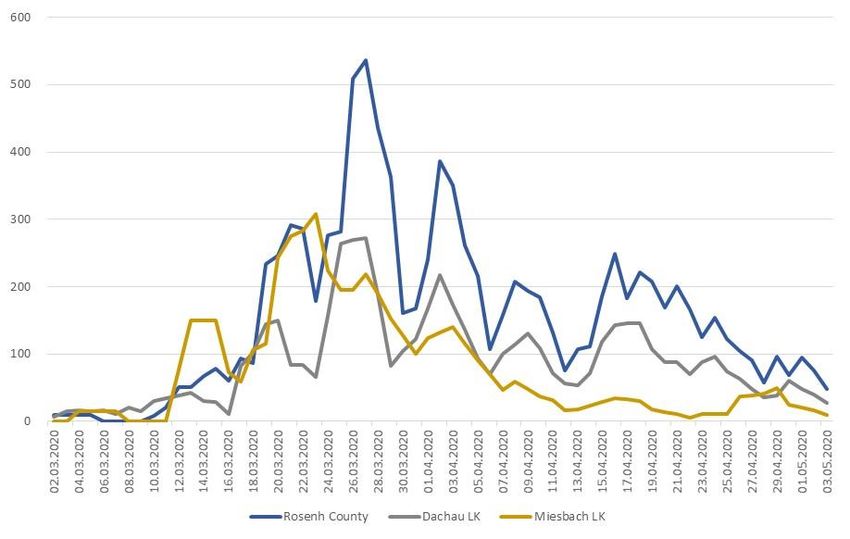
Figure S V b): Tirschenreuth county new real case infections per day
Unit of y-axis is cases per day per 100,000 inhabitants. Scale is up to 1400 !

Source: calculations for this article

The German-wide death-incidence and age-adjustment factor (DAF) yields that
Tirschenreuth’s new real case numbers doubled to about 800 per day from 20 March onwards
(Figure S V b). Until then the county had accumulated a total of 3200 infections. If anything,
the German-wide DAF underestimates the Tirschenreuth experience, because of
Tirschenreuth’s low CDAIR. The rate of 800 cases per day continued for another two weeks
days until Thursday 03 April, for a total of around 12,000 cases, before then dropping of rapidly.

These numbers indicate that a lot more super-spreading must have happened before and
parallel to the Starkbierfest. While the timing of the surge in cases matches to the Starkbierfest
(around two weeks later), the numbers do not. If the 12,000 cases represent three infection
generations, then there would have been 4000 people who became infected on the weekend
of the Starkbierfest, followed by two infection cycles with an Rta of 1 each. But there were only
1400 visitors at the Starkbierfest. This is also corroborated by what the mayor said, that of the
infected people he knew, none had been at the Fest.

One possible answer is that the DAF factor is not correct for Tirschenreuth county, and that
the infection fatality ratio (IFR) is much higher than the 0.41% taken from the Heinsberg county
case study, or the similar 0.4% which is estimated by the U.S. CDC (see main report Section
2.3 and Supplement II). Even if this would be the case, then it would still indicate an
extraordinary amount of infection activity, and then this would raise the additional question why
the IFR should have been so abnormally high in this county?

In total the DAF method estimates that there would have been 22,000 infections until 22 April
or a total infection rate of around 30% in Tirschenreuth county. In the beginning of May, it was

                                                      4    SV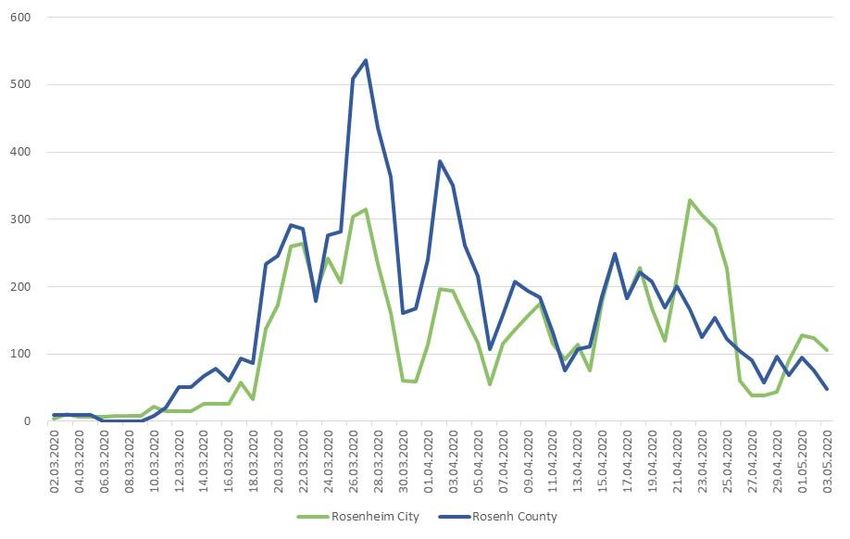
announced that a representative antibody test study would be conducted in the county 9. As of
writing of this article, it had not yet started, so the results will still take a while to arrive.

Any further speculation on what happened in Tirschenreuth will have to wait for the results of
the antibody test study. But whatever the results are, the Tirschenreuth raises several
disturbing questions. If the Starkbierfest was a super-spreader event, how was it to seemingly
infect almost every attendant in the course of just a single evening? Besides this event, there
was massive infection activity going on in the county, even throughout the quarantine periods.
Why was the outbreak so infectious in this county? Why was the fatality so high? Where did all
the cases originate from that were there already before the Starkbierfest? It seems nearly
impossible that exclusively an airborne transmission route was responsible for the massive
Tirschenreuth outbreak.

Case Study #2: The super-spreader event of Kupferzell trombones in Hohenlohe
Landkreis (county)

The Hohenlohe county is also a rural dominated county with 112,100 inhabitants, in the state
of Baden Wuerttemberg. Its population density of 144 inhabitants per sqkm, is less than half
the average in the state. Its confirmed case load of 666 per 100k makes Hohenlohe county the
sixth highest affected county in Germany. Its confirmed positive numbers are 722 cases until
April 25.

The first case in Hohenlohe was confirmed on 05 March. Between Thursday to Saturday, 12-
14 March a first peak of 38 cases was confirmed. Until then there was a total of 10. Five days
later, during a second peak from 17-20 March a further 158 cases were newly confirmed, and
again a week later a third peak followed with 142 cases between 26-29 March.

As per 24 March, 60% of all confirmed cases were concentrated in just 2 out of 16 communities:
74 confirmed cases in the city of Kupferzell (population 5,850) and 92 cases in the city of
Pfedelbach (population 8,926), for a total of 166 out of 279 cases. All other 14 communities in
the county reported infections mostly only in the single digits 10. This directed the attention of
the authorities towards an event which happened on Sunday, 01 March in the church of
Kupferzell, which was a trombone choir concert, where both the trombones of Kupferzell and
Pfedelbach were playing. It appears plausible that most of the 38 cases from the first peak on
12+ March infected themselves on this 01 March, and that the subsequent peaks on 17+ March
and then 26+ March, were two subsequent generations of this infection chain.

The DAF (Supplement II b) for 12 March is around 30, which would mean that these 38 cases
actually represent more than 1000 infections for 01 March. On the arbitrary assumption that
accessibility to testing in Hohenlohe may have been better compared to average Germany,
and therefore taking a DAF of just 10, would still indicate 300 to 400 infections on or around 01
March. The church in Kupferzell holds only 380 places11, and it is not even clear whether all
seats were taken. This would assume that each and every attendant to the concert was
infected. Moreover, it was a church concert, and not an alcohol-laden festival as in Mitterteich.

Attempts by the authorities to clarify the Kupferzell outbreak were not successful yet. This is
almost certainly due to the fact that only symptomatic cases were pursued, while antibody
testing to trace the overall infection rates have not yet been conducted. An antibody testing
campaign has been announced to take place in June 12.

                                             5   SV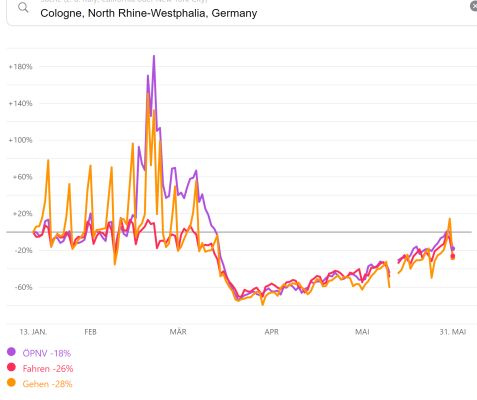
There are by now several documented case studies proving that singing and chanting is a
highly infectious activity. For instance, during a choir rehearsal on 06 March in Mount Vernon
in Washington State, 45 out of 60 participants became infected, despite using hand sanitizers
and keeping distances 13. Playing a trombone by necessity means blowing air for an extended
period of time. A single trombone player will generate about half a cubic meter of air during
one hour of play. If this player was infected, this would mean half a cubic meter of an infectious
aerosol cloud. Possibly the choirs cross-infected themselves already before the concert during
rehearsals so that there were several infected but non-symptomatic players during the concert.
They could then generate with their trombones a considerable aerosol cloud of SARS-CoV-2
which during the concert might have dissipated throughout the church and thus infected every
participant. Possibly the air circulation of the church might have supported this. Even if this was
the case, it does not explain why the participants were so easily infected, when it otherwise
takes thousands of contact points for an infection to occur.

Just as with the Tirschenreuth county case, the Kupferzell outbreak is mysterious, and urgently
needs more data to clarify.

Case Study #3: Another super-spreading activity before the Mitterteich Starkbierfest ?

If the Kupferzell outbreak was due to trombones, then this could also be a partial explanation
for how a hall of 1400 participants in Mitterteich could become infected – namely via an aerosol
cloud generated by a large brass band. One of the major music acts during the Starkbierfest
was the Mitterteicher Stadtkapelle, a brass band with several dozen players. This brass band
was playing during the Grüne Woche in Berlin on 24-26 January, on three evenings for two
hours each in the Bavaria Hall 14. Grüne Woche is an annual international food festival in Berlin
which draws 400,000 visitors from around the world. Possibly some of the Munich-based
infection chains crossed over to the Stadtkapelle during this event.

Another candidate for infection would be a carnival event in Mähring15 on 16 February, for
which the Mitterteich brass band was playing. Individual members may have infected
themselves there and then spread it around during rehearsals before playing the Starkbierfest
on 07 March. Mähring has a population of just 1,776, and if only a few persons had been
infected it might have gone unnoticed. Another candidate is that one or more members of the
brass band went on winter vacation in February and in this way brought the disease into the
band, and from there to Mitterteich. At any rate, this is only a hypothesis to partially explain the
mystery of the Mitterteich outbreak, which could be verified with antibody tests on the brass
band players. It might also never be resolved.

There is yet another aspect to the Mitterteich mystery. Data published in late April from the
local county statistics office, show that in Tirschenreuth county 146 people died during March
2020. The five-year average March from 2014 to 2019 was 94 people, ranging from 87 to 107.
While there is an excess mortality of 52 cases for March, there is a deficit mortality of 17 cases
for February versus the five-year average 16, in line with what would be expected due to the
mild influenza season. Officially there were 31 deaths reported to be due to covid-19 in March.

This would leave a potentially unexplained additional 21 deaths for Tirschenreuth county, for
which the registrations would need to have occurred at the latest until 17 March, and thus the
infections until 03 March. The IFR for that period are at or below 0.1% - so that there would
have accumulated well above 10,000 undiscovered infections throughout February until 03

                                              6   SV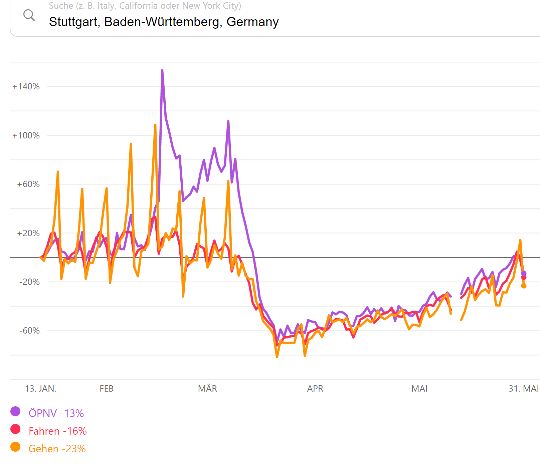
March. Such a strong background rate of infections might have provided the seed for the
Mitterteich outbreak, from where the case numbers then exploded.

This directs the attention to another possible super-spreading activity. On 29 January to 02
February, happened the worlds largest toy fair in Nuremberg, the capital city of Middle
Franconia, the neighboring region to Upper Palatinate. The fair is open to professionals only,
but still received 63,500 visitors 17. This was less than the typical 70,000 visitors which in press
reports was ascribed to the corona-crisis. Middle Franconia is the global center of excellence
in toy design and production, with global heavyweights such as Playmobil, Simba-Dickie or
Bruder residing in the area.

No infection has ever been linked to the toy fair. But apparently no investigation and
reevaluation has been undertaken either. For instance, two early known cases may shed some
light:

   a) On 27 February a man from Middle Franconia tested positive after he had contact with
      an Italian who later tested positive 18. The assumption was that this man infected himself
      with the Italian because at that time, Italy had gained notoriety for its shutdown of some
      villages in Northern Italy, but what if the infection was the other way around, and only
      became noticed because Italy was in the news of being a hotspot, while in reality,
      German Bavaria was more infected?
   b) On 28 February a man from Nuremberg needed to be hospitalized in Karlsruhe, while
      his family back home was also ill with respiratory symptoms. It is unknown where he
      became infected.

Possibly the Nuremberg toy fair was a local super-spreading event, then they would have found
a further super-spreading activity in Bavaria to start multiple infection chains. These were
communal and city elections which were held on 15 March. The election campaigns would
have required many small local events in restaurants in a widely dispersed fashion throughout
February – especially in rural dominated regions with traditional social structures.

Case Study #4: The super-spreader activities of winter vacationing in Southern Bavaria

The city and county of Rosenheim are in the South of Bavaria next to the Austrian border. The
city of Rosenheim has 63,324 inhabitants, and the surrounding county has 260,983 inhabitants.
After Tirschenreuth and its two neighboring counties, Rosenheim is the fourth most infected
county in Germany. The difference in the epidemic progression between Rosenheim City and
Rosenheim County is instructive (Figure S V c).

As Rosenheim evolved to become a heavily infected city and county, attention of the authorities
focused on a Starkbierfest which was conducted there from 06-08 March. It was supposed to
last until 22 March, but was cancelled from the 8th onwards. As in Mitterteich, on cue two weeks
later, the city of Rosenheim suddenly reported 43 infections, where until then it had only a total
of 7. The distribution of the epidemic progression is also similar to the county of Tirschenreuth,
with a sudden rise, a ten-day plateau with three infection generations and then a sudden drop
again. However, after the drop, Rosenheim maintained a constant rate of infections like most
other German cities (see case studies below).

                                              7   SV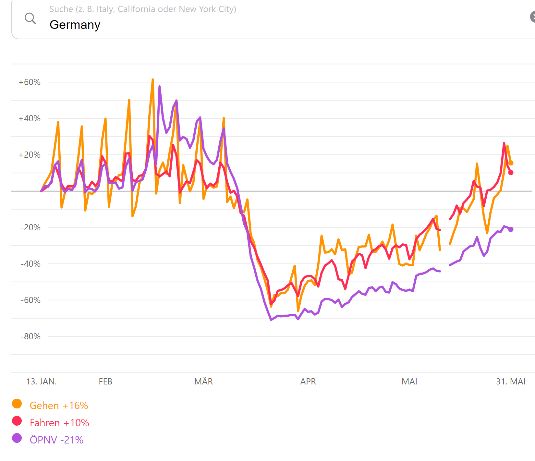
Figure S V c): Rosenheim city and county new real case infections per day
Unit of y-axis is cases per day per 100,000 inhabitants. Scale is up to 600 !

Source: calculations for this article

The authorities in Rosenheim tried to trace the infection chains with interviews, but by 22 April
could not come up with a link to the Rosenheimer Starkbierfest 19. Instead, a frequent pattern
among infected persons were visits to winter vacation areas. Also, according to the organizers
of the Starkbierfest and as per 31 March, there was not a single infection with covid-19 among
the service personnel 20. However, as the personnel is mostly young, they may have been non-
symptomatic, especially as the viral loads in the air may have been small, if it was not a person-
to-person infection but instead an infectious aerosol cloud as possibly was the case in
Mitterteich and Kupferzell. While the similarities to Mitterteich are striking, only an antibody test
among the service personnel would provide some proof to what degree the Rosenheimer
Starkbierfest was infectious.
Independently of the Starkbierfest, the tracing interviews point to a particularly dominant super-
spreading activity which have been confirmed in tracing activities all over Germany and
Europe, which were winter vacations and trips to the Alps. For instance, among the particularly
well traced population of Iceland, it was found that among the 115 covid-19 infected Icelanders
who had travelled abroad until 15 March, there were 97 who caught the disease in the Alpine
countries of Austria, Italy and Switzerland, most of them on winter vacations 21. They amounted
to almost two thirds of all infections registered in Iceland until 15 March.

Residents of counties in southern Bavaria are frequently visiting the Alps for skiing and
partying. Alpine weekends are part of the Southern Bavaria lifestyle, and are often the reason
for living close to the Alps to begin with. Rosenheim county shows a different epidemic
progression compared to Tirschenreuth and Rosenheim city. Instead of a plateau, the county

                                                      8    SV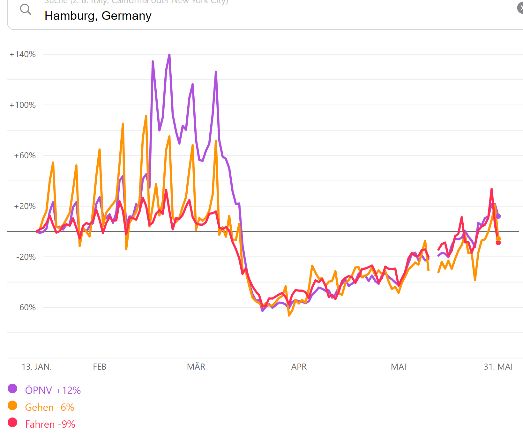
has a second peak on Friday March 27 which is about twice as high as the first peak. This
suggests a different dynamic.
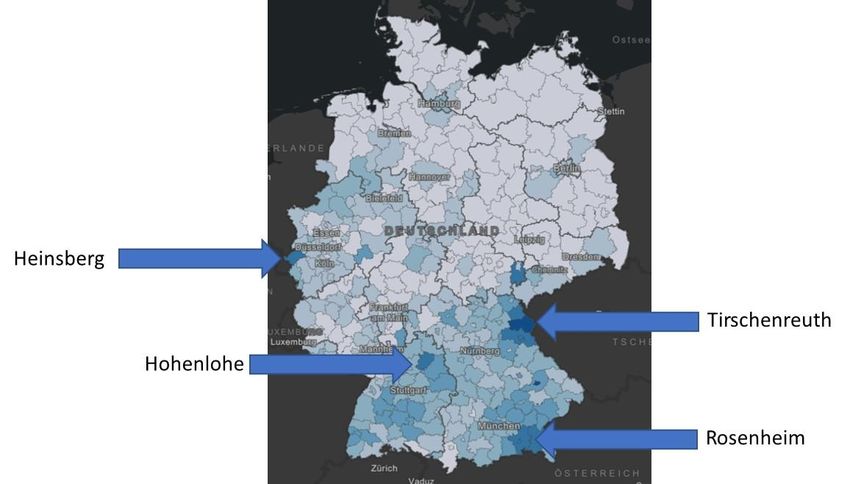
The weekend of 14-15 March was a brilliant time for skiing in the Alps. During the week there
had been new powder snow, while the weekend was mostly sunny. Moreover, both the Austrian
and German authorities had announced in the course of the Friday before, that all ski arenas
would be closed from Monday 16 March onwards because of the corona epidemic. The
weekend was the last chance of fun in the mountains. Two weeks later, several Southern
Bavarian counties surrounding Munich show the highest peak in their number of infections.
Figure S V d): Rosenheim, Dachau, Miesbach counties new real case infections per day
Unit of y-axis is cases per day per 100,000 inhabitants. Scale is up to 600 !
Source: calculations for this article
There exists a control group. In neighboring Switzerland a similar bundle of lockdown
measures as in Germany went into force on the same day, on 16 March. However, the
announcement to close the skiing arenas came on 13 March Friday afternoon, and went into
immediate effect, so the slopes did not open anymore on Saturday morning. As a result, in
Switzerland, the peak of case registrations in the typical cantons who are visiting the Alps on
the weekend, such as Zurich, was one week earlier compared to Southern Bavarian counties.
Case Study #5: The super-spreader event of Gangelt Carnival in Heinsberg county
The origin of Carnival is in the 40-day fasting period which the Catholic church observes before
Easter, and which starts on Ash Wednesday. The weekend before and until Tuesday before
Ash Wednesday developed into a celebration period of extensive partying, eating, drinking and
merry-making before fasting begins. With some odd exceptions, such as Swiss protestant
9 SVBasel Carnival which for unknown historical reasons is celebrated one week after Ash
Wednesday, Carnival is a purely catholic tradition.
For historical and political reasons stemming mostly from the 18 th century, Germany’s regions
tend to be either predominantly catholic or predominantly protestant. In everyday life the social
difference is not noticeable, except for one striking aspect: protestant regions do not celebrate
Carnival, while catholic regions do. However, not every catholic region celebrates carnival with
equal intensity. The region in Germany with the most extensive Carnival celebrations are in
North Rhine-Westphalia, and therein particularly the city of Cologne, which is world-famous for
its Carnival, on par with Rio de Janeiro, New Orleans and Venice. Cologne carnival draws 1.5
million visitors.
In 2020, the main Carnival days lasted from Thursday 20 February to Tuesday 25 February.
However, it has become common in many of the smaller surrounding cities to celebrate their
main Carnival event on the weekend before, in order not to collide with the super events at the
big cities, especially Cologne. In this way, Carnival de facto starts already with parties from 14
Friday onwards.
It was the main Carnival event of the relatively small town of Gangelt (population 11,634) in
semi-rural county Heinsberg to the West of Cologne, adjacent to the Dutch border, which
became Europe’s first documented super-spreader event – it was celebrated on 15 February.
Due to Gangelt, Heinsberg county developed into the fifth most infected county of Germany.
The event has been studied in great detail (see also Supplement II b), so it will not be recounted
here, except for noticing its progression.
The first infections became noticed on Thursday, February 27, twelve days after the Gangelt
Carnival. 14 cases were confirmed on that day in Heinsberg county, in addition to six from
previous days. Most of the cases could be linked to the Gangelt Carnival. By the end of the
weekend, the county of Heinsberg reported 68 cases, one week later until Sunday 08 March,
it reported 275 cases, accounting for two thirds of all cases in the state of North Rhine-
Westphalia.
Applying a DAF of 25 in the first days of March, yields around 6000 newly infected persons
during the two February weeks after the Gangelt Carnival, and an additional 6,000 cases
concentrated around Friday 05 March. This implies an Rta of around 2 from the first generation
of infections to the next, with the infections occurring on the main Carnival weekend of 22-23
February. It also makes the Heinsberg county outbreak similar in size as the Mitterteich
outbreak in Tirschenreuth county, and several times as large as the Rosenheim outbreak. The
Gangelt serological investigation yielded around 2000 infected persons for Gangelt at the
beginning of April, or 16% of the population 22. The DAF method suggests around 20,000
infected persons in the whole county of 254,000 inhabitants for end of April, or 8% of the
population.
This shows, that similar to Mitterteich city and Tirschenreuth county, there was more going on
in Heinsberg county, than just one super-spreading event in Gangelt. However, what it is that
is that was driving the infections, is still a mystery.
It would seem logical to assume, that this second peak of Heinsberg was related to further
carnival activity, possibly in the main city of Cologne which is only 75 kilometers away by car,
and which celebrated its festival from 20-25 February. However, that cannot be the case.
Despite its 1.5 million visitors and five days of non-stop partying and being a city with five times
10 SVmore inhabitants than Heinsberg county, Cologne registered only 27 infections until 08 March,
one tenth the count of Heinsberg. The infection does not seem to have spread from the
Heinsberg Carnival to the Cologne Carnival. The same is true for the two other German large-
scale Carnival events. Nearby Dusseldorf with 400,000 visitors reported 3 infections, and Mainz
with 500,000 visitors reported 2 infections until 08 March.
Another similarity between Heinsberg and Tirschenreuth county is that the epidemic profile is
roughly the same.
Figure S V e): Heinsberg and Tirschenreuth counties new real case infections per day
Unit of y-axis is cases per day per 100,000 inhabitants. Scale is up to 1400 !
Source: calculations for this article
Case study #6: The super-spreader activity of winter vacationing as shown by the cities
of Frankfurt, Cologne, Stuttgart, Munich and Hamburg
Carnival in the state of North Rhine-Westphalia has a traditional side effect – it causes the
second most important high season of winter sports in the Alps after the Christmas vacation.
Mid-February tends to have the best skiing conditions in the Alps. Snow will be plentiful, and
the days are getting longer again so that the slopes can be enjoyed better. As was explained
in the main report in Section 3.2.1, participation in winter vacationing differs widely among the
German states and cities. Munich and Stuttgart profit from the proximity to the Alps. Those in
Cologne who do not party in Carnival use the vacation days to go into the mountains instead.
Hamburg also has a well-established winter vacationing tradition. But Frankfurt does not. Figure
S V f) shows the effects of these lifestyle choices on the infection levels in these cities. Cologne,
Hamburg and Stuttgart spent time travelling in late February and early March (probably in the
Alps) and earned themselves a significant peak of infections two weeks later. Frankfurt, which
did not go winter vacationing, has no such peak. Munich which is closest to the Alps, has a
second peak corresponding to the final winter weekend on 14/15 March, similar to the South
Bavarian counties (Apple does not show transit data for Frankfurt and Munich).
11 SVFigure S V f): Frankfurt, Cologne, Stuttgart, Munich, Hamburg: new real case infections
per day
Unit of y-axis is cases per day per 100,000 inhabitants. Scale is up to 250 !
Source: calculations for this article; Apple mobility data
12 SVCase study #7: Regional differences within the Rhine Main Region in the cities of
Frankfurt, Wiesbaden, Mainz and Offenbach
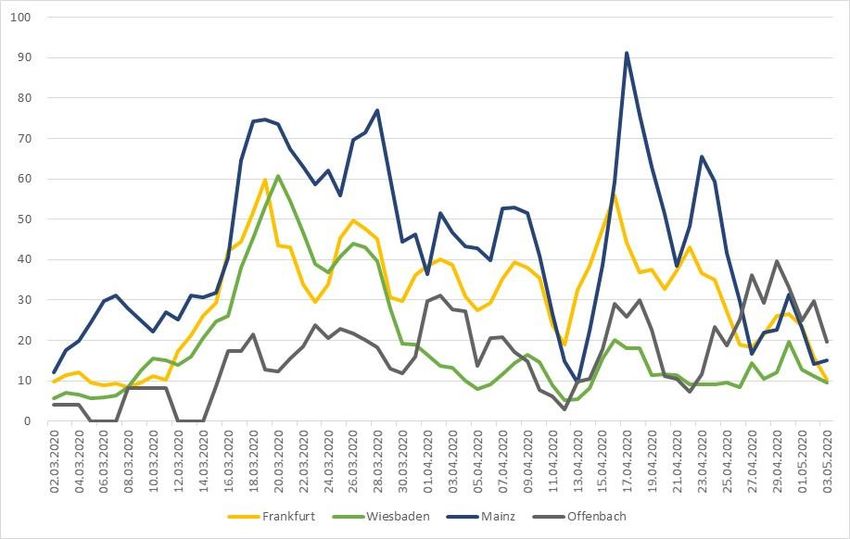
Even within the same metropole region of tightly interconnected cities such as the Rhein Main
Gebiet, where all cities are within 50 kilometers of each other and form a single socioeconomic
cluster, the infection levels vary widely. The city of Mainz is about twice as infected as the city
of Wiesbaden, even though they are twin cities next to each other, and both of them are capital
cities of their states respectively and are of the same size of around 250,000 inhabitants.
Offenbach which is the twin city of Frankfurt divided from it by the river Main, with 129,000
residents, is only one third as infected as Frankfurt, and is one of the least infected cities
anywhere in Germany. Not only the absolute infection levels, but also the progression dynamics
are different. While Frankfurt and Offenbach had low but constant levels of infections
throughout the entire study period of March and April, the city of Wiesbaden showed strong
declines, while Mainz showed increases.
The epidemic experience of these four cities show how the infection dynamics are mostly
determined by local factors.
Figure S V g): Cities of Frankfurt, Wiesbaden, Mainz and Offenbach and their new real
case infections per day
Unit of y-axis is cases per day per 100,000 inhabitants. Scale is up to 100 !
Source: calculations for this article
13 SV1
Destatis (Federal Office for Statistics of Germany; October 2019
https://www.destatis.de/DE/Themen/Laender-Regionen/Regionales/Gemeindeverzeichnis/Administrativ/04-
kreise.html
2
bayern Statistik
https://www.statistikdaten.bayern.de/genesis/online/data;jsessionid=E6517C470F1B67430B033EC3D0E3CCD1
?operation=ergebnistabelleUmfang&levelindex=2&levelid=1587892581333&downloadname=12411-001
3
Newspaper article in Die Zeit on March 20, 2020:
https://www.zeit.de/gesellschaft/zeitgeschehen/2020-03/mitterteich-ausgangssperre-coronavirus-
quarantaene-ansteckungsgefahr-deutschland
4
Oberpfalz in Zahlen, 2019
5
Newspaper article in Frankenpost on March 19, 2020:
https://www.frankenpost.de/region/bayern/Buergermeister-von-Mitterteich-appelliert-an-die-
Vernunft;art2832,7184150
6
https://www.otv.de/tirschenreuth-lage-in-der-coronakrise-bleibt-angespannt-425249/
7
https://www.n-tv.de/infografik/Infektionsherd-schlimmer-als-Heinsberg-Wie-das-Coronavirus-Bayern-
alarmierte-article21699081.html
8
https://www.thelancet.com/journals/lanpub/article/PIIS2468-2667(20)30099-2/fulltext
9
https://www.aerztezeitung.de/Politik/Antikoerper-Studie-im-Kreis-Tirschenreuth-mit-3600-Probanden-
409337.html
10
https://www.focus.de/gesundheit/news/hohenlohekreis-angesteckt-beim-posaunen-chor-der-deutsche-
corona-hotspot-den-kaum-jemand-kennt_id_11814262.html
11
http://www.kirchbau.de/php/300_datenblatt.php?id=2315&name=keiner
12
https://www.rki.de/DE/Content/Gesundheitsmonitoring/Studien/cml-studie/Dokumente/Studieninfo.html
13
https://kgmi.com/news/007700-mount-vernon-choirs-experience-offers-sobering-lesson/
14
http://www.stadtkapelle-mitterteich.de/?termine
15
https://www.onetz.de/oberpfalz/maehring/faschingszug-maehring-peta-greta-id2971613.html
16
https://www.t-online.de/nachrichten/panorama/id_87784410/uebersterblichkeit-so-viele-menschen-
starben-in-heinsberg-und-tirschenreuth.html
17
https://www.nordbayern.de/wirtschaft/coronavirus-weniger-besucher-auf-der-nurnberger-
spielwarenmesse-1.9790893
18
https://www.web24.news/a/2020/02/bavaria-also-reports-another-new-corona-virus-case.html
19
https://www.radio-galaxy.com/ist-das-rosenheimer-starkbierfest-fuer-die-hohe-zahl-an-corona-patienten-
verantwortlich-34629/
14 SV20
https://www.rosenheim24.de/rosenheim/rosenheim-stadt/rosenheim-ort43270/rosenheim-
zusammenhang-zwischen-starkbierfest-anfang-maerz-steigenden-corona-infektionszahlen-13634535.html
21
Gudbjartsson, Daniel F., Spread of SARS-CoV-2 in the Icelandic Population, New England Journal of Medicine,
April 2020
https://www.nejm.org/doi/full/10.1056/NEJMoa2006100
22
Hendrik Streeck et al: Infection fatality rate of SARS-CoV-2 infection in a German
community with a super-spreading event, University of Bonn in May 2020
https://www.ukbonn.de/C12582D3002FD21D/vwLookupDownloads/Streeck_et_al_Infection_fatality_rate_of_
SARS_CoV_2_infection2.pdf/%24FILE/Streeck_et_al_Infection_fatality_rate_of_SARS_CoV_2_infection2.pdf
15 SVYou can also read