Dynamics of human B and t cell adaptive immune responses to Kyasanur forest disease virus infection - Nature
←
→
Page content transcription
If your browser does not render page correctly, please read the page content below
www.nature.com/scientificreports
OPEN Dynamics of human B and T cell
adaptive immune responses
to Kyasanur Forest disease virus
infection
Santhosha Devadiga1,3, Anita K. McElroy2,3, Suresha G. Prabhu1 &
Govindakarnavar Arunkumar1*
Kyasanur Forest disease (KFD) is a tick-borne, acute, febrile viral illness endemic in southern India. No
major studies have been done to understand the adaptive immune response during KFDV infection in
humans. In this study, KFDV-positive patients were prospectively enrolled, and repeated peripheral
blood collections were performed. Clinical and virologic characterization of these samples is reported
along with phenotypic analysis of cellular immunity and quantitation of humoral immunity. We noted
robust T and B cell responses, particularly of CD8 T cells, during KFDV infection in most of the patients.
Virus clearance from the blood coincided with peak CD8 T cell activation and the appearance of KFDV-
specific IgG. Increased frequency of plasmablasts and very few activated B cells were observed in the
acute phase of KFD infection. Notably, only humoral immunity and activated B cell frequency in the
acute phase correlated with prior KFDV vaccination, and only with 2 or more doses. This novel work
has implications in KFD vaccine research as well as in understanding the pathogenesis.
Kyasanur Forest disease (KFD) is an emerging tick-borne viral disease known as “monkey fever” in the affected
regions of southern India. Kyasanur Forest disease virus (KFDV) was first described in 1957 in Shimoga district,
Karnataka (formerly Mysore) State, India1. Since 2012, several KFDV outbreaks have been documented in states
along the Western Ghat region of I ndia2,3. KFDV causes a severe febrile illness in humans and non-human pri-
mates. The estimated annual incidence of human KFD ranges from 100 to 900 cases, with overall case fatality rates
of 2–5%3,4. Clinically, KFD presents with sudden onset of fever, chills, severe frontal headache, and generalized
myalgia. Other symptoms include bradycardia, severe prostration, and conjunctival suffusion. Gastrointestinal
distress and signs of hemorrhage, such as bleeding from mucosal membranes, have been n oted3. Around 20% of
KFD cases may develop neurologic manifestations after 2–3 weeks of illness, including meningismus and altered
mental status, but rarely convulsion or loss of consciousness; no long-term sequelae are r eported3,5,6.
Despite KFDV’s high pathogenicity in humans, very little is known about the magnitude or quality of the host
immune response to infection. Currently, no specific anti-viral treatment is available for KFD. However, Karna-
taka State public health services, have been using a formalin-inactivated tissue culture-derived vaccine in KFD-
endemic areas since 1 9902,7, though reports on vaccine effectiveness are conflicting. A 2013 study demonstrated
that one dose of a formalin-inactivated vaccine does not protect against KFDV infection, but that vaccine efficacy
improved to 62.4% after 2 doses and 82.9% after 3 d oses8. Additionally, vaccine-induced immunity is short-lived;
a booster dose is recommended at 6–9 month intervals for 5 consecutive years after the last laboratory-confirmed
case in monkeys or humans or identification of infected ticks in the area7,8. Such follow-up doses are difficult
to achieve, thereby reducing actual effectiveness of the vaccine. However, no clear understanding exists of the
humoral or adaptive immune correlates of protection following KFDV vaccination. Defining the immune cor-
relates of protection will be important for developing more effective vaccines against KFDV.
To date, studies on the immune response against KFDV in humans have been limited to evaluating the innate
immune response. A previous study reported elevated levels of circulating type 1interferon (IFN-I) in acute KFD
1
Manipal Institute of Virology, Manipal Academy of Higher Education (Deemed To Be University), Manipal,
Karnataka State 576104, India. 2Department of Pediatrics, UPMC Children’s, Center for Vaccine Research,
University of Pittsburgh, Pittsburgh, PA, USA. 3These authors contributed equally: Santhosha Devadiga and Anita
K. McElroy. *email: arunviro@gmail.com
Scientific Reports | (2020) 10:15306 | https://doi.org/10.1038/s41598-020-72205-1 1
Vol.:(0123456789)
www.nature.com/scientificreports/
patients that correlated with viremia9. Increased levels of pro-inflammatory cytokines, mainly IL-6, IL-10, IFN-
alpha, and TNF-alpha, were noted during KFDV infection in the mouse m odel10. The present study focused on
characterizing the frequency and magnitude of various peripheral lymphocyte phenotypes during the acute and
convalescent phases of KFD illness in humans with or without a history of vaccination prior to KFDV infection.
Methods
Human subject research and biosafety precautions. Written informed consent was obtained from
all patients enrolled in the study. The protocol was approved by the Institutional Ethical Committee of Manipal
Academy of Higher Education (MAHEEC/003/2017). Specimen handling prior to inactivation was done in a
biosafety level 3 laboratory with enhanced precautions, including wearing personal air-powered respirators,
Tyvek suits, and double gloves. All the methods were performed following with the regional and national guide-
lines and regulations.
Study design and setting. Peripheral EDTA blood samples were obtained from 44 patients with KFDV
infection confirmed by KFDV-specific real-time PCR of serum. Patients were hospitalized at Sri Jayachamara-
jendra Government Hospital Thirthahalli (Karnataka), Community Health Centre Valpoi (Goa), Sub-District
Hospital Sawanthwadi, or Rural Hospital Dodamarg (Maharashtra) in 2017 and 2018. Patients not willing to
come for follow-up appointments and immuno-compromised patients were excluded. 85 blood samples were
collected at the acute (days 1 to 14 post onset) and 39 at the convalescent (days 15 to 79 post onset) phase of
KFD illness. Samples were transported under cold chain (2–8 °C) to Manipal Institute of Virology within 12 h
of collection.
Flow cytometry. T and B cell responses were measured using 8 different flow cytometry antibody panels
(see Supplementary Table 1 for detailed information on antibody reagents). One panel was designed for abso-
lute quantitation of total CD4 T, CD8 T, and B cells using Tru Count tubes [Becton Dickinson (BD), Franklin
Lakes, New Jersey, USA]. Three panels were used to measure naive, central, and effector memory populations of
CD4 and CD8 T cells and to determine the frequency of activated CD4 and CD8 T cells. One panel defined the
frequency of plasmablasts and activated B cell populations. Three panels were used to evaluate CD8 T cells for
proliferation, effector expression of cytotoxic molecules, and memory vs. naïve status. For phenotyping panels,
100–150 µL of whole blood was incubated with the surface stain antibody cocktail for 20 min at ambient tem-
perature (AT) followed by incubation in FACSlyse (BD) and 2 phosphate buffered saline (PBS) washes prior to
acquisition. For intracellular staining, cells were permeabilized using Cytofix/Cytoperm (BD) for 20 min at AT
followed by 2 washes with 1 × perm/wash (BD), and then stained with intracellular antibodies for 20 min at AT.
After 2 additional washes, data were acquired on an Accuri C6 flow cytometry analyzer (BD). Flow cytometry
data were analyzed using Flowjo (Treestar, Ashland, Oregan, USA) software. Representative gating strategy was
shown in supplementary Fig. 1.
Humoral immune response to KFDV. Anti-KFDV IgM and IgG antibody titers were determined by
ELISA using whole virus-infected cell lysates as antigen. Briefly, heat-inactivated (56 °C for 30 min) serum sam-
ples were tested in fourfold dilutions (1:100 to 1:6,400), and the assay was performed following the protocol of
the Centers for Disease Control and Prevention (CDC, Atlanta, Georgia, USA). A sample was considered posi-
tive for IgM if the sum of the adjusted optical densities (OD) of all the dilutions was ≥ 0.45 and the titer was ≥ 400.
Similarly, samples were considered positive for IgG if the sum for the adjusted OD of all dilutions was > 0.90 and
the titer was ≥ 1:400 as reported by Ksiazek et al. 1999 with modifications11. Raw data of ELISA at different dilu-
tions for the febrile and convalescent patients are provided in the supplementary Fig. 5.
Real‑time PCR for KFDV. RNA was isolated from plasma using a QIAmp Viral RNA Mini Kit (QIAGEN,
Hilden, Germany) as per manufacturer’s instructions. Real-time PCR with KFDV-specific primers was per-
formed as described elsewhere using the AgPath-ID One-Step reverse transcriptase PCR kit (Invitrogen, Carls-
bad, California, USA) in a Quantstudio5 real-time thermal cycler (Applied Biosystems, Foster City, California,
USA)12. Results were expressed as cycle threshold (Ct) value; this measurement of viral RNA is a correlate for
viremia, virus isolation was not attempted.
Data analysis. Data were recorded in MS Excel. Graphs were made using GraphPad Prism version 6.01 and
statistical significance was determined by one-way ANOVA followed by Tukey`s multiple comparisons test or a
Mann–Whitney test in the case of absolute acute versus convalescent cell numbers. Data on clinical, laboratory,
and epidemiological information were obtained from the Acute Febrile Illness (AFI) surveillance s tudy13. Vac-
cination status was self-reported.
Results
Demographic and clinical characteristics. Repeated samples were collected from a total of 44 KFD
patients during acute and convalescent stages of the disease. Additionally, 12 healthy subjects who were not pre-
viously vaccinated and had no symptoms of clinical KFDV infection were included to establish the population
normal range of cell phenotype distribution in the study population. Characteristics of the study population are
summarized in Table 1. Mean age of the study population was 40.9 years. Mean times post symptom onset at
which acute and convalescent samples were collected were 5.7 ± 2.7 and 35.7 ± 14.7 days, respectively. The most
common clinical features were fever (reported by 100% of patients) followed by myalgia (88.6%), headache
Scientific Reports | (2020) 10:15306 | https://doi.org/10.1038/s41598-020-72205-1 2
Vol:.(1234567890)www.nature.com/scientificreports/
H/O KFDV Vaccination
Variable Mean (SD) N (%) No (n = 22) Yes (n = 22) P value
Mean age in year 40.93 (13.1)
Gender
Male 18 (40.9) 11 7 0.3454
Female 26 (59.1) 11 15 0.4328
Hospitals
CHC Valpoi, Goa 23 (52.3) 15 8 0.1444
JCH Thirthahalli, Karnataka 13 (29.5) 2 11 0.0125
RH Dodamarg, SDH Sawanthwad, PHC Banda Maharashtra 8 (18.2) 5 3 0.4795
Socio economic status#
Low < 40 27 (61.3) 14 13 0.8474
Middle 40–70 17 (38.7) 8 9 0.8084
Clinical status (n = 44)
Fever 44 (100) 22 22 1.0
Myalgia 39 (88.6) 18 22 0.108
General weakness 37 (84.1) 19 19 1.0
Headache 37 (84.1) 20 18 0.664
Nausea 26 (59.1) 12 15 0.537
Cough 20 (45.5) 9 12 0.547
Vomiting 14 (31.2) 10 5 0.203
Diarrhoea 12 (27.3) 7 5 0.736
Altered sensorium and/or seizure 3 (6.8) 3 0 0.233
Hemorrhagic signs 1 (2.3) 1 0 1.0
Hypotension 18 (40.9) 9 11 0.763
Deceased 2 (4.5) 2 0 0.488
Laboratory features
Mean total leukocyte count/mm 3 (n = 41) 2,588 (1627) 2,339 2,825 0.345
Mean platelet count × 103/µl (n = 39) 124 (50) 104 139 0.031*
Aspartate aminotransferase IU/L (n = 25) 208.7 (338) 326 80 0.681
Alanine aminotransferase IU/L (n = 25) 102.6 (136) 147 54.6 0.907
Alkaline phosphatase IU/L (n = 23) 211 (92.9) 222.3 196.8 0.525
C-Reactive protein < 10 mg/dl (N = 24) 2.6 (2.2) 2.49 2.8 0.733
Mean duration hospitalization (days) (n = 43) 5.2 (2.7) 5.04 5.4 0.653
H/O of KFD vaccination
Unvaccinated 22 (50)
Vaccinated at least one dose 22 (50)
Vaccinated two/three dose 16 (36.4)
Table 1. Demographic, clinical, and laboratory characteristics of the KFD patients recruited in the study.
*Significant difference, #modified Udai Pareekh scale.
(84.1%), general weakness (84.1%), and nausea (59.1%). Relatively less common clinical features were vomiting
(31.2%), diarrhea (27.3%), altered sensorium and/or seizures (6.8%), and hemorrhagic manifestations (2.3%).
Of the 44 recruited patients with KFD, 50% received no KFDV vaccine, 50% had a history of at least one dose
of KFDV vaccine, 33.2% had 2 doses received 15 days to 13 months before KFDV infection. Two (4.5%) of the
infected patients died (Table 1). All the KFDV-infected patients were of low and middle socioeconomic strata,
and 21 (48.8%) were agricultural laborers.
Hematology and biochemical parameters. The most common hematological abnormalities were
marked leukopenia and thrombocytopenia. Overall leukocyte counts and platelet counts were low in all KFD
patients (Fig. 1A,B). Marked leukopenia was observed in majority of KFD patients, whereas 62.9% of patients
had thrombocytopenia in the acute stage. The median leukocyte count was 2,588 cells/µL (interquartile range
(IQR): 1,727–3,250) in acute samples and 5,100 cells/µL (IQR: 4,440–6,600) in convalescent samples. Median
platelet counts in acute and convalescent samples were 124,000/µL (IQR: 77,500–168,000) and 294,000/µL (IQR:
147,000–356,000), respectively. Peripheral leukocyte and platelet counts returned to normal during the conva-
lescent phase of KFD. Peripheral leukocyte counts of some patients with severe KFD were below 1,000 cells/
µL of blood. Peripheral neutrophil, lymphocyte, monocyte, and eosinophil counts markedly decreased during
acute KFDV infection and normalized by the convalescent period (Fig. 1C–F). Liver enzymes such as aspar-
Scientific Reports | (2020) 10:15306 | https://doi.org/10.1038/s41598-020-72205-1 3
Vol.:(0123456789)www.nature.com/scientificreports/
Figure 1. Kinetics of peripheral white blood cells and platelets during KFDV infection in humans. Line
represents mean. Statistical significance was determined by one-way ANOVA followed by Tukey’s multiple
comparisons test. Graphs were made using GraphPad Prism version 6.01.
tate aminotransferase (AST), alanine aminotransferase (ALT), and alkaline phosphatase (ALP) were moderately
elevated during acute KFDV infection (Table 1).
T cell responses during the acute and convalescent phases of KFDV infection. Absolute num-
bers of CD4 and CD8 T cells were reduced in most of KFD patients during the acute phase of illness, consistent
with the lymphopenia noted on routine hematology. Median absolute CD4 T cell numbers were 382 cells/µL of
blood (IQR: 244–571) in acute samples and 899 cells/µL of blood (IQR: 817–1,232) in convalescent (Fig. 2A).
Median absolute CD8 T cell numbers were 206 cells/µL (IQR: 106–344) in acute samples and 534 cells/µL (IQR:
376–730) in convalescent (Fig. 2B). The absolute number of CD4 and CD8 T cells returned to normal after the
first week of illness in most patients, correlating with viral clearance from the blood. Phenotypic characterization
of CD4 T cells showed a significant decrease in the frequency of naïve CD4 T cells and a concomitant increase in
the frequency of effector memory CD4 T cells in acute and convalescent KFD samples in comparison to controls
(Fig. 2C,G). Decreased frequency of central memory CD4 T cells was noted during the acute phase compared
to convalescent phase (Fig. 2E). Phenotypic characterization of CD8 T cells showed a significant decrease in the
frequency of naïve CD8 T cells, and a non-significant trend towards increased effector memory CD8 T cells in
acute and convalescent KFDV infection in comparison to controls (Fig. 2D,H). No significant differences were
noted in central memory CD8 T cells (Fig. 2F), or CD45RA + effector CD8 T cells (Fig. 2I).
Frequency of the activated T lymphocyte response was measured in all patients by analyzing co-expression
of the activation markers HLA-DR and CD38 on CD4 and CD8 T cells. Representative flow plots depicting peak
CD4 and CD8 T cell activation are shown (Fig. 2K,M). A significant increase in both activated CD4 and CD8
T cells was seen during acute KFDV infection compared to both healthy controls and convalescent patients
(Fig. 2J,L). Increased frequencies of Ki-67 on CD8 T cells, indicating active proliferation, were also observed
(Fig. 2N). There were no significant differences in T cell responses among vaccinated and unvaccinated KFD
cases and also among two deceased cases (Supplementary Fig. 2, 3).
Effector function characterization of CD8 T cells. CD8 T cells were further examined for expression
of two markers of cytotoxicity (granzyme B and perforin), two inhibitory markers that are upregulated upon
initial activation (PD-1 and CTLA-4), and CD45RA and Bcl-2, which would be low on effector T cells. The fre-
quency of granzyme B + , perforin + , PD1 + , CTLA4 + , Bcl-2low, and CD45RAlow CD8 T cells, and Ki67 + CD8 T
cells in acute and convalescent samples are depicted as compared to controls (Fig. 2O–T). Overall these data are
consistent with an increase in effector CD8 T cells during the acute phase of KFD, with increased effector marker
expression on cells that are also Ki-67 positive.
Scientific Reports | (2020) 10:15306 | https://doi.org/10.1038/s41598-020-72205-1 4
Vol:.(1234567890)www.nature.com/scientificreports/
Figure 2. T cell responses during acute and convalescent KFDV infection. Absolute numbers of CD4 and
CD8 T cells (A,B) (line refers to mean). Frequency of naïve, effector, and central memory CD4 and CD8 T cells
(C–I). Representative flow plots for activated CD4 (K) and CD8 (M) T cells in infected patients versus a normal
healthy control. Frequency of activated CD4 (J) and CD8 T cells (L). Frequency of proliferating CD8 T cells (N).
CD8 + T cells and Ki67 + CD8 T cells expressing effector and memory molecules: granzyme B, perforin, PD1,
CTLA-4, BCL-2, and CD45RA (O–T). Statistical significance was determined by one-way ANOVA followed by
Tukey`s multiple comparisons test. Graphs were made using GraphPad Prism version 6.01.
Scientific Reports | (2020) 10:15306 | https://doi.org/10.1038/s41598-020-72205-1 5
Vol.:(0123456789)www.nature.com/scientificreports/
B cell responses during the acute and convalescent phase of KFDV infection. Lower numbers
of absolute B cells were noted during acute KFD than convalescent, (n = 16) (Fig. 3A). Both plasmablasts (anti-
body-secreting cells) and activated B cells (ABCs) were measured using CD71 and CD20 markers on CD19 + B
cells. Representative flow plots depicting peak plasmablast and ABC frequencies are shown (Fig. 3B). Increased
frequencies of plasmablasts were observed in most KFD patients during the acute phase compared to both
controls and convalescent patients (Fig. 3C). Very few ABCs were observed in the acute phase, but significantly
increased during the convalescent phase of KFDV infection (Fig. 3D). Interestingly, no association was observed
between vaccination status and plasmablast response (Fig. 3E,F). However, patients who had received 2 or 3
vaccine doses had higher percentages of ABCs during the acute phase, though not the convalescent (Fig. 3G,H).
Humoral responses during the acute and convalescent phase of KFD infection. Antibody
responses among vaccinated and unvaccinated KFD patients and correlation of these responses with viremia
were evaluated. Individuals who received 2 or 3 doses of KFD vaccine had significantly higher acute IgM and
IgG titers than did unvaccinated individuals or those who only received one vaccine dose, consistent with the
expected rapidity and magnitude expected of a memory response (Fig. 3I–L). IgM response to KFDV was detect-
able as early as day 6 of illness and peaked 2–3 weeks after symptom onset. IgG response appeared on the 7th or
8th day of illness and peaked by the 2nd week. Virus clearance from the blood correlated with the appearance of
KFDV-specific IgG (Fig. 3M–O).
Viremia in KFD. KFDV was detectable in blood samples 1–12 days after symptom onset, with peak viremia
on day 3 to 4 of illness. Cycle threshold (Ct) values ranged from 16–33. Clearance of viral RNA among patients
who had received 2 doses of KFD vaccine occurred on average by day 6 of illness, although 2 of vaccinated
patients were viremic up to 12 days post symptom onset (Fig. 3M–O). We did not find any significant difference
in viremia periods observed among vaccinated KFD cases who developed IgG response very early in the course
of infection (Supplementary Fig. 4).
Discussion
This study reports a detailed analysis of longitudinal cellular and humoral immune responses to KFDV infection
in humans. We noted robust T and B cell responses, particularly of CD8 T cells, during KFDV infection in most
of the patients. Virus clearance from the blood coincided with peak CD8 T cell activation and the appearance
of KFDV-specific IgG. Significant CD8 T cell activation was noted during the acute phase of KFD, as has been
noted during infection or after vaccination with dengue, yellow fever, tick-borne encephalitis, Nipah, Ebola, and
Lassa viruses, among others14–19. Activated (Ki67 +) CD8 T cells expressed high levels of acute effector mark-
ers PD-1 and CLTA-4 and cytotoxic molecules such as granzyme B and perforin, as well as low levels of Bcl-2,
and CD45RA, suggesting that these effector cells were recruited from the naïve population via antigen-specific
activation.
Interestingly, the magnitude of plasmablasts and ABCs noted in the acute phase of KFD was lower than
reported for other acute viral infections in h umans20. This may be secondary to the small window of time that
these cells are present in the peripheral blood. Since most KFD patients were not sampled repeatedly during the
acute phase, the window of maximal activation of these B cell populations may have been missed.
More than just an observational study of cellular immunity during KFD, this work provided a unique oppor-
tunity to assess how these various immune cell populations were modulated by prior vaccination. All patients in
the study, both unvaccinated and vaccinated, became clinically ill after KFDV infection. One might hypothesize
that prior vaccination would decrease the severity or limit the duration of the illness. Notably, the 2 patients
who succumbed to the disease and the 3 patients who developed CNS signs did not receive KFDV vaccination,
supporting the hypothesis that prior vaccination could limit the severity of the disease. Additionally, a statisti-
cally significant association was seen between the frequency of acute phase ABCs and IgM and IgG titers in
patients who had received 2–3 doses of the vaccine, but not in those who had received a single dose. This is
consistent with the previously reported poor efficacy of a single dose of KFDV vaccine and improved efficacy
of additional doses. We might have missed low levels of anti-KFDV IgG as sensitivity of the assay with the cut
off used needs to be further evaluated. Individuals who had received 2 or 3 vaccine doses also tended to clear
KFDV sooner than unvaccinated individuals or those who received 1 dose, though some outliers with persistent
viremia abrogated this effect.
The current KFDV vaccination strategy requires multiple doses of a formalin-inactivated preparation to
achieve protection and annual boosting to maintain that protection. Since memory responses are more robust
and develop faster than primary responses, the presence of a strong memory T cell response to KFDV antigens
should have led to faster and more robust T cell responses in vaccine recipients than in unvaccinated persons,
but this was not observed. The complete lack of statistically significant differences in T cell responses between
vaccinated and unvaccinated individuals during the acute phase suggests that the current vaccine poorly primes
T cells against KFDV. Therefore, one goal of future KFDV vaccine development efforts could be to target the
generation of KFDV-specific T cell responses in addition to KFDV-specific antibody responses.
Conclusion
This study describes the dynamics and phenotypic status of both B and T cell responses during KFDV infection
in humans. The current KFDV vaccine has limited efficacy against KFDV infection, but may reduce the severity
of KFD. A more effective KFDV vaccine is needed, and cellular and humoral responses after vaccination should
be characterized in order to understand the correlation of protection, especially those related to KFDV-specific B
Scientific Reports | (2020) 10:15306 | https://doi.org/10.1038/s41598-020-72205-1 6
Vol:.(1234567890)www.nature.com/scientificreports/
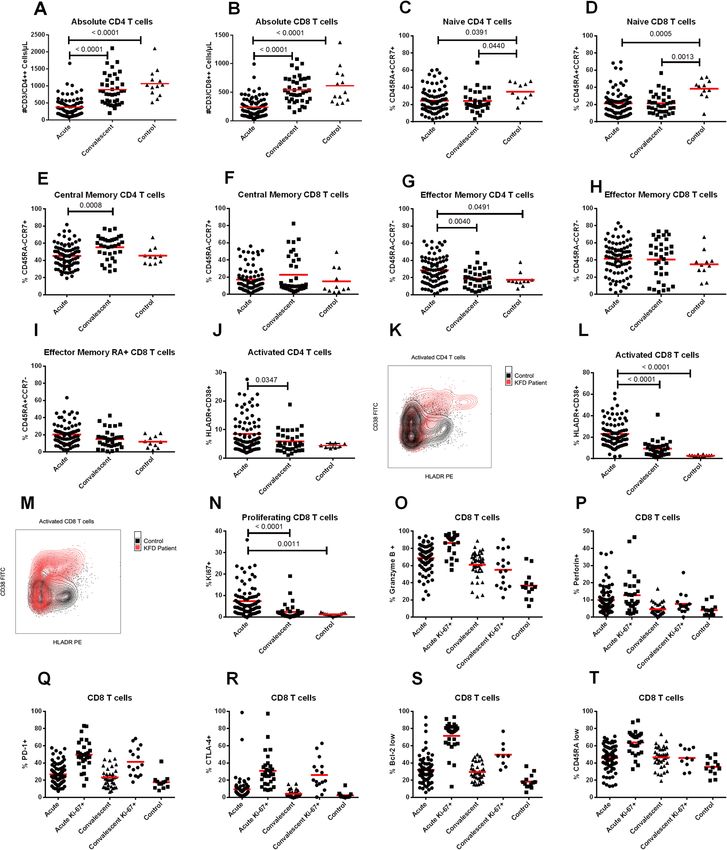
Figure 3. B cell responses during acute and convalescent KFDV infection and their relationship to prior vaccination. Absolute
numbers of B cells (CD19 + lymphocytes) (A); line represents the mean. Representative flow plots for plasmablasts (CD20- CD71 +)
and activated B cells (CD20 + CD71 +) in patients at the peak of the response versus a normal healthy control (B). Frequency of
plasmablasts, activated B cells (C,D). Frequency of plasmablasts, activated B cells among vaccinated and unvaccinated patients at
different phases of illness (E–H). IgM and IgG responses among vaccinated and unvaccinated patients at different phases of illness
(I–L). KFDV-specific antibody responses and viral loads over time in vaccinated and unvaccinated patients (M–O). Dotted line
represents the limit of KFDV detection by real-time PCR. Table under X-axis in figure M–O shows number of subjects at each time
point. Statistical significance was determined by one-way ANOVA followed by Tukey’s multiple comparisons test. Graphs were made
using GraphPad Prism version 6.01.
Scientific Reports | (2020) 10:15306 | https://doi.org/10.1038/s41598-020-72205-1 7
Vol.:(0123456789)www.nature.com/scientificreports/
and T cell responses. Towards this end, future studies will also be needed to develop and validate KFDV-specific
reagents for use in studies of functional cellular immunity.
Received: 14 May 2020; Accepted: 17 August 2020
References
1. Work, T. H. Virological aspects of Kyasanur Forest disease. J. Indian Med. Assoc. 31, 111–113 (1958).
2. Alert, C. D. Kyasanur Forest Disease: a public health concern (National Center for Disease Control, Directorate General of Health
Services, Delhi, 2018).
3. Munivenkatappa, A., Sahay, R., Yadav, P., Viswanathan, R. & Mourya, D. Clinical & epidemiological significance of Kyasanur forest
disease. Indian J. Med. Res. 148, 145 (2018).
4. Centers for Disease Control and Prevention. Kyasanur Forest Disease (KFD). Available at: https://www.cdc.gov/vhf/kyasanur/
index.html. (Accessed: 21st June 2019)
5. Rao, R. L. Clinical observations on Kyasanur Forest disease cases. J. Indian Med. Assoc. 31, 113–116 (1958).
6. Pavri, K. Clinical, clinicopathologic, and hematologic features of Kyasanur Forest disease. Rev. Infect. Dis. 11, S854–S859 (1989).
7. Kasabi, G. S. et al. Kyasanur Forest disease, India, 2011–2012. Emerg. Infect. Dis. 19, 278–281 (2013).
8. Kasabi, G. S. et al. Coverage and effectiveness of Kyasanur Forest disease (KFD) vaccine in Karnataka, South India, 2005–2010.
PLoS Negl. Trop. Dis. 7, 2005–2015 (2013).
9. Sathe, P. S., Dandawate, C. N., Sharadamma, K. & Ghosh, S. N. Circulating interferon-alpha in patients with Kyasanur forest disease.
Indian J. Med. Res. 93, 199–201 (1991).
10. Sawatsky, B., McAuley, A. J., Holbrook, M. R. & Bente, D. A. Comparative pathogenesis of Alkhumra hemorrhagic fever and
Kyasanur Forest disease viruses in a mouse model. PLoS Negl. Trop. Dis. 8, 2 (2014).
11. Ksiazek, T. G. et al. CJP clinical virology of ebola hemorrhagic fever (EHF): Virus, virus antigen, and IgG and IgM antibody find-
ings among EHF patients in Kikwit, Democratic Republic of the Congo, 1995. J. Infect. Dis. 179, 177–187 (1999).
12. Mourya, D. T. et al. Diagnosis of Kyasanur forest disease by nested RT-PCR, real-time RT-PCR and IgM capture ELISA. J. Virol.
Methods 186, 49–54 (2012).
13. Arunkumar G. Annual review of Hospital based surveillance of Acute Febrile Illness in India. (2017).
14. Arunkumar, G. et al. Adaptive immune responses in humans during Nipah virus acute and convalescent phases of infection. Clin.
Infect. Dis. https://doi.org/10.1093/cid/ciz010 (2019).
15. Mcelroy, A. K. et al. A case of human lassa virus infection with robust acute T-cell activation and long-term virus-specific T-cell
responses. J. Infect. Dis. J. Infect. Dis. 215, 1862–1872 (2017).
16. Mcelroy, A. K. et al. Human Ebola virus infection results in substantial immune activation. Proc. Natl. Acad. Sci. USA 14, 4719–4724
(2015).
17. Chandele, A. et al. Characterization of human CD8 T cell responses in dengue virus-infected patients from India. J. Virol. 90,
11259–11278 (2016).
18. Miller, J. D. et al. Human effector and memory CD8+ T cell responses to smallpox and yellow fever vaccines. Immunity 28, 710–722
(2008).
19. Blom, K. et al. Specificity and dynamics of effector and memory CD8 T cell responses in human tick-borne encephalitis virus
infection. PLos Pathog https://doi.org/10.1371/journal.ppat.1004622 (2015).
20. Wrammert, J. et al. Rapid and massive virus-specific plasmablast responses during acute dengue virus infection in humans. J. Virol
. https://doi.org/10.1128/JVI.06075-11 (2012).
Acknowledgements
The authors would like to thank Tanya Klimova for editing the manuscript. The authors also thank all local and
state public health officials of Goa, Karnataka and Maharashtra for their contribution. We acknowledge Laveena
Kotian, Vinay Kumar and Sukesh Bhandari laboratory technologist of Manipal Institute of Virology for the
technical assistance. The findings and conclusions in this report are those of the authors and do not necessarily
represent the official position of the Manipal Academy of Higher Education.
Author contributions
S.D.: performed experiments, analyzed data, prepared and edited manuscript. A.K.M.: study conception and
design, analyzed data and edited manuscript. S.G.P.: performed experiments, analyzed data, prepared and edited
manuscript. G.A.: study conceptualization, reviewed the study design, reviewed and edited the manuscript,
funding, resources acquisition.
Funding
This work was supported by “Indian Council of Medical Research, Department of Health and Family Welfare,
Government of India” for the Virus Research and Diagnostics Laboratories (File no. 5/8/7/15/2010/ECD-I) to
Govindakarnavar Arunkumar.
Competing interests
The authors declare no competing interests.
Additional information
Supplementary information is available for this paper at https://doi.org/10.1038/s41598-020-72205-1.
Correspondence and requests for materials should be addressed to G.A.
Reprints and permissions information is available at www.nature.com/reprints.
Publisher’s note Springer Nature remains neutral with regard to jurisdictional claims in published maps and
institutional affiliations.
Scientific Reports | (2020) 10:15306 | https://doi.org/10.1038/s41598-020-72205-1 8
Vol:.(1234567890)www.nature.com/scientificreports/
Open Access This article is licensed under a Creative Commons Attribution 4.0 International
License, which permits use, sharing, adaptation, distribution and reproduction in any medium or
format, as long as you give appropriate credit to the original author(s) and the source, provide a link to the
Creative Commons licence, and indicate if changes were made. The images or other third party material in this
article are included in the article’s Creative Commons licence, unless indicated otherwise in a credit line to the
material. If material is not included in the article’s Creative Commons licence and your intended use is not
permitted by statutory regulation or exceeds the permitted use, you will need to obtain permission directly from
the copyright holder. To view a copy of this licence, visit http://creativecommons.org/licenses/by/4.0/.
© The Author(s) 2020
Scientific Reports | (2020) 10:15306 | https://doi.org/10.1038/s41598-020-72205-1 9
Vol.:(0123456789)You can also read