The role of sonoelastography in acute, subacute and chronic thyroiditis: a novel application of the method
←
→
Page content transcription
If your browser does not render page correctly, please read the page content below
European Journal of Endocrinology (2012) 166 425–432                                                                               ISSN 0804-4643

CLINICAL STUDY

The role of sonoelastography in acute, subacute and chronic
thyroiditis: a novel application of the method
Marek Ruchala*, Ewelina Szczepanek-Parulska*, Ariadna Zybek, Jerzy Moczko1, Agata Czarnywojtek,
Grzegorz Kaminski2 and Jerzy Sowinski
Department of Endocrinology, Metabolism and Internal Medicine, Poznan University of Medical Sciences, 49 Przybyszewskiego Street, 60-355 Poznan,
Poland, 1Department of Computer Science and Statistics, 79 Dabrowskiego Street, 60-529 Poznan, Poland and 2Department of Endocrinology and Isotope
Therapy, Military Institute of Medicine, 128 Szaserow Street, 04-141 Warsaw, Poland
(Correspondence should be addressed to M Ruchala; Email: mruchala@ump.edu.pl)
*(M Ruchala and E Szczepanek-Parulska contributed equally to this work)

                             Abstract
                             Objective: Reports on sonoelastography, which provide an objective estimation of tissue elasticity, are
                             scarce in terms of thyroiditis. The aim of this study was to prospectively assess the applicability of
                             sonoelastography in different types of thyroiditis.
                             Design: The study assessed and compared the thyroid tissue stiffness in patients with acute thyroiditis
                             (AT), subacute thyroiditis (SAT), and chronic autoimmune thyroiditis (CAT) with healthy control
                             subjects (CS), followed up for 10 weeks.
                             Methods: The study group consisted of two patients with AT, 18 patients with SAT, 18 patients with
                             CAT, and 40 CS matched for age and gender. Sonoelastography was performed at baseline, at a 4-week
                             follow-up during treatment, and at 10 weeks following diagnosis and treatment initiation.
                             Results: Thyroid tissue stiffness was higher in SAT at baseline (214.26G32.5 kPa) in comparison with
                             values recorded at a 4-week follow-up (45.92G17.4 kPa) and at 10 weeks following diagnosis and
                             treatment initiation (21.65G5.3 kPa, P!0.0001). Baseline thyroid stiffness in SAT was higher than
                             that found in CAT (36.15G18.7 kPa, P!0.0001) and CS (16.18G5.4 kPa, P!0.0001). In the
                             remission of SAT, thyroid stiffness was lower than that found in CAT (PZ0.006), while it was higher
                             than that in CS (PZ0.0008). No difference was observed between thyroid stiffness in SAT at 4-week
                             follow-up and in CAT. Patients with CAT presented higher thyroid stiffness than CS (P!0.0001),
                             which was not influenced by L-thyroxine treatment. Thyroid stiffness in patients with AT was 216.6
                             and 241.9 kPa at baseline; after treatment, it decreased to 17.93 and 85.348 kPa respectively.
                             Conclusions: Sonoelastography may assist in the diagnosis and treatment monitoring of AT, SAT and
                             CAT, as well as in the differentiation of the various types of thyroiditis.

                             European Journal of Endocrinology 166 425–432

Introduction                                                              examinations is one of its great advantages. Although
                                                                          available from 1990, it was first used in thyroid
Traditionally, palpation has been a part of a routine                     examination in 2005 by Lyshchik et al. (2). Usefulness
clinical evaluation of the thyroid, the aim of which is to                of the method in differentiating benign and malignant
examine tissue firmness. However, this method is highly                   thyroid tumors has been widely described (3). Never-
subjective, and its interpretation varies depending on                    theless, there is still no clear conclusion about its true
the size and location of the lesions, as well as the                      clinical utility (2, 3, 4). However, the sonoelastographic
experience of the physician. Sonoelastography, some-                      image of thyroid inflammatory diseases has only
times referred to as ‘electronic palpation’, is a novel                   occasionally been the subject of investigation.
imaging technique used for the noninvasive and                               Although acute thyroiditis (AT), subacute thyroiditis
objective reconstruction of tissue stiffness, which                       (SAT), and chronic autoimmune thyroiditis (CAT) have
measures the degree of its deformation in response to                     dissimilar origin and require different management,
the application of an external force (1). It is based on the              these conditions may share some parallel clinical,
principle that abnormal tissue, affected with fibrosis,                   biochemical, and sonographic features, which might
inflammatory infiltration or neoplastic process, tends                    lead to confusion and, as a result, diagnostic difficulties.
to be stiffer than healthy tissue. The possibility of                     On the other hand, thyroid sonoelastography was found
implementing this method in commercial ultrasound                         to be exceptionally useful in the evaluation of thyroid
(US) systems and using it during routine US                               nodules; nevertheless, it remains unknown whether the

q 2012 European Society of Endocrinology                                                                                DOI: 10.1530/EJE-11-0736
                                                                                                              Online version via www.eje-online.org

                                                                                                            Downloaded from Bioscientifica.com at 09/07/2021 09:07:27PM
                                                                                                                                                          via free access
426     M Ruchala, E Szczepanek-Parulska and others                          EUROPEAN JOURNAL OF ENDOCRINOLOGY (2012) 166

implementation of this method might bring further             chemiluminescent analyzer (Roche Diagnostics) and
insight into the evaluation of thyroiditis. It is also        included measurement of serum TSH, free triiodothyr-
uncertain whether a coexisting thyroid inflammation           onine (FT3), and free thyroxine (FT4). Thyroid auto-
might influence the result of sonoelastographic evalu-        antibody concentrations (TSH receptor antibody, TRAb;
ation of thyroid focal lesions. Thus, the aim of this study   antithyroid peroxidase antibody, TPOAb; and antithyr-
was to prospectively assess the sonoelastographic             oglobulin antibody, TgAb) were assessed by radio-
images of AT, SAT, and CAT at baseline and during             immunological method using commercially available
remission, as well as to evaluate the applicability of        BRAMHS anti-TPO, anti-Tg, and TRAK RIA kits and
sonoelastography in the diagnosis, differentiation, and       scintillation gamma counter (LKB Wallac CliniGamma
treatment monitoring of the various types of thyroiditis.     1272).

                                                              Thyroid imaging
Subjects and methods
                                                              At baseline, all the patients underwent conventional US
Subjects                                                      and sonoelastographic evaluation using an AIXPLORER
                                                              system by Supersonic Imagine, with the use of Shear
The studied group consisted of two patients with AT,          Wave Elastography. All the examinations were per-
18 patients with granulomatous SAT, 18 patients               formed by two experienced thyroid sonographers (M R
with CAT and a group of 40 control subjects (CS)              and E S) and the obtained results were averaged. The
without thyroid pathology referred to the department          stiffness of thyroid parenchyma was assessed in both a
for other conditions, matched for age and gender.             qualitative and a quantitative manner. By measuring
   The patients underwent clinical examinations,              the propagation velocity of the shear waves at every
routine blood tests, conventional US, followed by             point of the image, an elasticity map could be deduced.
fine-needle aspiration biopsy (FNAB) if indicated, and        This included color-coded displays depicting tissue
a sonoelastographic examination. AT was diagnosed             stiffness using a color scale from blue (soft) through
on the basis of clinical symptoms, including fever and        green and yellow (medium elasticity) to red (hard). The
painful goiter, accompanied by local lymphadenopathy,         classification of the affected thyroid parenchyma in a
as well as the results of conventional US and cytological     4-point modified Ueno scale was used to describe tissue
examination of the specimen obtained during FNAB.
                                                              stiffness, where elasticity score (ES) I meant completely
SAT was diagnosed in the presence of painful goiter,
                                                              normal thyroid elasticity (blue color); ES II, parenchyma
accompanied by an elevated erythrocyte sedimentation
                                                              of predominantly normal elasticity, however, containing
rate (ESR), moderately increased body temperature,
                                                              areas of slightly increased stiffness (green and yellow
decreased radioisotope uptake on the thyroid scintiscan,
and a typical image acquired using conventional US.           color); ES III, parenchyma of intermediate elasticity,
The latter involved an increase in the volume of the          where yellow color predominates and may contain some
thyroid gland, especially in depth; it was accompanied        tiny areas of highly increased stiffness, depicted in red;
by ill-defined regions of the thyroid parenchyma,             and ES IV, most of the thyroid parenchyma presents
characterized by areas of heterogeneous and decreased         highly increased stiffness, with predominating red color
echogenicity, smoothly turning into those of normal           (5). The classical 5-point Ueno elasticity scale was
echogenicity. To the group with CAT patients presenting       modified, as regions affected with thyroid inflammation
hypothyroidism, elevated antithyroid autoantibodies           presenting no clear margins were evaluated. The
and a diffusely decreased echogenicity of the thyroid         quantitative information was depicted as a stiffness
parenchyma on conventional US were included. Sub-             index and expressed in kilopascals on a continuous
jects clinically and biochemically euthyroid, with a          scale. Tissue stiffness was quantified by Young’s Module
negative history of thyroid disease, and presenting no        E corresponding to the speed of propagation of the shear
thyroid pathology on conventional thyroid US were             wave. As the method gives a possibility to evaluate
classified as CS.                                             stiffness at each point of interest, the stiffest area of
   The protocol of the study was accepted by the local        a lesion was chosen for quantitative assessment of
ethics committee, and all the participants gave informed      parenchymal firmness.
consent to participate.
                                                              Cytological examination
Serum assays                                                  US-guided FNAB of some detected lesions was performed
ESR after 1 h was calculated by a classical method,           to confirm the diagnosis and exclude thyroid malig-
while concentration of C-reactive protein (CRP) was           nancy. The cytological evaluation of the obtained
assessed by highly sensitive particle-enhanced immuno-        specimens was performed by the two pathologists as a
turbidimetric method. Assessment of hormone concen-           routine medical procedure in the Department of
tration was performed using Hitachi Cobas e601                Pathology at Poznan University of Medical Sciences.

www.eje-online.org

                                                                                      Downloaded from Bioscientifica.com at 09/07/2021 09:07:27PM
                                                                                                                                    via free access
EUROPEAN JOURNAL OF ENDOCRINOLOGY (2012) 166 Sonoelastography in thyroiditis 427
Interventions – patients diagnosed with SAT – 16 women and two
men, aged 27–74 (median 49.5) years
Patients diagnosed with AT were given a course of wide- – patients diagnosed with CAT – 16 women and two
spectrum antibiotics (third-generation cephalosporin) men, aged 25–71 (median 48) years
intravenously. All subjects diagnosed with SAT under- – CS – 36 women and four men, aged 21–78 (median
went an 8-week anti-inflammatory treatment with 47.5) years.
gradually decreasing doses of prednisone (from 40 to
5 mg/day). Adjuvant treatment included 20 mg ome- FNAB was performed in 18 patients to confirm the
prazole and supplementation with potassium chloride. diagnosis. In 13 of them, cytological diagnosis was
In subjects diagnosed with CAT, L-T4 substitution was consistent with SAT, in two with AT, and three biopsies
introduced to restore euthyroidism. All the patients were nondiagnostic. In the latter, SAT was diagnosed on
underwent prospective observation, with sonographic the basis of clinical, laboratory, and sonographic data.
and sonoelastographic assessment during a 4-week Patients with CAT were diagnosed on the basis of
follow-up visit and at 10 weeks following diagnosis and clinical and laboratory data, and sonographic image;
treatment initiation. hence, they were not subject to FNAB.
A significant difference in thyroid tissue stiffness
(qualitatively expressed on a 4-point scale, as well as
Statistical analysis quantitatively through the estimation of Young’s
First, the relevant parameters were compared at Module E) was noted between SAT at baseline
baseline, during a 4-week follow-up, and at 10 weeks (214.26G32.5 kPa) in comparison with values recorded
following diagnosis and treatment initiation for both the at a 4-week follow-up visit (45.92G17.4 kPa) and at
SAT and CAT patients using a nonparametric Friedman 10 weeks following diagnosis and treatment initiation
test; subsequently, a multiple comparison analysis was (21.65G5.3 kPa). Changes of the elastic properties of
carried out with the post hoc Dunn test. Next, the results thyroid parenchyma were accompanied by a gradual
were confirmed with the Quade test, due to the normalization of biochemical parameters. The results of
extremely low P values. The exact P value was thyroid tissue stiffness and biochemical assessment of
estimated on the basis of permutational techniques the patients, at the three phases of SAT, are presented in
using STATXACT-9 statistical software (Cytel Software Table 1, together with the level of statistical significance.
Corporation, Cambridge, MA, USA). The stiffness of the thyroid parenchyma in SAT at
Comparisons between patients with SAT and subjects baseline was additionally significantly higher when
diagnosed with CAT and CS were performed with the compared with that found in CAT (36.15G18.7 kPa) or
nonparametric Mann–Whitney U test. As mentioned CS (16.18G5.4 kPa), and with treatment was gradu-
earlier, the exact P values confirmed the decisions based ally restored to values close to normal (Fig. 1).
on the standard asymptotical P values. Patients with AT Representative sonoelastographic images taken in SAT
could not be involved in the statistical evaluation, since at baseline and during the recovery phase are presented
this group included very few subjects. in Fig. 2. The differences between thyroid tissue
elasticity in the three phases of SAT, CAT and CS,
assessed quantitatively as Young’s Module E, are
presented in Table 2. Table 3 presents thyroid tissue
Results stiffness evaluated qualitatively on a 4-point scale, where
I indicates the lowest stiffness and IV indicates the
The age and gender structure of the analyzed subgroups highest. At the 4-week follow-up, no significant
was as follows: difference was observed between thyroid tissue stiffness
– patients diagnosed with AT – two women, aged 40 in SAT (45.92G17.4 kPa) and CAT (36.15
and 52 years G18.7 kPa). However, during remission, after
Table 1 Results of sonoelastographic and biochemical assessment of patients with SAT performed at baseline, on a 4-week follow-up, and
at 10 weeks following diagnosis and treatment initiation.
SAT SAT SAT
Parameters (baseline) (1) (4-week follow-up) (2) (10-week follow-up) (3) P value
Young’s Module E (kPa) 214.26G32.5 45.92G17.4 21.65G5.3 P!0.0001
ESR (mm/h) 62.6G25.0 16.2G7.9 7.1G3.7 P!0.0001
CRP (mg/l) 71.7G71.9 10.2G12.9 1.6G1.8 P!0.0001
TSH (mIU/ml) 0.091G0.187 3.864G3.950 2.059G0.702 (1) vs (2) P!0.0001 (1) vs (3)
PZ0.0039 (2) vs (3) NS
FT4 (pmol/l) 30.38G12.47 14.53G2.88 15.28G2.09 (1) vs (2) P!0.0001 (1) vs (3)
PZ0.006 (2) vs (3) NS
SAT, subacute thyroiditis; ESR, erythrocyte sedimentation rate; CRP, C-reactive protein; FT4, free thyroxine; NS, statistically nonsignificant.
www.eje-online.org
Downloaded from Bioscientifica.com at 09/07/2021 09:07:27PM
via free access428 M Ruchala, E Szczepanek-Parulska and others EUROPEAN JOURNAL OF ENDOCRINOLOGY (2012) 166
280 be significantly higher in Graves’ disease, as well as in
260 Median
Hashimoto’s thyroiditis, when compared with healthy
240 25–75% controls (8). Recently, our team has described the
220 Min–Max sonoelastographic image of two patients with SAT,
200
characterized by significantly increased thyroid stiffness
Young's Module E (kPa)
at baseline, which restored to values close to normal
180
with remission (9). However, a literature search reveals
160
no reports on sonoelastographic examination in AT.
140 AT usually presents with signs of both local and
120 systemic inflammation. The patient may have fever up
100 to 38–40 8C with malaise. On palpation, the thyroid
80 may appear enlarged and tender, with pain radiating to
60
40 A
20
0
Baseline Remission
4-Week follow-up
Figure 1 Young’s Module E (kPa) reflecting the quantitative values
of thyroid stiffness in the three phases of subacute thyroiditis
(at baseline, on 4-week follow-up, and during remission).
treatment, patients with SAT presented significantly
lower thyroid stiffness (21.65G5.3 kPa) than that
found in CAT (36.15G18.7 kPa), while it was still
higher in comparison with healthy CS (16.18G5.4 kPa).
Patients with CAT presented significantly higher thyroid
stiffness in comparison with CS and thyroid elasticity B
was not influenced by L-T4 treatment.
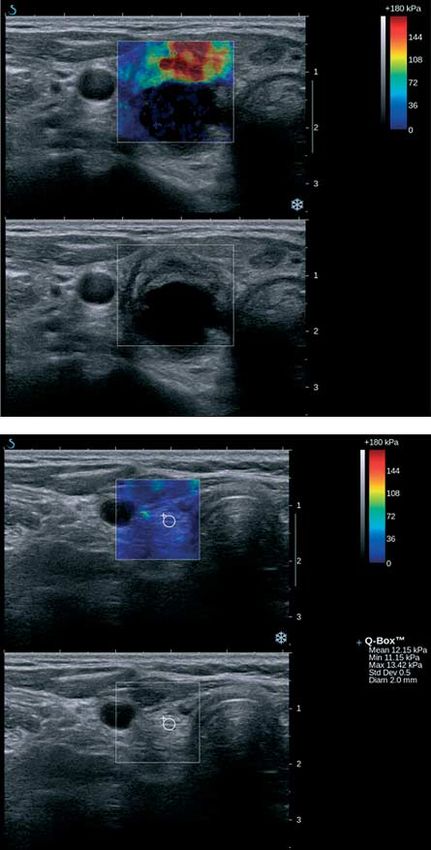
Thyroid stiffness at baseline in the two women with
AT was equal to 216.6 and 241.9 kPa (IV) respectively,
while during remission, after the evacuation of puss and
with antibacterial treatment, it decreased to 17.93 kPa
(I) and 85.348 kPa (II) respectively (Fig. 3). Moreover,
in subjects with AT or SAT, the region of the thyroid
presenting increased stiffness in the sonoelastographic
examination corresponded directly to the area most
painful on palpation.
Discussion
C
Sonoelastography combines the advantages of high-
frequency US and the possibility to assess the lesion’s
stiffness (2). This novel sonographic technique is based
on the difference in the viscoelastic properties between
normal and pathological thyroid tissue, which corre-
sponds to the tissue architecture. To date, sonoelasto-
graphy has been mainly applied in the diagnostics of
thyroid nodular disease (3). However, very little is
known about the sonoelastographic image of inflam-
matory thyroid diseases.
A rare thyroid pathology clinically associated with an
increased thyroid consistency is Riedel’s thyroiditis (6).
The sonoelastographic image of Riedel’s thyroiditis in
two patients has just been described, revealing hetero- Figure 2 Thyroid stiffness assessed by sonoelastography in
geneous stiffness of thyroid parenchyma ranging from subacute thyroiditis (SAT) (A) at baseline, (B) on a 4-week
21 to 281 kPa (7). Thyroid tissue stiffness was found to follow-up, and (C) during remission.
www.eje-online.org
Downloaded from Bioscientifica.com at 09/07/2021 09:07:27PM
via free accessEUROPEAN JOURNAL OF ENDOCRINOLOGY (2012) 166 Sonoelastography in thyroiditis 429
Table 2 Thyroid tissue stiffness expressed in Young’s Module E (kPa) in the three phases of SAT, compared with CAT and CS.
SAT
Baseline 4-week follow-up 10-week follow-up CAT baseline CS baseline
Young’s Module E (kPa) (214.26G32.5) (45.92G17.4) (21.65G5.3) (36.15G18.7) (16.18G5.4)
SAT
Baseline (214.26G32.5) X P!0.0001 P!0.0001 P!0.0001 P!0.0001
4-week follow-up (45.92G17.4) P!0.0001 X P!0.0001 NS P!0.0001
10-week follow-up (21.65G5.3) P!0.0001 P!0.0001 X P!0.006 P!0.0008
CAT
Baseline (36.15G18.7) P!0.0001 NS P!0.006 X P!0.0001
CS
Baseline (16.18G5.4) P!0.0001 P!0.0001 P!0.0008 P!0.0001 X
SAT, subacute thyroiditis; CAT, chronic autoimmune thyroiditis; CS, control subjects; kPa, kilo-Pascal; NS, statistically nonsignificant.
the mandible, ear or occiput. Biochemically, leuko- eight out of 22 patients with SAT. On the other hand,
cytosis and moderately increased ESR and CRP, but not CAT on conventional US is most often characterized by a
accompanied by disturbances in thyroid function, are diffusely decreased echogenicity, coupled with a varying
detected (10). On the other hand, SAT may similarly extent of fibrosis (12).
manifest with increased body temperature, a significant On Doppler examination, in SAT, a near absence of
elevation of ESR and CRP but rather no leukocytosis, vascularization of the affected parenchyma is observed,
firm and painful goiter, with pain of typical radiation. while the echogenically healthy-appearing regions
However, SAT is usually accompanied by thyroid exhibit normal or slightly increased vascularization
dysfunction (11). CAT can be diagnosed at any thyroid (17). The vasculature improves along with the recovery.
functional state, but typically it is not characterized by CAT may be associated with increased, normal, or
painful thyroid enlargement and biochemical or clinical decreased vascularization (12). Generally, thyroid
signs of inflammation. Nevertheless, some patients with scintiscan in SAT depicts decreased or no radionuclide
CAT may complain of thyroid tenderness, which is uptake, while AT and CAT are characterized by only
accompanied by increased temperature and malaise, as slightly reduced or focally changed iodine or technetium
well as moderately elevated ESR and CRP, and thus trapping. However, in case of atypical presentation,
might be misdiagnosed as SAT (12). Though increased thyroid scintiscan might be of little value in differential
antithyroid autoantibodies are indicative of CAT, their diagnosis (10).
presence does not exclude the diagnosis of other types Though in most cases, clinical, biochemical and
of thyroiditis (13, 14). conventional US data are sufficient to provide an
The conventional sonographic image of AT and SAT accurate diagnosis, in case of any doubts, sonoelasto-
might be very similar in the first phase of the disease and graphy may assist in differentiation of thyroiditis and
is characterized by ill-defined regions of heterogeneous help in treatment monitoring. In our study, sonoelasto-
decreased echogenicity (15, 16). However, later in AT, graphy was found to be effective in differentiating AT or
formation of an abscess can be observed, while in SAT, both of which present significantly increased
SAT, the echogenicity and thyroid size become normal thyroid stiffness, and CAT characterized by only a
during the recovery phase, with no residual changes. slightly stiffer thyroid parenchyma, in comparison
Though the typical image of SAT in conventional US with that of a normal thyroid. According to our data,
seems clear, focal distortion and heterogeneity may only close to normal thyroid elastic properties in AT and SAT
be found in some of the patients. In the study by are restored with remission. Thus, the stiffness values
Espinoza et al. (13), such an image presented in only were found to be useful in monitoring disease remission
Table 3 Thyroid tissue stiffness assessed qualitatively in a 4-point scale and the number of patients classified into the
four groups.
SAT SAT SAT
(baseline) (4-week follow-up) (10-week follow-up) CAT CS
Thyroid stiffness
I – 4 (22.2%) 15 (83.3%) 6 (33.3%) 39 (97.5%)
II – 13 (72.2%) 3 (16.7%) 12 (66.7%) 1 (2.5%)
III 1 (5.6%) 1 (5.6%) – – –
IV 17 (94.4%) – – – –
SAT, subacute thyroiditis; CAT, chronic autoimmune thyroiditis; CS, control subjects.
www.eje-online.org
Downloaded from Bioscientifica.com at 09/07/2021 09:07:27PM
via free access430 M Ruchala, E Szczepanek-Parulska and others EUROPEAN JOURNAL OF ENDOCRINOLOGY (2012) 166
A parenchymal changes and functional impairment, it
may be assumed that the elasticity values in CAT may
correlate with these two histological features. Moreover,
thyroid stiffness in the recovery phase of SAT and in CAT
was found to be very similar, which, during this phase,
makes arriving at a differential diagnosis on the basis of
sonoelastography quite difficult. What is worth men-
tioning is that the degree of tissue stiffness and
localization of the regions characterized by disturbed
elasticity in SAT corresponded with the localization and
intensity of pain reported by the patients.
The dissimilarities of thyroid stiffness observed in
the three types of thyroiditis may be attributed to the
differences in histopathologic architecture (19). The
cytological specimen in AT is mostly composed of
neutrophils and amorphous components of pus. On
the other hand, an early phase of SAT is characterized
by the disruption of follicles and neutrophil infiltration,
with subsequent aggregation of lymphocytes, histio-
B cytes and plasma cells. Multinucleated giant cells are
quite typical; however, polymorphonuclear and lym-
phocytic populations may also be present (20, 21).
Consequently, the areas of injury are replaced by a
chronic inflammatory infiltrate and fibrosis (21). CAT is
characterized mainly by focal or diffuse infiltrate of
small mononuclear lymphocytes and Hürthle cell
changes (12). Nevertheless, there is a wide overlap in
cytomorphological features of thyroiditis, and therefore
cytological analysis may not alone be used to determine
diagnosis (20).
Another important issue is the fact that changes in
thyroid firmness induced by thyroiditis may affect the
evaluation of stiffness of thyroid focal lesions. Some
authors reported that the coexistence of Hashimoto’s
thyroiditis does not significantly influence the interpre-
tation of the sonoelastographic image of concomitant
thyroid nodules (1, 18, 22). However, it is still to be
evaluated whether other types of thyroiditis might
influence the result of thyroid nodules’ elasticity
Figure 3 Thyroid stiffness in acute thyroiditis assessed (A) at
estimation. It is probable that SAT or AT, causing
baseline and (B) during remission after treatment.
much more significant changes in elastic properties of
the thyroid parenchyma than CAT, might importantly
in AT and SAT. On the other hand, thyroid stiffness in affect the estimated nodule firmness. As cases of
CAT was not significantly influenced by the introduc- coexistence of SAT with nodular goiter or thyroid
tion of L-T4 treatment. The results of thyroid stiffness in cancer have been described, it seems best to postpone
our group of patients with CAT are comparable to those the assessment of the nodule stiffness until a complete
obtained in the study by Magri et al. (18), though a little recovery from SAT or AT (23).
higher. A slight discordance might be attributed to the In our study, the stiffness of thyroid parenchyma was
different number of subjects included in these studies. assessed in both a qualitative and a quantitative
Another important issue is that all patients diagnosed manner and the obtained results were comparable.
with CAT in our study were on L-T4 replacement Recently, Park et al. (24) demonstrated a high
therapy, while less than half of the patients enrolled in interobserver variability of the qualitative methods of
the study by Magri et al. (18) needed L-T4. The mean elastographic evaluation, where the elasticity image
value of elasticity in this subgroup of 14 patients was and score depended on the extent of tissue compression.
noted to be higher than that in patients with no thyroid On the other hand, since the technique of Shear Wave
dysfunction. Since the lymphocytic infiltration and Elastography used in our study is devoid of the need for
fibrosis are connected with the extent of thyroid freehand external compression, it can be assumed to be
www.eje-online.org
Downloaded from Bioscientifica.com at 09/07/2021 09:07:27PM
via free accessEUROPEAN JOURNAL OF ENDOCRINOLOGY (2012) 166 Sonoelastography in thyroiditis 431
operator independent, reproducible, and objective in Declaration of interest
the evaluation of tissue firmness (25). The authors declare that there is no conflict of interest that could be
The practical applicability of sonoelastography in perceived as prejudicing the impartiality of the research reported.
thyroiditis might be limited, as several other clinical and
laboratory tests coupled with conventional US usually
provide a clinician with sufficient information to
Funding
establish a diagnosis and decide on the management. This study was supported by the State Committee for Scientific
Though palpation allows one to roughly assess the Research (grant nr N N402 545540 and 402/FNiTP/162/2009).
degree of thyroid firmness, elastographic imaging offers
the quantitative and objective assessment of thyroid
stiffness, an opportunity to follow changes in time, and
the possibility to visualize the firmness of the dorsal References
parts of the thyroid. What is more, the examination is
easy to perform and requires no more than 3–5 min 1 Gietka-Czernel M, Kochman M, Bujalska K, Stachlewska-
Nasfeter E & Zgliczynski W. Real-time ultrasound elastography –
in addition to the routinely performed conventional a new tool for diagnosing thyroid nodules. Endokrynologia Polska
US (26). 2010 61 652–657.
Evidently, the changes of thyroid tissue stiffness 2 Lyshchik A, Higashi T, Asato R, Tanaka S, Ito J, Mai JJ,
observed in different types of thyroiditis are not specific Pellot-Barakat C, Insana MF, Brill AB, Saga T, Hiraoka M &
Togashi K. Thyroid gland tumor diagnosis at US elastography.
and may not serve as the only factor determining the Radiology 2005 237 202–211. (doi:10.1148/radiol.23630
diagnosis. In addition to other factors, sonoelastography 41248)
may be regarded as an adjunctive method supporting 3 Bojunga J, Herrmann E, Meyer G, Weber S, Zeuzem S & Friedrich-
the diagnosis of thyroiditis, especially in cases of the Rust M. Real-time elastography for the differentiation of benign
and malignant thyroid nodules: a meta-analysis. Thyroid 2010 20
so-called ‘gray zone’. Furthermore, it allows physicians 1145–1150. (doi:10.1089/thy.2010.0079)
to monitor the recovery of patients from AT or SAT, 4 Lippolis PV, Tognini S, Materazzi G, Polini A, Mancini R,
and thus influences the titration of medications. It is Ambrosini CE, Dardano A, Basolo F, Seccia M, Miccoli P &
interesting to note that elasticity in convalescents from Monzani F. Is elastography actually useful in the presurgical
selection of thyroid nodules with indeterminate cytology? Journal of
SAT is still significantly higher than that in controls. Clinical Endocrinology and Metabolism 2011 96 E1826–E1830.
However, it might be attributed to the relatively short (doi:10.1210/jc.2011-1021)
observation period in our study. It is also possible that 5 Rago T & Vitti P. Role of thyroid ultrasound in the diagnostic
the elasticity would become completely normal over the evaluation of thyroid nodules. Best Practice & Research. Clinical
Endocrinology & Metabolism 2008 22 913–928. (doi:10.1016/
time of 10 weeks or more. Additionally, the lack of j.beem.2008.09.016)
complete restoration of normal thyroid stiffness might 6 Fatourechi MM, Hay ID, McIver B, Sebo TJ & Fatourechi V. Invasive
indicate the coexistence of CAT. Further studies on fibrous thyroiditis (Riedel thyroiditis): the Mayo Clinic experience,
larger groups of patients are required to confirm 1976–2008. Thyroid 2011 21 765–772. (doi:10.1089/thy.2010.
0453)
whether persistently increased thyroid stiffness in the 7 Slman R, Monpeyssen H, Desarnaud S, Haroche J, Fediaevsky
recovery phase of SAT might be indicative of long-term Ldu P, Fabrice M, Seret-Begue D, Amoura Z, Aurengo A &
hypothyroidism or disease recurrence. Leenhardt L. Ultrasound, elastography, and fluorodeoxyglucose
There were some important limitations in this study, positron emission tomography/computed tomography imaging
in Riedel’s thyroiditis: report of two cases. Thyroid 2011 21
which should be mentioned. First, the number of 799–804. (doi:10.1089/thy.2010.0242)
enrolled patients was relatively small. Secondly, the 8 Sporea I, Vlad M, Bota S, Sirli RL, Popescu A, Danila M,
main objective of this research was to show general Sendroiu M & Zosin I. Thyroid stiffness assessment by
differences between sonoelastographic images of var- acoustic radiation force impulse elastography (ARFI). Ultraschall
in der Medizin 2011 32 281–285. (doi:10.1055/s-0029-
ious types of thyroiditis. Hence, detailed description of 1246048)
sonoelastographic image variation and its correlation 9 Ruchala M, Szczepanek E & Sowinski J. Sonoelastography
with biochemical and cytological findings for each of in de Quervain thyroiditis. Journal of Clinical Endocrinology and
the particular conditions was not included. However, Metabolism 2011 96 289–290. (doi:10.1210/jc.2010-1595)
10 Cases JA, Wenig BM, Silver CE & Surks MI. Recurrent acute
that could be an interesting idea for further exploration suppurative thyroiditis in an adult due to a fourth branchial pouch
on a larger group of patients. fistula. Journal of Clinical Endocrinology and Metabolism 2000 85
In conclusion, AT and SAT are associated with an 953–956. (doi:10.1210/jc.85.3.953)
increased stiffness of the thyroid parenchyma, which is 11 Nishihara E, Ohye H, Amino N, Takata K, Arishima T, Kudo T,
Ito M, Kubota S, Fukata S & Miyauchi A. Clinical characteristics of
restored with treatment to values close to normal. CAT 852 patients with subacute thyroiditis before treatment. Internal
is associated with only a minimal increase in the Medicine 2008 47 725–729. (doi:10.2169/internalmedicine.47.
stiffness of thyroid tissue, which remains unchanged 0740)
during therapy. Sonoelastography may assist in the 12 Onoda N, Kato Y, Seki T, Kurimoto M, Takano K, Ito Y & Sato K.
Increased thyroid blood flow in the hypoechoic lesions in patients
diagnosis and treatment monitoring of AT, SAT and with recurrent, painful Hashimoto’s thyroiditis at the time of acute
CAT, as well as in the differentiation of the various types exacerbation. Endocrine Journal 2009 56 65–72. (doi:10.1507/
of thyroiditis. endocrj.K08E-194)
www.eje-online.org
Downloaded from Bioscientifica.com at 09/07/2021 09:07:27PM
via free access432 M Ruchala, E Szczepanek-Parulska and others EUROPEAN JOURNAL OF ENDOCRINOLOGY (2012) 166
13 Espinoza PG, Guendelman CL, Quevedo Limon LN & Fernandez RJ. 21 Kabalak T & Ozgen AG. Familial occurrence of subacute
A comparison between two imaging techniques for the diagnosis thyroiditis. Endocrine Journal 2002 49 207–209. (doi:10.1507/
of subacute thyroiditis (de Quervain thyroiditis): brief commu- endocrj.49.207)
nication. Clinical Nuclear Medicine 2010 35 862–864. (doi:10. 22 Asteria C, Giovanardi A, Pizzocaro A, Cozzaglio L, Morabito A,
1097/RLU.0b013e3181f49adc) Somalvico F & Zoppo A. US-elastography in the differential
14 Fatourechi V, Aniszewski JP, Fatourechi GZ, Atkinson EJ & diagnosis of benign and malignant thyroid nodules. Thyroid 2008
Jacobsen SJ. Clinical features and outcome of subacute thyroiditis 18 523–531. (doi:10.1089/thy.2007.0323)
in an incidence cohort: Olmsted County, Minnesota, study. 23 Nishihara E, Hirokawa M, Ohye H, Ito M, Kubota S, Fukata S,
Journal of Clinical Endocrinology and Metabolism 2003 88 Amino N & Miyauchi A. Papillary carcinoma obscured by
2100–2105. (doi:10.1210/jc.2002-021799) complication with subacute thyroiditis: sequential ultrasono-
15 Bennedbaek FN & Hegedus L. The value of ultrasonography in the graphic and histopathological findings in five cases. Thyroid
diagnosis and follow-up of subacute thyroiditis. Thyroid 1997 7 2008 18 1221–1225. (doi:10.1089/thy.2008.0096)
45–50. (doi:10.1089/thy.1997.7.45) 24 Park SH, Kim SJ, Kim EK, Kim MJ, Son EJ & Kwak JY. Interobserver
16 Park SY, Kim EK, Kim MJ, Kim BM, Oh KK, Hong SW & Park CS. agreement in assessing the sonographic and elastographic
Ultrasonographic characteristics of subacute granulomatous features of malignant thyroid nodules. AJR. American Journal of
thyroiditis. Korean Journal of Radiology 2006 7 229–234. Roentgenology 2009 193 W416–W423. (doi:10.2214/AJR.09.
(doi:10.3348/kjr.2006.7.4.229) 2541)
17 Kunz A, Blank W & Braun B. De Quervain’s subacute thyroiditis – 25 Sebag F, Vaillant-Lombard J, Berbis J, Griset V, Henry JF, Petit P &
colour Doppler sonography findings. Ultraschall in der Medizin Oliver C. Shear wave elastography: a new ultrasound imaging
2005 26 102–106. (doi:10.1055/s-2005-858120) mode for the differential diagnosis of benign and malignant
18 Magri F, Chytiris S, Capelli V, Alessi S, Nalon E, Rotondi M, Cassibba S, thyroid nodules. Journal of Clinical Endocrinology and Metabolism
Calliada F & Chiovato L. Shear wave elastography in the diagnosis 2010 95 5281–5288. (doi:10.1210/jc.2010-0766)
of thyroid nodules: feasibility in the case of coexistent chronic 26 Rago T, Santini F, Scutari M, Pinchera A & Vitti P. Elastography:
autoimmune Hashimoto’s thyroiditis. Clinical Endocrinology 2012 new developments in ultrasound for predicting malignancy in
76 137–141. (doi:10.1111/j.1365-2265.2011.04170.x) thyroid nodules. Journal of Clinical Endocrinology and Metabolism
2007 92 2917–2922. (doi:10.1210/jc.2007-0641)
19 Varghese T. Quasi-static ultrasound elastography. Ultrasound
Clinics 2009 4 323–338. (doi:10.1016/j.cult.2009.10.009)
20 Jayaram G, Marwaha RK, Gupta RK & Sharma SK. Cytomorpho-
logic aspects of thyroiditis. A study of 51 cases with functional, Received 21 August 2011
immunologic and ultrasonographic data. Acta Cytologica 1987 31 Revised version received 11 November 2011
687–693. Accepted 5 December 2011
www.eje-online.org
Downloaded from Bioscientifica.com at 09/07/2021 09:07:27PM
via free accessYou can also read