Expression of SLC5A5 in Circulating Tumor Cells May Distinguish Follicular Thyroid Carcinomas from Adenomas: Implications for Blood-Based ...
←
→
Page content transcription
If your browser does not render page correctly, please read the page content below
Journal of
           Clinical Medicine

Article
Expression of SLC5A5 in Circulating Tumor Cells May
Distinguish Follicular Thyroid Carcinomas from
Adenomas: Implications for Blood-Based
Preoperative Diagnosis
Hyeon-Gun Jee 1,2 , Byoung-Ae Kim 1 , Minjun Kim 1 , Hyeong Won Yu 3 ,
June Young Choi 3, *, Su-jin Kim 4 and Kyu Eun Lee 1,4, *
 1   Cancer Research Institute, Seoul National University College of Medicine, Seoul 03080, Korea;
     hgjee@snu.ac.kr (H.-G.J.); iambing88@naver.com (B.-A.K.); mera3113@snu.ac.kr (M.K.)
 2   Healthcare Innovation Park, Seoul National University Bundang Hospital, Seoungnam 13605, Korea
 3   Department of Surgery, Seoul National University Bundang Hospital, Seongnam 13620, Korea;
     hyeongwonyu@gmail.com
 4   Department of Surgery, Seoul National University Hospital and College of Medicine, Seoul 03080, Korea;
     su.jin.kim.md@gmail.com
 *   Correspondence: juneychoi@snubh.org (J.Y.C.); kyueunlee@snu.ac.kr; (K.E.L.);
     Tel.: +82-31-787-7107 (J.Y.C.); +82-2-3010-3962 (K.E.L.)

 Received: 29 January 2019; Accepted: 13 February 2019; Published: 18 February 2019

 Abstract: Preoperative diagnosis of thyroid nodules reduces unnecessary surgery. Circulating tumor
 cells (CTCs) may contain information of primary tumor(s). We asked whether the peripheral blood
 expression of genes specific for circulating tumor cells (CTCs) differentiates benign thyroid nodules
 from malignant nodules. Peripheral blood mononuclear cells from thyroid nodule patients (n = 20)
 were isolated preoperatively and the expression of seven CTC-associated genes was measured in
 patients with thyroid nodule(s) (n = 20). Among the tested genes, the expression of SLC5A5 and
 LGALS3 were validated in a larger number of patients (n = 64) and our results show that SLC5A5
 expression differentiated follicular adenomas from follicular carcinomas (area under the curve
 (AUC) = 0.831). The expression of SLC5A5 in CTCs may preoperatively distinguish thyroid follicular
 adenomas from follicular carcinomas.

 Keywords: thyroid nodule; peripheral blood; circulating tumor cell; follicular adenoma;
 follicular carcinoma

1. Introduction
     Clinically palpable thyroid nodules are found in roughly 5% of women and in 1% of men [1,2].
However, high-resolution ultrasound detects thyroid nodules in 19–68% of randomly selected
individuals [3–5]; of these, 7–15% are malignant [6]. Initial evaluation of thyroid nodules is done
mainly cytologically using fine needle aspiration biopsy (FNAB) [7]. FNAB is a highly sensitive
and specific diagnostic tool, although 30% of FNAB results are indeterminate and accuracy is
operator-dependent [7]. Furthermore, follicular subtype thyroid carcinoma, which accounts for
approximately 15% of all thyroid cancer, cannot be diagnosed preoperatively by FNAB [8]. Cytological
determination of malignancy from a benign counterpart follicular adenoma, which is the most common
form of benign thyroid nodule, is impossible; malignancy can be determined only by histological
evaluation of the surgically excised thyroid tumor [9,10].
     Studies have examined ways of differentiating malignant thyroid nodules from benign nodules
preoperatively; PCR-based detection of thyroid tumor cells circulating in the blood is one of the most

J. Clin. Med. 2019, 8, 257; doi:10.3390/jcm8020257                                www.mdpi.com/journal/jcm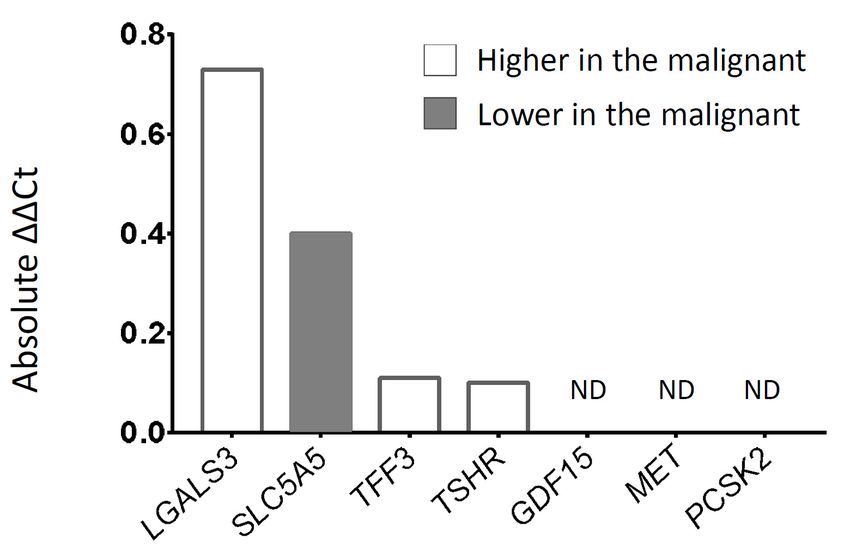
J. Clin. Med. 2019, 8, 257                                                                            2 of 9

widely addressed approaches. Well-known thyroid-specific/abundant genes such as SLC5A5, TG, TPO,
and TSHR are the targets [11]. Among them, measurement of TSHR mRNA expression in circulating
tumor cells (CTCs) in the peripheral blood can distinguish malignant thyroid nodules from benign
nodules, therefore it is used in clinical settings [12]. However, the first report suggesting TSHR mRNA
as a blood biomarker of thyroid cancer was published back in 2002 [13], and more recently the clinical
usefulness of TSHR mRNA has been questioned [14]. Since then, much gene expression data has been
generated using newly adopted methods such as cDNA arrays and transcriptome sequencing; even
organ-specific transcriptome and proteome data are available [15]. Thus, it is likely that several new
blood biomarkers of thyroid cancer are awaiting validation.
      TSHR is a well-known thyroid-specific/abundant gene used clinically as a blood biomarker of
thyroid carcinoma [12]. SLC5A5 is also a widely studied thyroid-specific/abundant gene often used to
detect CTCs; however, it has not been studied in patients with follicular thyroid cancer [16]. GDF15,
PCSK2, and CCND2 are three-gene combinatorial biomarkers, the combined expression of which is
proposed to distinguish benign from malignant thyroid nodules in FNAB aspirates [17]. CCND2 was
excluded from the present study since it is expressed at high levels by peripheral blood mononuclear
cells (PBMCs) [17]. TFF3 is differentially expressed by follicular adenomas and follicular carcinomas of
the thyroid, but not by PBMCs [18]. MET is highly expressed by papillary thyroid carcinoma cells, but
not by normal thyrocytes [19] or lymphocytes [20]. However, LGALS3 expression in thyroid tumors is
higher than that in normal thyrocytes [21]. Although this gene is expressed by blood cells, a systemic
increase in its protein product is reported in cancer patients [22]; hence, it was included in the study.
      Here, we asked whether the expression of these genes by CTCs in peripheral blood can
differentiate benign thyroid nodules from malignant nodules. We demonstrate that the expression of
SLC5A5 distinguishes benign thyroid nodules from follicular subtype malignant nodules.

2. Experimental Section

2.1. Patients
     PBMC samples were collected for a biorepository from patients undergoing thyroidectomy for a
thyroid tumor(s) under informed consent. Experienced pathologists made a diagnosis from dissected
thyroid tissue according to the WHO histological classification of thyroid tumors. Venous blood was
drawn in the operating room before any excision was performed. Blood samples were transported
to a laboratory facility and processed within 4 h. PBMCs were isolated by centrifugation using a
Ficoll-Paque Plus (GE Healthcare, Waukesha, WI, USA). Isolated cell pellets were stored at −80 ◦ C
until analysis. Peripheral blood from five normal healthy controls (without any sign of thyroid nodules
upon sonographic evaluation) was also collected and used for the study (IRB number: 1703-123-841).

2.2. Measurement of mRNA in Peripheral Blood
      RNA was extracted from PBMC samples using an Easy-spin RNA isolation kit (Intron, Daejeon,
Korea) according to the manufacturer’s instructions. RNA was quantified spectrophotometrically
using a Nanodrop spectrometer (Thermo Fisher Scientific, Wilmington, DE, USA). Fifty nanograms
of RNA were used per 20 µL reaction. Real-time PCR (RT-PCR) was performed using a QuantiTect
one-step RT-PCR kit (Qiagen, Hilden, Germany) and an ABI 7300 real-time PCR sequence detection
system (Applied Biosystems, Foster City, CA, USA). The primer and probe concentrations used were
as recommended by the manufacturer. The conditions for real-time PCR were: reverse transcription
(50 ◦ C for 30 min), polymerase activation (95 ◦ C for 15 min), and 40 cycles of 2-step amplification
(94 ◦ C for 15 s and 60 ◦ C for 1 min). The threshold cycle (Ct) was calculated from the amplification plot.
Commercially available hydrolysis primer-probe sets specific to the selected genes were used. Three
primer-probe sets for SLC5A5 were tested and the one with highest sensitivity was chosen. Information
about the primer-probe sets is provided in Table S1.
J. Clin. Med. 2019, 8, 257 3 of 9
To identify target genes (discovery phase), the fold difference in expression between two genes
was calculated using the 2−∆∆Ct relative quantification method under the assumption of an optimized
amplification efficiency (2-fold per cycle). For the validation phase, multiple housekeeping genes
(HPRT1 and GAPDH) were tested in parallel with two target genes (LGALS3 and SLC5A5) to ensure the
equal amplification of RNA. On top of that, for absolute quantification of RNA using standard curves,
a plasmid control was designed for absolute mRNA copy measurement. Briefly, target sequences for
LGALS3, SLC5A5, HPRT1, and GAPDH were chemically synthesized (Bioneer, Daejeon, Korea) and
incorporated into a single plasmid backbone. A standard curve for each gene was created using this
plasmid to calculate the transcript copy number per microgram of PBMC RNA.
2.3. Statistical Analysis
The Mann-Whitney U test (two-group quantitative variables), Fisher’s exact test (two-group
categorical variables), or the Kruskal-Wallis test (three-group quantitative variables) was performed
using SPSS version 21.0 (SPSS Inc., Chicago, IL, USA). Receiver operating characteristics analysis was
performed using Prism version 7.0 (Graphpad, San Diego, CA, USA). A p-value of < 0.05 was deemed
statistically significant unless specified otherwise.
3. Results
3.1. Patient Characteristics
For the discovery phase, PBMC samples from pathologically classified patients with thyroid
nodules matched by gender, age, and tumor size, were selected retrospectively. All 10 benign cases
were follicular adenomas, which is the most common form of benign thyroid nodule [23]. Among
the 10 malignant cases, seven were diagnosed as papillary thyroid carcinoma, which is the most
common thyroid malignancy [9]. The remaining three were follicular thyroid carcinomas, which are
difficult to distinguish from follicular adenomas in terms of preoperative diagnosis [10,24]. Only
patients with a single nodule were included in the discovery phase. None showed any signs of
lymphocytic thyroiditis, the most common autoimmune disease of the thyroid [25] that may alter
blood cell gene expression levels. For the validation phase, twenty benign (hereafter referred to as BEN
group) and forty-four malignant (the MAL group) patients were enrolled. All BEN group patients were
histologically diagnosed with follicular adenoma. Among the 44 MAL group patients, nine (20.5%)
were lymphocytic thyroiditis-positive, thirteen (29.5%) had multiple tumors, and eight (18.2%) had
follicular subtype thyroid carcinomas.
In the discovery phase, the mean age of the benign group was 48.4 (range, 18–70) years and that
of the malignant group was 46.5 (range, 28–63) years (p = 0.631). The female to male ratio for both
groups was 0.80 (p = 1.000). The mean tumor size for the benign group was 2.0 (range, 1.2–2.9) cm and
that for the malignant group was 2.0 (range, 1.2–2.8) cm (p = 0.971).
In the validation phase, the MAL group was subdivided according to the presence of lymphocytic
thyroiditis (MALLT− and MALLT+ , 35/44 and 9/44 patients respectively) or multiple tumors
(MALmulti− and MALmulti+ , 31/44 and 13/44 patients respectively), or according to thyroid carcinoma
subtype (MALpapillary and MALfollicular , 36/44 and 8/44 patients respectively). There was no significant
difference between the BEN and MAL groups, or between the MAL subgroups, with respect to mean
age, gender ratio, and mean tumor size (Table 1).Table 1. Patient characteristics.
No. of Patients Age (years) Gender, Female (%) Tumor Size (cm)
Discovery Phase
J. Clin. Med. 2019, 8, 257 4 of 9
Benign n = 10 48.4 (18–70) 0.80 2.0 (1.2–2.9)
Malignant n = 10 46.5 (28–63) 0.80 2.0 (1.2–2.8)
Table 1. Patient characteristics.
Validation Phase
BEN No.nof
= 20
Patients 48.6
Age(18–70)
(years) 0.75
Gender, Female (%) 2.3 (1.0–4.8)
Tumor Size (cm)
MAL n = 44 44.5 Discovery
(17–83) Phase 0.75 2.3 (1.1–5.5)
Benign n = 10 48.4 (18–70) 0.80 2.0 (1.2–2.9)
Malignant n = 10 46.5 (28–63)
Validation Phase (MAL Subgroups,0.80
n = 44) 2.0 (1.2–2.8)
Validation Phase
MAL
BEN
LT- n n= =3520 45.1 (17–83)
48.6 (18–70) 0.71
0.75 2.3
2.3(1.1–5.5)
(1.0–4.8)
MAL
MALLT+ nn==944 42.1 (27–65)
44.5 (17–83) 0.89
0.75 2.2
2.3(1.3–4.1)
(1.1–5.5)
Validation Phase (MAL Subgroups, n = 44)
LT−
MALmulti-
MAL LT+ n n= =3135 45.1 (17–83)
43.4 (17–83) 0.71
0.74 2.3 (1.1–5.5)
2.4 (1.2–5.5)
MALmulti+ n=9 42.1 (27–65) 0.89 2.2 (1.3–4.1)
MAL
MALmulti− n n= =1331 47.2 (23–70)
43.4 (17–83) 0.77
0.74 2.1 (1.1–3.2)
2.4 (1.2–5.5)
MALmulti+ n = 13 47.2 (23–70) 0.77 2.1 (1.1–3.2)
MALpapillary
MAL papillary n n= =3636 44.6 (17–83)
44.6 (17–83) 0.72
0.72 2.3
2.3(1.2–5.5)
(1.2–5.5)
MALfollicular
MAL follicular n n==88 44.0
44.0 (21–56)
(21–56) 0.88
0.88 2.4(1.1–5.0)
2.4 (1.1–5.0)
Abbreviations:
Abbreviations:BEN, benign;
BEN, MAL,
benign; malignant;
MAL, LT, lymphocytic
malignant; thyroiditis;
LT, lymphocytic multi, multiple
thyroiditis; multi,tumors. Values
multiple are
tumors.
expressed as the mean (range) unless stated otherwise; No., number.
Values are expressed as the mean (range) unless stated otherwise; No., number.
3.2. Discovery Phase Gene Screening
3.2. Discovery Phase Gene Screening
We measured the expression of seven target genes (GDF15, LGALS3, MET, PCSK2, SLC5A5, TFF3,
We measured the expression of seven target genes (GDF15, LGALS3, MET, PCSK2, SLC5A5,
and TSHR) and a housekeeping gene (HPRT1) by real-time RT-PCR. The expression of each target
TFF3, and TSHR) and a housekeeping gene (HPRT1) by real-time RT-PCR. The expression of each
gene was calculated by the 2−∆∆Ct method using HPRT1 as a reference. The top two genes (SLC5A5
target gene was calculated by the 2−ΔΔCt method using HPRT1 as a reference. The top two genes
and LGALS3) showing the greatest differences between the benign and the malignant groups were
(SLC5A5 and LGALS3) showing the greatest differences between the benign and the malignant
selected for further validation. Expression of LGALS3 was higher and that of SLC5A5 was lower in the
groups were selected for further validation. Expression of LGALS3 was higher and that of SLC5A5
malignant group (Figure 1).
was lower in the malignant group (Figure 1).
Figure 1. Differences
Figure 1. Differences in
in expression
expression of
of seven
seven target
target genes
genes from
from circulating
circulating tumor
tumor cells
cells derived
derived from
from
the
the peripheral blood of patients with benign and malignant thyroid nodules. Black bars denote lower
peripheral blood of patients with benign and malignant thyroid nodules. Black bars denote lower
expression
expression in
inthe
the malignant
malignantgroups
groupsand
andwhite
whitebars
barsthe
theopposite.
opposite.ND,
ND,not
notdetected.
detected.
3.3. Validation in a Larger Number of Patients
3.3. Validation in a Larger Number of Patients
For validation, the expression of SLC5A5 and LGALS3 was measured in a larger number of thyroid
nodule Forpatients.
validation, the expression
Absolute transcript of SLC5A5
copy numbersandwere
LGALS3 was measured
calculated in a larger
using a plasmid number
positive of
control
thyroid nodule
containing patients. Absolute
PCR-amplified sequences. transcript
For eachcopy numbers
gene, were
there was no calculated
significant using a plasmid
difference betweenpositive
BEN
control containing PCR-amplified sequences.
and MAL groups in terms of the copy number/µg PBMC RNA. For each gene, there was no significant difference
betweenNext,BEN and MAL
we asked groups
whether in termsofof
expression the
the copygenes
tested number/µg
by any PBMC RNA.
of the MAL subgroups was different
from that by the BEN group. There were no differences in expression of LGALS3 or SLC5A5 between
the BEN and MALLT− , BEN and MALLT+ , BEN and MALmulti− , BEN and MALmulti+ , or BEN and
J. Clin.papillary
MAL Med. 2018, 7, x; doi:However,
groups. FOR PEER REVIEW
there was a statistically significant difference www.mdpi.com/journal/jcm
in SLC5A5 expression
between the BEN and MAL follicular groups (p = 0.006). The expression of SLC5A5 by the BEN group was
higher than that by the MALfollicular group. Additionally, the MALpapillary and MALfollicular subgroups
showed a differential expression of LGALS3 (p = 0.007). The expression of housekeeping genes HPRT1different from that by the BEN group. There were no differences in expression of LGALS3 or SLC5A5
between the BEN and MALLT−, BEN and MALLT+, BEN and MALmulti−, BEN and MALmulti+, or BEN
and MALpapillary groups. However, there was a statistically significant difference in SLC5A5
expression between the BEN and MALfollicular groups (p = 0.006). The expression of SLC5A5 by the
J.BEN group
Clin. Med. 2019,was
8, 257 higher than that by the MALfollicular group. Additionally, the MALpapillary 5 and
of 9
MAL follicular subgroups showed a differential expression of LGALS3 (p = 0.007). The expression of
housekeeping genes HPRT1 and GAPDH was not significantly different among any of the subgroups
and GAPDH was not significantly different among any of the subgroups tested. PBMC from the
tested. PBMC from the normal healthy controls tended to show a lower expression of SLC5A5 and
normal healthy controls tended to show a lower expression of SLC5A5 and LGALS3, but the differences
LGALS3, but the differences were not statistically significant (Figure 2).
were not statistically significant (Figure 2).
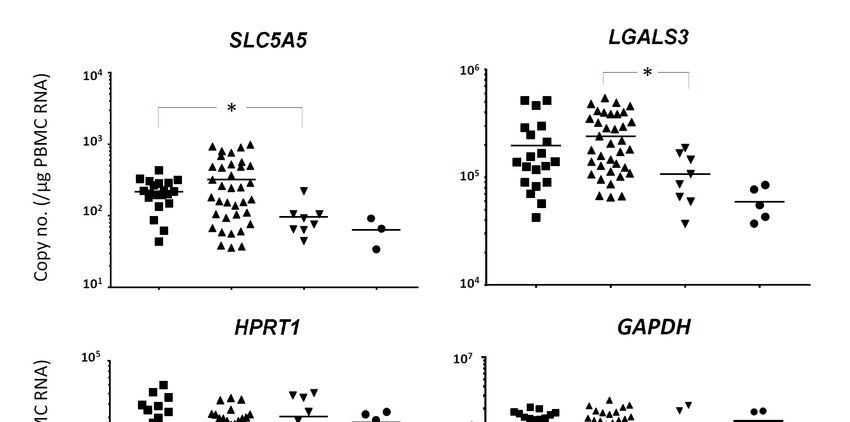
Figure 2. Expression of SLC5A5 and LGALS3 in circulating tumor cells from patients with thyroid
nodules. The center bar represents the mean value. For SLC5A5, two normal healthy control samples
Figure 2. Expression of SLC5A5 and LGALS3 in circulating tumor cells from patients with thyroid
were below the detection limit. BEN, benign thyroid nodules (follicular adenomas); MALpapillary ,
nodules. The center bar represents the mean value. For SLC5A5, two normal healthy control samples
papillary subtype of malignant thyroid nodules (papillary thyroid carcinomas); MALfollicular , follicular
were below the detection limit. BEN, benign thyroid nodules (follicular adenomas); MALpapillary,
subtype of malignant thyroid nodules (follicular thyroid carcinomas); NL, normal healthy controls.
papillary subtype of malignant thyroid nodules (papillary thyroid carcinomas); MALfollicular, follicular
subtype
To of malignant
determine thyroid nodules
the diagnostic efficacy(follicular
of SLC5A5, thyroid carcinomas);receiver
we performed NL, normal healthycharacteristics
operating controls.
analysis and calculated cut-off values yielding the highest sensitivity and specificity. The area under
To determine
the curve the diagnostic
value for SLC5A5 was 0.831 (95%efficacy of SLC5A5,
confidence interval,we performedSLC5A5
0.668–0.994). receiver
hadoperating
a cut-off
characteristics analysis and calculated cut-off values yielding the highest sensitivity
value with the highest sensitivity and specificity (2400 copies/µg PBMC RNA); sensitivity, 87.5% and specificity.
and
The area under
specificity, 85.0%the curve
(Table 2).value for SLC5A5
Therefore, was 0.831
we concluded (95%
that confidence
expression interval,by0.668–0.994).
of SLC5A5 SLC5A5
CTCs in peripheral
had amay
blood cut-off value with
distinguish the highest
BEN from sensitivity
MALfollicular and specificity
preoperatively. (2400although
In addition, copies/µg the PBMC RNA);
expression of
sensitivity, 87.5% and specificity, 85.0% (Table 2). Therefore, we concluded
LGALS3 did not differentiate the BEN group from any of the MAL subgroups, it may distinguish the that expression of
SLC5A5
MAL by from
papillary CTCsthe in MAL
peripheral
follicular blood
subtypemay distinguish
of thyroid BEN from MAL
cancer.
follicular preoperatively. In
addition, although the expression of LGALS3 did not differentiate the BEN group from any of the
MAL subgroups,
Table it may
2. Efficacy distinguish
of real-time the MAL
PCR-based for preoperative differentiation of MALfollicular
papillary from the MALfollicular subtype of thyroid
diagnosis cancer.
(follicular carcinoma) from BEN (follicular adenoma).
SLC5A5 LGALS3
AUC 0.831 0.681
95% CI 0.668–0.994 0.466–0.897
p-value
J. Clin. Med. 2018, 7, x; doi: FOR PEER REVIEW 0.007 0.140 www.mdpi.com/journal/jcm
Cut-off aJ. Clin. Med. 2019, 8, 257 6 of 9
4. Discussion
Blood-based tests, which are often referred to as liquid biopsies, have two main advantages
over FNAB: they are less invasive for patients and repeated sampling is easy [26]. Malignant cells
shed into the bloodstream, known as CTCs, provide valuable information about tumor burden [27].
The presence of CTCs in thyroid cancer was demonstrated by staining for thyroid-specific/abundant
proteins (thyroglobulin and NIS) expressed by circulating blood cells [16]. Along with cell surface
antigen-based methods, molecular amplification techniques using cancer-enriched transcripts have
also been used to detect CTCs [28]. In the case of thyroid carcinomas, PCR-amplification of TSHR
mRNAs in thyroid CTCs aid preoperative diagnosis and the monitoring of cancer relapse [12].
Another CTC-associated gene, SLC5A5, is often used to detect recurrent thyroid carcinomas, yet
yields unsatisfactory results [11,29]. To the best of our knowledge, no attempts have been made to use
SLC5A5 expression in blood to differentiate follicular adenomas from carcinomas.
In our experiments, no single gene was able to differentiate benign from malignant thyroid
nodules. When patients with malignant nodules were divided into subgroups, we found that the
expression of SLC5A5 in follicular-type thyroid carcinomas was different from that in benign nodules
(follicular adenomas). The expression of SLC5A5 was highly sensitive and specific, suggesting that
it might be an effective biomarker for preoperative blood-based diagnosis of thyroid nodules. In
addition, LGALS3 expression in the blood of those with papillary thyroid carcinomas was higher
than in that of those with follicular thyroid carcinomas. However, the LGALS3 expression by either
group was not significantly different from that of benign thyroid nodules, meaning that it is of lesser
clinical importance.
The concept of lower expression of SLC5A5 in CTCs from those with follicular thyroid carcinomas
than in that of those with adenomas (benign nodules) has not been described in the literature. However,
it is supported by a previous study showing that tissue expression of SLC5A5 by follicular carcinomas is
lower than that of adenomas [30]. Additionally, the expression of SLC5A5 in CTCs failed to differentiate
benign from malignant nodules in our study. This is in concordance with a previous study reporting
that tissue expression of SLC5A5 was not significantly different between benign and malignant nodules,
when the major subtype of malignant nodule was papillary thyroid carcinomas [31].
We assume that follicular carcinoma-derived CTCs in the blood show a lower expression of
SLC5A5 per cell, leading to the obtained real-time RT-PCR results. In a similar fashion, LGALS3
expression increases in papillary carcinoma tissues, and is similar in follicular carcinoma and adenoma
tissues [32]; indeed, our measurement of LGALS3 transcript expression in blood revealed the same
tendency in that it was marginally higher in papillary carcinomas. Therefore, we suggest that the main
factor affecting expression of CTC-associated genes in blood might be their expression at the single
CTC level. At the moment, it is not clear if the number of CTCs in the circulation differs between those
with follicular carcinoma and those with adenoma since no study, to the best of our knowledge, has
counted these cells using antibody-based methods. We plan to investigate this in the future.
Use of positive control-based standard curves allows the measurement of mRNA to be intuitive
and assumption-free, leading to more accurate results and reducing intra-laboratory variations [33].
However, since creating a standard curve for each plate is labor-intensive and requires a high number
of wells to run [33], we used a simplified 2−∆∆Ct calculation for the initial screening of target genes. For
the screened genes (SLC5A5 and LGALS3), validation real-time RT-PCR was performed using standard
curves, and the absolute copy number of each gene was calculated. It is advisable to use RNA with a
known sequence as a positive control for real-time RT-PCR since the efficiency of reverse transcribing
RNA to complementary DNA can be affected by various factors. Here, DNA synthesized from target
sequences incorporated into a plasmid backbone was our chosen positive control because the latter is
commercially available and easy to handle.
Primer selection is also an important issue for PCR-based detection. We found that the different
primer-probe sets for SLC5A5 showed different sensitivities. This implies that different primer binding
sites affect the sensitivity, and perhaps also the specificity, of the PCR; this is in agreement withJ. Clin. Med. 2019, 8, 257 7 of 9
a previous report [34]. A thyroid CTC study using TSHR mRNAs performed by Gupta et al. [13]
used primers specific to a transcriptional variant that is not expressed in blood-originated cells. We
used a SLC5A5 primer-probe set showing the highest sensitivity among the three sets tested in the
preliminary study.
Transcriptomic changes in the host, rather than the tumor itself, may also be utilized for diagnostic
and/or prognostic purposes. These approaches are based on the concept that cells in the vascular
system interact with those derived from neoplastic tissue, thereby reflecting disease status [26]. Gene
expression profiling of PBMCs or whole blood has suggested that diagnostic and/or prognostic
biomarkers for colorectal cancer [35], lung cancer [36], prostate cancer [37], and breast cancer [38].
Most of the above-mentioned studies utilized genes related to immune functions, which is reasonable
because the interaction between the tumor and host immune system has been well-described [39].
Therefore, it is assumed that genes related to host immunity may also show altered expression in the
blood of patients with thyroid cancer, although this requires confirmation. A study limitation is that
we only examined a limited number of new targets, all of which were thyroid-specific/abundant genes
that might be expressed highly in CTCs.
In conclusion, the expression of SLC5A5 in CTCs from peripheral blood can differentiate follicular
adenomas from follicular carcinomas. Limitations aside, this is the first report to show that the
expression of SLC5A5 in blood may be effective for the preoperative evaluation of thyroid nodules.
Supplementary Materials: The following are available online at http://www.mdpi.com/2077-0383/8/2/257/s1,
Table S1: Primer information.
Author Contributions: Conceptualization, H.-G.J.; formal analysis, H.-G.J.; data curation, H.-G.J., B.-A.K., M.K.,
and H.W.Y.; writing—original draft preparation, H.-G.J.; writing—review and editing, J.Y.C., S.-j.K., and K.E.L.;
funding acquisition, J.Y.C. and K.E.L.; project administration, J.Y.C. and K.E.L.
Funding: This work was supported by grants 02-2013-117 from the SNUBH Research Fund and NMC2014-MS-03
from the National Medical Center, Republic of Korea. The funders had no role in the design of the study; in
the collection, analyses, or interpretation of data; in the writing of the manuscript, or in the decision to publish
the results.
Conflicts of Interest: The authors declare no conflict of interest.
References
1. Vander, J.B.; Gaston, E.A.; Dawber, T.R. The significance of nontoxic thyroid nodules. Final report of a 15-year
study of the incidence of thyroid malignancy. Ann. Intern. Med. 1968, 69, 537–540. [CrossRef] [PubMed]
2. Tunbridge, W.M.; Evered, D.C.; Hall, R.; Appleton, D.; Brewis, M.; Clark, F.; Evans, J.G.; Young, E.; Bird, T.;
Smith, P.A. The spectrum of thyroid disease in a community: The Whickham survey. Clin. Endocrinol. 1977,
7, 481–493. [CrossRef]
3. Tan, G.H.; Gharib, H. Thyroid incidentalomas: Management approaches to nonpalpable nodules discovered
incidentally on thyroid imaging. Ann. Intern. Med. 1997, 126, 226–231. [CrossRef] [PubMed]
4. Guth, S.; Theune, U.; Aberle, J.; Galach, A.; Bamberger, C.M. Very high prevalence of thyroid nodules
detected by high frequency (13 MHz) ultrasound examination. Eur. J. Clin. Investig. 2009, 39, 699–706.
[CrossRef] [PubMed]
5. Gharib, H. Changing trends in thyroid practice: Understanding nodular thyroid disease. Endocr. Pract. 2004,
10, 31–39. [CrossRef] [PubMed]
6. Hegedus, L. Clinical practice. The thyroid nodule. N. Engl. J. Med. 2004, 351, 1764–1771. [CrossRef]
7. Haugen, B.R. 2015 American Thyroid Association Management Guidelines for adult patients with Thyroid
nodules and differentiated thyroid cancer: What is new and what has changed? Cancer 2017, 123, 372–381.
[CrossRef]
8. Takano, T.; Miyauchi, A.; Yoshida, H.; Kuma, K.; Amino, N. Decreased relative expression level of trefoil
factor 3 mRNA to galectin-3 mRNA distinguishes thyroid follicular carcinoma from adenoma. Cancer Lett.
2005, 219, 91–96. [CrossRef]J. Clin. Med. 2019, 8, 257 8 of 9
9. Al-Hilli, Z.; Strajina, V.; McKenzie, T.J.; Thompson, G.B.; Farley, D.R.; Richards, M.L. The role of lateral neck
ultrasound in detecting single or multiple lymph nodes in papillary thyroid cancer. Am. J. Surg. 2016, 212,
1147–1153. [CrossRef]
10. Greaves, T.S.; Olvera, M.; Florentine, B.D.; Raza, A.S.; Cobb, C.J.; Tsao-Wei, D.D.; Groshen, S.; Singer, P.;
Lopresti, J.; Martin, S.E. Follicular lesions of thyroid: A 5-year fine-needle aspiration experience. Cancer 2000,
90, 335–341. [CrossRef]
11. Barzon, L.; Boscaro, M.; Pacenti, M.; Taccaliti, A.; Palu, G. Evaluation of circulating thyroid-specific transcripts
as markers of thyroid cancer relapse. Int. J. Cancer 2004, 110, 914–920. [CrossRef] [PubMed]
12. Milas, M.; Shin, J.; Gupta, M.; Novosel, T.; Nasr, C.; Brainard, J.; Mitchell, J.; Berber, E.; Siperstein, A.
Circulating thyrotropin receptor mRNA as a novel marker of thyroid cancer: Clinical applications learned
from 1758 samples. Ann. Surg. 2010, 252, 643–651. [CrossRef]
13. Gupta, M.K.; Taguba, L.; Arciaga, R.; Siperstein, A.; Faiman, C.; Mehta, A.; Reddy, S.S.K. Detection of
circulating thyroid cancer cells by reverse transcription-PCR for thyroid-stimulating hormone receptor and
thyroglobulin: The importance of primer selection. Clin. Chem. 2002, 48, 1862–1865. [CrossRef]
14. Ausavarat, S.; Sriprapaporn, J.; Satayaban, B.; Thongnoppakhun, W.; Laipiriyakun, A.; Amornkitticharoen, B.;
Chanachai, R.; Pattanachak, C. Circulating thyrotropin receptor messenger ribonucleic acid is not an effective
marker in the follow-up of differentiated thyroid carcinoma. Thyroid. Res. 2015, 8, 11. [CrossRef] [PubMed]
15. RNA and Protein Expression Summary: GAPDH as an Example; The Human Protein Atlas: Stockholm, Sweden,
2018; Available online: https://www.proteinatlas.org/ENSG00000111640-GAPDH/tissue (accessed on 31
December 2018).
16. Dent, B.M.; Ogle, L.F.; O’Donnell, R.L.; Hayes, N.; Malik, U.; Curtin, N.J.; Boddy, A.V.; Plummer, E.R.;
Edmondson, R.J.; Reeves, H.L.; et al. High-resolution imaging for the detection and characterisation
of circulating tumour cells from patients with oesophageal, hepatocellular, thyroid and ovarian cancers.
Int. J. Cancer 2016, 138, 206–216. [CrossRef] [PubMed]
17. Shibru, D.; Hwang, J.; Khanafshar, E.; Duh, Q.Y.; Clark, O.H.; Kebebew, E. Does the 3-gene diagnostic assay
accurately distinguish benign from malignant thyroid neoplasms? Cancer 2008, 113, 930–935. [CrossRef]
[PubMed]
18. Takano, T.; Miyauchi, A.; Yokozawa, T.; Matsuzuka, F.; Liu, G.; Higashiyama, T.; Morita, S.; Kuma, K.;
Amino, N. Accurate and objective preoperative diagnosis of thyroid papillary carcinomas by reverse
transcription-PCR detection of oncofetal fibronectin messenger RNA in fine-needle aspiration biopsies.
Cancer Res. 1998, 58, 4913–4917. [CrossRef] [PubMed]
19. Siraj, A.K.; Bavi, P.; Abubaker, J.; Jehan, Z.; Sultana, M.; Al-Dayel, F.; Al-Nuaim, A.; Alzahrani, A.; Ahmed, M.;
Al-Sanea, O.; et al. Genome-wide expression analysis of Middle Eastern papillary thyroid cancer reveals
c-MET as a novel target for cancer therapy. J. Pathol. 2007, 213, 190–199. [CrossRef]
20. Imaizumi, Y.; Murota, H.; Kanda, S.; Hishikawa, Y.; Koji, T.; Taguchi, T.; Tanaka, Y.; Yamada, Y.; Ikeda, S.;
Kohno, T.; et al. Expression of the c-Met proto-oncogene and its possible involvement in liver invasion in
adult T-cell leukemia. Clin. Cancer Res. 2003, 9, 181–187. [CrossRef] [PubMed]
21. Das, D.K.; Al-Waheeb, S.K.; George, S.S.; Haji, B.I.; Mallik, M.K. Contribution of immunocytochemical
stainings for galectin-3, CD44, and HBME1 to fine-needle aspiration cytology diagnosis of papillary thyroid
carcinoma. Diagn. Cytopathol. 2014, 42, 498–505. [CrossRef]
22. Newlaczyl, A.U.; Yu, L.G. Galectin-3—A jack-of-all-trades in cancer. Cancer Lett. 2011, 313, 123–128.
[CrossRef] [PubMed]
23. Kumar, V.; Abbas, A.K.; Fausto, N.; Robbins, S.L.; Cotran, R.S. Robbins and Cotran Pathologic Basis of Disease,
7th ed.; Elsevier Saunders: Philadelphia, PA, USA, 2005.
24. Kim, M.J.; Kim, E.K.; Kim, B.M.; Kwak, J.Y.; Lee, E.J.; Park, C.S.; Cheong, W.Y.; Nam, K.H. Thyroglobulin
measurement in fine-needle aspirate washouts: The criteria for neck node dissection for patients with thyroid
cancer. Clin. Endocrinol. 2009, 70, 145–151. [CrossRef] [PubMed]
25. Lee, J.H.; Kim, Y.; Choi, J.W.; Kim, Y.S. The association between papillary thyroid carcinoma and histologically
proven Hashimoto’s thyroiditis: A meta-analysis. Eur. J. Endocrinol. 2013, 168, 343–349. [CrossRef] [PubMed]
26. Osman, I.; Bajorin, D.F.; Sun, T.T.; Zhong, H.; Douglas, D.; Scattergood, J.; Zheng, R.; Han, M.; Marshall, K.W.;
Liew, C.C. Novel blood biomarkers of human urinary bladder cancer. Clin. Cancer Res. 2006, 12, 3374–3380.
[CrossRef] [PubMed]J. Clin. Med. 2019, 8, 257 9 of 9
27. Kalinich, M.; Bhan, I.; Kwan, T.T.; Miyamoto, D.T.; Javaid, S.; LiCausi, J.A.; Milner, J.D.; Hong, X.; Goyal, L.;
Sil, S.; et al. An RNA-based signature enables high specificity detection of circulating tumor cells in
hepatocellular carcinoma. Proc. Natl. Acad. Sci. USA 2017, 114, 1123–1128. [CrossRef] [PubMed]
28. Guo, M.; Li, X.; Zhang, S.; Song, H.; Zhang, W.; Shang, X.; Zheng, Y.; Jiang, H.; Lv, Q.; Jiang, Y.; et al. Real-time
quantitative RT-PCR detection of circulating tumor cells from breast cancer patients. Int. J. Oncol. 2015, 46,
281–289. [CrossRef]
29. Biscolla, R.P.; Cerutti, J.M.; Maciel, R.M. Detection of recurrent thyroid cancer by sensitive nested
reverse transcription-polymerase chain reaction of thyroglobulin and sodium/iodide symporter messenger
ribonucleic acid transcripts in peripheral blood. J. Clin. Endocrinol. Metab. 2000, 85, 3623–3627. [CrossRef]
30. Lacroix, L.; Lazar, V.; Michiels, S.; Ripoche, H.; Dessen, P.; Talbot, M.; Caillou, B.; Levillain, J.P.;
Schlumberger, M.; Bidart, J.M. Follicular thyroid tumors with the PAX8-PPARgamma1 rearrangement
display characteristic genetic alterations. Am. J. Pathol. 2005, 167, 223–231. [CrossRef]
31. Lazar, V.; Bidart, J.M.; Caillou, B.; Mahé, C.; Lacroix, L.; Filetti, S.; Schlumberger, M. Expression of the Na+/I-
symporter gene in human thyroid tumors: A comparison study with other thyroid-specific genes. J. Clin.
Endocrinol. Metab. 1999, 84, 3228–3234. [CrossRef]
32. Bernet, V.J.; Anderson, J.; Vaishnav, Y.; Solomon, B.; Adair, C.F.; Saji, M.; Burman, K.D.; Burch, H.B.;
Ringel, M.D. Determination of galectin-3 messenger ribonucleic Acid overexpression in papillary thyroid
cancer by quantitative reverse transcription-polymerase chain reaction. J. Clin. Endocrinol. Metab. 2002, 87,
4792–4796. [CrossRef]
33. Larionov, A.; Krause, A.; Miller, W. A standard curve based method for relative real time PCR data processing.
BMC Bioinform. 2005, 6, 62. [CrossRef] [PubMed]
34. Cardinale, M.; Brusetti, L.; Quatrini, P.; Borin, S.; Puglia, A.M.; Rizzi, A.; Zanardini, E.; Sorlini, C.; Corselli, C.;
Daffonchio, D. Comparison of different primer sets for use in automated ribosomal intergenic spacer analysis
of complex bacterial communities. Appl. Environ. Microbiol. 2004, 70, 6147–6156. [CrossRef] [PubMed]
35. Ciarloni, L.; Hosseinian, S.; Monnier-Benoit, S.; Imaizumi, N.; Dorta, G.; Ruegg, C.; Group, D.-C.-S. Discovery
of a 29-gene panel in peripheral blood mononuclear cells for the detection of colorectal cancer and adenomas
using high throughput real-time PCR. PLoS ONE 2015, 10, e0123904. [CrossRef] [PubMed]
36. Wu, Y.Y.; Hwang, Y.T.; Perng, W.C.; Chian, C.F.; Ho, C.L.; Lee, S.C.; Chang, H.; Terng, H.J.; Chao, T.Y. CPEB4
and IRF4 expression in peripheral mononuclear cells are potential prognostic factors for advanced lung
cancer. J. Formos. Med. Assoc. 2017, 116, 114–122. [CrossRef]
37. Ross, R.W.; Galsky, M.D.; Scher, H.I.; Magidson, J.; Wassmann, K.; Lee, G.S.; Katz, L.; Subudhi, S.K.;
Anand, A.; Fleisher, M.; et al. A whole-blood RNA transcript-based prognostic model in men with
castration-resistant prostate cancer: A prospective study. Lancet Oncol. 2012, 13, 1105–1113. [CrossRef]
38. Dumeaux, V.; Ursini-Siegel, J.; Flatberg, A.; Fjosne, H.E.; Frantzen, J.O.; Holmen, M.M.; Rodegerdts, E.;
Schlichting, E.; Lund, E. Peripheral blood cells inform on the presence of breast cancer: A population-based
case-control study. Int. J. Cancer 2015, 136, 656–667. [CrossRef] [PubMed]
39. Coussens, L.M.; Werb, Z. Inflammation and cancer. Nature 2002, 420, 860–867. [CrossRef] [PubMed]
© 2019 by the authors. Licensee MDPI, Basel, Switzerland. This article is an open access
article distributed under the terms and conditions of the Creative Commons Attribution
(CC BY) license (http://creativecommons.org/licenses/by/4.0/).You can also read