Prognostic significance of CD8+ T cells density in stage III colorectal cancer depends on SDF 1 expression - Nature
←
→
Page content transcription
If your browser does not render page correctly, please read the page content below
www.nature.com/scientificreports
OPEN Prognostic significance of CD8+
T‑cells density in stage III colorectal
cancer depends on SDF‑1
expression
Alexandros Lalos1,7*, Ali Tülek1,7, Nadia Tosti2, Robert Mechera1, Alexander Wilhelm1,
Savas Soysal1, Silvio Daester1,3, Venkatesh Kancherla2, Benjamin Weixler4,
Giulio C. Spagnoli5, Serenella Eppenberger‑Castori2, Luigi Terracciano2,
Salvatore Piscuoglio2,6, Markus von Flüe1,6, Alberto Posabella1,8 & Raoul A. Droeser1,8*
Since colorectal cancer (CRC) remains one of the most common malignancies, a tremendous amount
of studies keep taking place in this field. Over the past 25 years, a notable part of the scientific
community has focused on the association between the immune system and colorectal cancer. A
variety of studies have shown that high densities of infiltrating CD8+ T-cells are associated with
improved disease-free and overall survival in CRC. Stromal cell-derived factor-1 (SDF-1) is a protein
that regulates leukocyte trafficking and is variably expressed in several healthy and malignant
tissues. There is strong evidence that SDF-1 has a negative prognostic impact on a variety of solid
tumors. However, the existing data do not provide sufficient evidence that the expression of SDF-1
has an influence on CRC. Knowing nowadays, that the microenvironment plays a crucial role in
the development of cancer, we hypothesized that the expression of SDF-1 in CRC could influence
the prognostic significance of CD8+ T-cells, as an indicator of the essential role of the immune
microenvironment in cancer development. Therefore, we explored the combined prognostic
significance of CD8+ T-cell density and SDF-1 expression in a large CRC collective. We analyzed a
tissue microarray of 613 patient specimens of primary CRCs by immunohistochemistry (IHC) for the
CD8 + T-cells density and the expression of SDF-1 by tumor cells and tumor-infiltrating immune cells.
Besides, we analyzed the expression of SDF-1 at the RNA level in The Cancer Genome Atlas cohort.
We found that the combined high CD8+ T-cell infiltration and expression of SDF-1 shows a favorable
5-year overall survival rate (66%; 95% CI 48–79%) compared to tumors showing a high expression of
CD8+ T-cell only (55%; 95% CI 45–64%; p = 0.0004). After stratifying the patients in nodal negative
and positive groups, we found that the prognostic significance of CD8+ T-cell density in nodal positive
colorectal cancer depends on SDF-1 expression. Univariate and multivariate Hazard Cox regression
survival analysis considering the combination of both markers revealed that the combined high
expression of SDF-1 and CD8+ T-cell density was an independent, favorable, prognostic marker for
overall survival (HR = 0.34, 95% CI 0.17–0.66; p = 0.002 and HR = 0.45, 95% CI 0.23–0.89; p = 0.021,
respectively). In our cohort there was a very weak correlation between SDF-1 and CD8+ T-cells
(rs = 0.13, p = 0.002) and in the trascriptomic expression of these two immune markers display a weak
correlation (rs = 0.28, p < 0.001) which was significantly more pronounced in stage III cancers (rs = 0.40,
p < 0.001). The combination of high CD8+ T-cell density and expression of SDF-1 represents an
independent, favorable, prognostic condition in CRC, mostly in patients with stage III disease.
1
University Center for Gastrointestinal and Liver Diseases, Clarunis, University of Basel, Basel,
Switzerland. 2Institute of Pathology and Medical Genetics, University Hospital Basel, Basel,
Switzerland. 3Department of Colorectal Surgery, Royal Prince Alfred Hospital, Sydney, Australia. 4Department of
Surgery, Charité University Hospital, Campus Benjamin Franklin, Berlin, Germany. 5Department of Biomedicine,
University Hospital Basel, Basel, Switzerland. 6Visceral Surgery Research Laboratory, Clarunis, Department
of Biomedicine, University of Basel, Basel, Switzerland. 7These authors contributed equally: Alexandros Lalos
and Ali Tülek. 8These authors jointly supervised this work: Alberto Posabella and Raoul A. Droeser. *email:
alexandroslalos7@gmail.com; RaoulAndre.Droeser@clarunis.ch
Scientific Reports | (2021) 11:775 | https://doi.org/10.1038/s41598-020-80382-2 1
Vol.:(0123456789)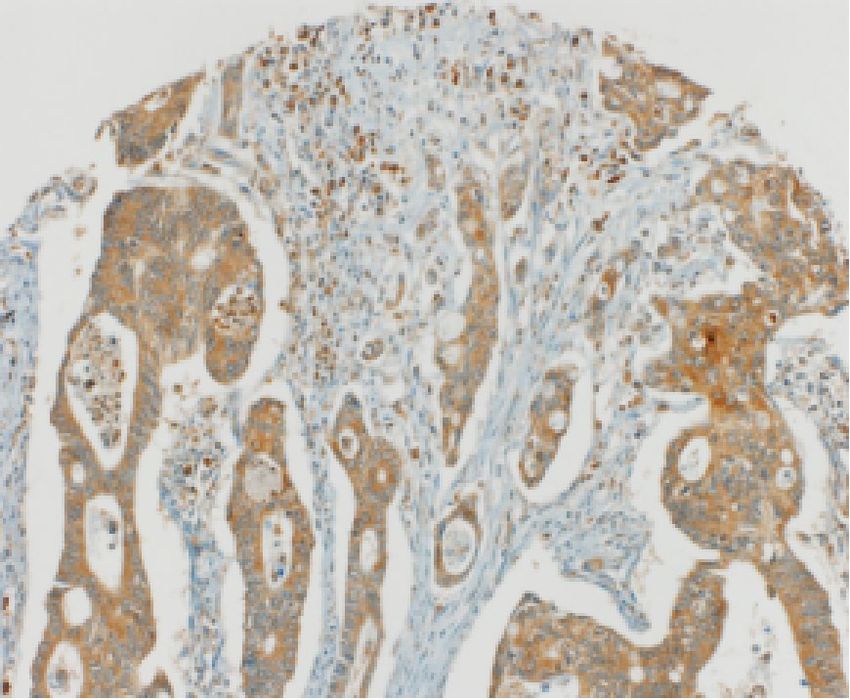
www.nature.com/scientificreports/
Colorectal cancer (CRC) is the third most common malignancy to be diagnosed. Furthermore, CRC remains
the second most common cause of death from cancer worldwide, despite the screening and new methods of
treatment1,2. These facts explain why so many studies have taken place to identify the mechanisms of CRC
development. Understanding these features could lead to new concepts in the approach of diagnosis, prognosis,
and even treatment of CRC.
As with the majority of cancers, the Tumor Node Metastasis (TNM) classification serves as the gold standard
tool for the staging of CRC3. By every newly diagnosed CRC, an interdisciplinary team of specialists in several
fields (Visceral Surgery, Oncology, Gastroenterology, Radiology/Nuclear Medicine, Radiation Oncology and
Pathology) takes into account the TNM classification to determine the treatment. According to this system,
we decide which patients are suitable for surgical resection, which are candidates for adjuvant chemotherapy
following the resection of the primary tumor and which are palliative c ases4,5. However, we repeatedly observe
that patients with identical stages and treatments have a completely different outcome in terms of survival and
recurrence. This fact indicates that TNM classification alone in the vast majority of cases is not sufficient for
the prognosis of colorectal cancer6,7. Subsequently, an enormous amount of studies have investigated and still
investigate other features, which could be an excellent additional tool for this classification. The crucial role of
the microenvironment in CRC was thoroughly explored and showed that the high immune cell infiltration by
cytotoxic CD8+ T-cells and memory CD45RO+ T-cells has a favorable prognostic s ignificance8–12.
CD8 (cluster of differentiation 8) is a well-known protein that serves as a co-receptor for the T-cell receptor
(TCR) and binds to the major histocompatibility complex (MHC) molecule13. When the cytotoxic T cells are
combined with CD8 surface protein, produce the CD8+ T cells and play a vital role in antigen recognition. Naito
et al.14 proved that the infiltration of tumors with CD8+ T-cells has a beneficial prognostic influence in CRC.
Since then, a substantial number of studies have also examined the role of CD8+ T-cells, and nowadays, the
scientific society has accepted its positive prognostic impact on CRC15–19. These results highlight the fact that
the infiltration of the tumor with CD8+ T-cells is associated with a better prognosis not only in CRCs but also
in other malignancies such as lung20, renal21 and e ndometrial22.
Following these positive and promising results, various immune markers were investigated with the aim
of finding a better and more sufficient way to evaluate the prognosis of CRC. The stromal cell-derived factor 1
(SDF-1) is a chemokine protein, which is strongly chemotactic for l ymphocytes23. SDF-1 and one of its receptors,
CXCR4, have been shown to play a crucial role in the tumor-stromal communication affecting cancer growth,
angiogenesis, and metastasis formation24. Samarenda et al. performed a meta-analysis of 38 studies that evaluated
the association between SDF-1 expression and cancer survival. The authors showed that a high SDF-1 expression
was associated with significantly reduced overall survival in patients with lung, pancreatic, and esophagus-gastric
cancer. Yet, there was no correlation between SDF-1 expression and overall survival in colorectal c ancer25.
Taking these facts into account, we conducted this study in order to evaluate the prognostic significance of
these two markers alone and in combination. We hypothesized that the expression of SDF-1 could influence the
prognostic significance of CD8+ T-cell density. The secondary aim of the study was to explore thoroughly the
interaction between the different particles of the immune microenvironment in CRC26–29.
Methods
Tissue microarray construction. In our study, we included 613 patients with unselected, clinically anno-
tated primary CRC specimens in a tissue microarray (TMA). Our study had the approval of the local ethics
committee (Ethikkommission Nordwest- und Zentralschweiz). All methods were carried out in accordance with
relevant guidelines and regulations. As far as it concerns the technique used for the TMA construction, we have
described this in previous studies of our team30. The TMAs were constructed by the specialists of the Pathology
Biobank at the University Hospital of Basel (Basel, Switzerland). Unselected, nonconsecutive, formalin-fixed,
paraffin-embedded primary colorectal cancer tissue blocks were used as donor blocks. Tissue cylinders with a
diameter of 1 mm were punched from morphologically representative areas of each donor block and brought
into one recipient paraffin block (30 × 25 mm). Each punch was derived from the center of the tumor in an area
with no necrosis so that each TMA spot consisted of more than 50% tumor cells.
Clinico‑pathological features. Clinico-pathological data were collected retrospectively in a non-strati-
fied and random manner. Annotation included patient age and gender, tumor diameter in mm, site of the tumor,
pT-stage, pN-stage, grade, stage according to TNM-classification, tumor border configuration (infiltrative vs
pushing), vascular invasion, overall survival time (months), 5-years survival in % (95% CI) and the presence
of peri-tumoral lymphocytic inflammation at the invasive tumor front (Table 1). Tumor border configuration
and peri-tumoral lymphocytic inflammation were evaluated using the original hematoxylin–eosin slides of the
resection specimens corresponding to each TMA punch.
Immunohistochemistry. We used standard indirect immunoperoxidase procedures (IHC; ABC-Elite,
Vector Laboratories, Burlingame, CA) as we have already described in previous studies of our team31. Our spe-
cialists dewaxed and rehydrated slides in distilled water. Afterward, endogenous peroxidase activity was blocked
using 0.5% H2O2. Sections were incubated with 10% normal goat serum (DakoCytomation, Carpinteria, CA)
for 20 min and incubated with primary antibody at room temperature. We used primary antibodies that were
specific for CD8 (Ventana 790-4460) and SDF-1 (Abcam ab9797). Subsequently, these parts were incubated with
peroxidase-labeled secondary antibody (DakoCytomation) for 30 min at room temperature. For visualization of
the antigen, these parts were immersed in 3-amino-9-ethylcarbazole plus substrate-chromogen (DakoCytoma-
tion) for 30 min and counterstained with Gill’s hematoxylin.
Scientific Reports | (2021) 11:775 | https://doi.org/10.1038/s41598-020-80382-2 2
Vol:.(1234567890)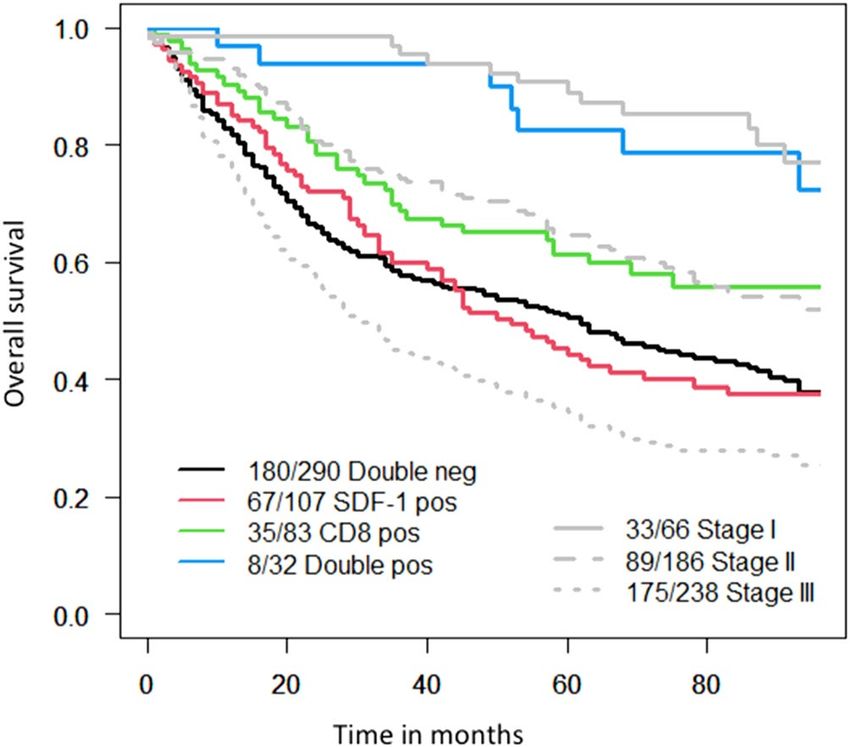
www.nature.com/scientificreports/

                                   Characteristics                       N or mean   (% or range)
                                   Age, years (median, mean)             70, 68.9    36–96
                                   Tumor size in mm (median, mean)       50, 50.1    4–160
                                   Sex
                                   Female                                326         53.2
                                   Male                                  287         46.8
                                   Anatomic site of the tumor
                                   Left-sided                            428         69.8
                                   Right-sided                           183         29.9
                                   Missing values                        2           0.3
                                   T stage
                                   T1                                    31          5.1
                                   T2                                    83          13.5
                                   T3                                    406         66.2
                                   T4                                    79          12.9
                                   Missing values                        14          2.3
                                   N stage
                                   N0                                    317         51.7
                                   N1                                    160         26.1
                                   N2                                    119         19.4
                                   Missing values                        17          2.8
                                   Tumor grade
                                   G1                                    14          2.3
                                   G2                                    552         90.0
                                   G3                                    33          5.4
                                   Missing values                        14          2.3
                                   UICC TNM classification
                                   Stage I                               84          13.7
                                   Stage II                              227         37.0
                                   Stage III                             279         45.5
                                   Missing values                        17          3.8
                                   Tumor border configuration
                                   Infiltrative                          417         68.0
                                   Pushing                               180         29.4
                                   Missing values                        16          2.6
                                   Vascular invasion
                                   No                                    425         69.3
                                   Yes                                   174         28.4
                                   Missing values                        14          2.3
                                   Microsatellite stability
                                   Proficient                            539         87.9
                                   Deficient                             74          12.1
                                   Rectal cancers                        246         40.1
                                   Rectosigmoid cancers                  44          7.2
                                   Overall survival time (months)        58.4        0–152
                                   5-years survival % (95%CI)            0.47        0.43—0.51
                                   CXCR4 histoscore                      156.5       0—300
                                   pCXCR4 histoscore                     32.2        0—300
                                   CXCR4 TIC                             74.2        0—1000
                                   pCXCR4 TIC                            4.8         0—79

                                  Table 1.  Characteristics of CRC patient cohort (n = 613). Age and tumor size were evaluated using the
                                  Kruskal–Wallis test. Gender, anatomical site, T stage, N stage, grade, vascular invasion, and tumor border
                                  configuration were analyzed using the χ2 test. Survival analysis was performed using the Kaplan–Meier
                                  method.

Scientific Reports |   (2021) 11:775 |                        https://doi.org/10.1038/s41598-020-80382-2                                        3

                                                                                                                                           Vol.:(0123456789)
www.nature.com/scientificreports/
Evaluation of immunohistochemistry. Two trained research fellows [A.L. and A.T.] performed immu-
nohistochemical analysis, and an experienced pathologist [L.T.] validated the date independently. Histoscores
for expression by tumor cells were obtained by multiplying percentages of positive cells by staining intensities
(0 = negative, 1 = weak, 2 = moderate, 3 = strong). Tumor-infiltrating immune cells (TICs) were counted for each
punch (approximately one high power [20 ×] field).
Public database analysis. Correlations using the RNA-sequencing from The Cancer Genome Atlas
(TCGA) were performed. Briefly, colorectal cancer clinical information available for 597 patients was retrieved
from the Human Protein Atlas database [https://www.proteinatlas.org/ENSG00000132688-NES/pathology/
tissue/colorectal+cancer]. Gene Expression levels (FPKM values) for the genes were downloaded using TCGA-
biolinks R package.
Statistical analysis. We explored associations with survival using the Cox proportional hazard regression
model. Cut-off values used to classify CRC with low or high immune cell infiltration were available from previ-
ous publications32 or generated by applying regression tree analysis. Threshold value for CD8+ was 10 cells/
TMA-punch. Threshold value for SDF-1 histoscore was 200 (= 75th percentile). Chi-square, Fisher’s exact, and
Kruskal–Wallis tests were used to determine the association of SDF-1 tumor expression and CD8+ T-cell infil-
tration and clinical-pathological features.
For survival analysis, the study population was randomly subset into a test and a validation group. Further-
more, in order to get more information we furtherly stratified the patients according to their tumor stage. The
Kaplan–Meier survival curves were compared accordantly to the log-rank test. Further, analysis included all four
combinations possible (SDF-1high/CD8 + high, SDF-1high/CD8 + low, SDF-1low/CD8 + high, SDF-1low/CD8 + low) and the
resulting Kaplan–Meier curves were compared pairwise and the p-value was adjusted for multiple comparisons
according to the Benjamini and Hochberg (1995).
The assumption of proportional hazards was verified for all markers by analyzing correlation of Schoenfeld
residuals and ranks of individual failure times. Any missing clinicopathological information was assumed to be
missing at random. Subsequently, SDF-1 expression and CD8 + cell density data were entered into multivariate
Cox regression analysis and hazard ratios (HR) and 95% confidence intervals (CI) were used to determine prog-
nostic effects on survival time. P values < 0.05 were considered statistically significant. Statistical analyses were
made using STATA software version 13 (StataCorp, College Station, TX, USA) and with the Statistical Package
Software R (version 4.0.2, http//.r-project.org).
Ethics approval and consent to participate. Our study was reviewed and approved by Ethics Commit-
tee of Basel, EKBB, number EKBB 361/12. The patients/participants provided their written informed consent to
participate in this study.
Consent for publication. The consent was waived by the ethics committee (Ethikkommission Nordwest-
und Zentralschweiz).
Results
Patient and tumor characteristics. In our study we included 613 patients with CRC with a median age
of 70 years (range 36–96). 53.2% of the patients were female. In 70% of the patients CRC was located in the left
hemicolon or rectum and in the remaining 30% in the right hemicolon. According to the TNM-classification,
most of the tumors were of pT3/pT4 stage (n = 485), with the minority of cancers being pT1/pT2 (n = 114).
Among the malignancies under evaluation, 317 were pN0, 160 pN1, and 119 pN2 cases. Tumor grade was G1
in 14 cases, G2 in 552 cases, and G3 in 33 cases. Furthermore 417 showed infiltrating tumor border configu-
ration, while in the majority of cases (n = 425) vascular invasion was absent. Most of the tumors belonged to
the microsatellite stable subgroup (n = 539). Within the follow-up period, median disease-specific survival was
58.4 months (range 0–152), while mean 5-year-survival was 47% (95% CI 43–51%). In Table 1, we summarized
the clinico-pathological characteristics of these patients.
Association of clinicopathological features with SDF‑1 expression and CD8+ T cell density. In
Fig. 1, we illustrate 2 representative pictures of low and high expression of SDF-1 in biopsies with high CD8 + T-cell
infiltration in CRC. Furthermore, we created a table, that demonstrates the clinicopathological features under
investigation and their relation to the four subgroups identified by SDF-1 expression and CD8 + T-cell density
(SDF-1high/CD8 + high, SDF-1high/CD8 + low, SDF-1low/CD8 + high, SDF-1low/CD8 + low) as absolute numbers and
percentages (Table 2). As it is presented in our study, we observed that cases with SDF-1high/CD8 + high were
characterized by a significantly lower N-stage (p < 0.001) in comparison to the cases with SDF-1high/CD8 + low. In
contrast, we demonstrated that T stage, tumor grade and vascular invasion did not significantly differ in CRC
with different immune environment profiles.
Furthermore, the nature of tumor border (pushing vs. infiltrating) has been reported to impact on CRC
prognosis, with the infiltrating tumor border being associated with poor s urvival32. In our cohort, infiltrating
tumor border was detected with significantly (p = 0.014) higher frequency in tumors with low density of the
CD8 + T-cells. Interestingly, we detected a strong tendency towards statistical significance (p = 0.051) regarding
the presence of PTL inflammation, which was higher in the group of SDF-1high/CD8 + high in contrast to SDF-
1high/CD8 + low. This fact highlights the importance of the microenvironment and supports the hypothesis of
an effective antigen-specific immune response. However, this can only be considered as a trend with a p > 0.05.
Scientific Reports | (2021) 11:775 | https://doi.org/10.1038/s41598-020-80382-2 4
Vol:.(1234567890)www.nature.com/scientificreports/
A B
Picture A Picture B
Figure 1. Examples of high SDF-1 expression (A) and low SDF-1 expression (B) in CRC biopsies with high
CD8+ T-cell infiltration (× 200 magnification).
Spearman’s correlation analysis of SDF‑1, CD8 + T‑cell and markers of the microenviron-
ment. In order to understand better the microenvironment in the context of SDF-1 expression and CD8+
T-cell density we performed a Spearman’s correlation analysis with a panel of immune, cell signaling mark-
ers or growth factors on protein (TMA data; Table 3) and considered correlations above 0.35 to be relatively
strong, correlations between 0.15 and 0.35 to be moderate, and those below 0.15 to be weak. Finally, SDF-1
tumor expression moderately correlated with CXCR4 tumor expression. SDF-1 expression by tumor-infiltrating
immune cells (TIC) showed a strong correlation with CXCR4 positive TIC and a moderate correlation with CD8
T-cell density as well as pCXCR4 positive TIC on a protein level (Table 3).
Synergistic prognostic significance of CD8+ T‑cell density and expression of SDF‑1 in the CRC
microenvironment. The 5-years survival rates were significantly different depending on the nature of
immune infiltration (Table 2). Most importantly, Kaplan–Meier plots clearly indicated that 5-year survival rate
was significantly better in cases of CRC with high expression on SDF-1 and CD8+ T-cell infiltration compared
to tumors showing a high infiltration of CD8+ T-cells only 66% (95% CI 48–79%) versus 55% (95% CI 45–64%);
p = 0.0004. In order to clarify the differences between all four groups, we calculated pairwise for each two curves
the log rank p values and also took into account the multiple testing according to the Benjamini and Hochberg
method. After performing a separate analysis we came to the following results Fig. 2.
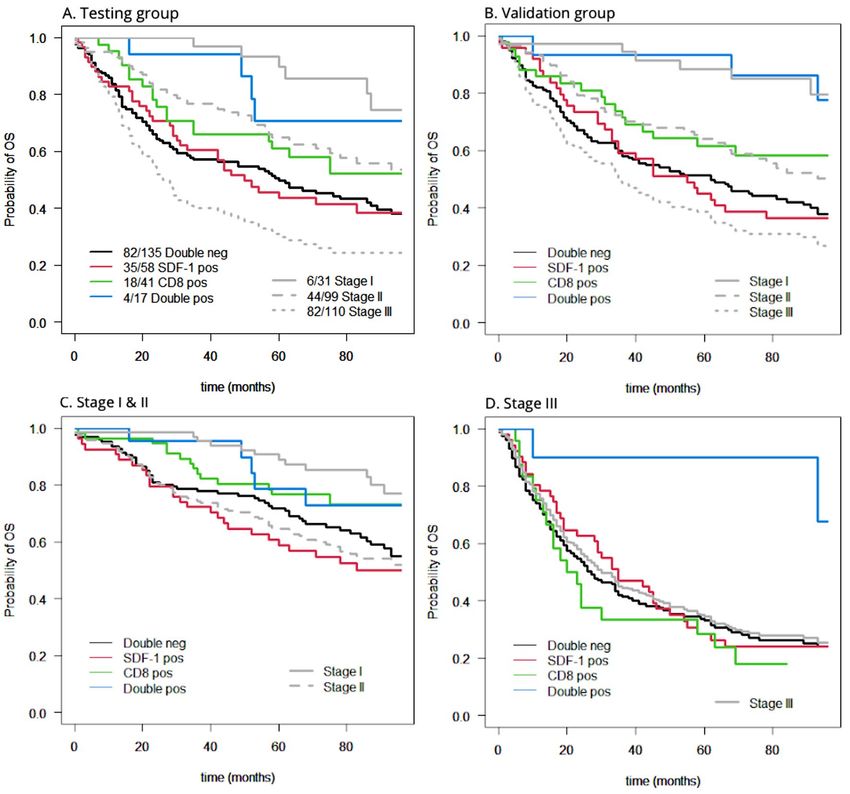
Furthermore, we divided randomly our cohort in two groups, a testing group and validation group that also
showed this difference between the groups (Fig. 3A, B). Since the patients with positive lymph nodes are associ-
ated with a worse prognosis, we also stratified the patients according to the nodal status (Fig. 3C, D). Interest-
ingly, we found that the synergistic prognostic effect of CD8+ T-cells and SDF-1 was mainly present in the nodal
positive group (Stage III) with a p value of 0.009.
Univariate and multivariate analysis of SDF‑1 expression and CD8+ T‑cell infiltration by tumor
cells and tumor‑infiltrating immune cells. Univariate Cox regression analysis revealed that the combi-
nation of high expression of SDF-1 and high CD8 + T cell infiltration is significantly associated with an increased
overall survival (HR = 0.34; 95% CI 0.17–0.66; p = 0.002). Age, male gender, tumor grade, T-stage, N-stage, inva-
sive margin and vascular invasion were all significantly associated with a poor prognosis in univariate analyses
(Table 4).
In a multivariate Hazard Cox regression survival analysis the combined high expression of SDF-1 and high
CD8 + T-cell infiltration in CRC succeeded to retain its role as an independent prognostic factor for overall
survival (HR = 0.45, 95% CI 0.23–0.89; p = 0.021). Moreover, we found that an increased age (HR = 1.04; 95% CI
1.03–1.05; p < 0.001), male gender (HR = 1.61; 95% CI 1.28–2.02; p < 0.001), a higher T-stage (HR = 2.41; 95%
CI 1.57–3.71; p = 0.001), N-stage (HR = 2.36; 95% CI 1.84–3.02; p < 0.001), vascular invasion (HR = 1.99; 95% CI
1.56–2.53; p < 0.001) and invasive margin (HR = 1.41; 95% CI 1.06–1.88; p = 0.017) were independently associ-
ated with a poor prognosis (Table 4).
Discussion
A significant amount of studies showed that the infiltration of CRC by CD8+ T-cells represents a favorable prog-
nostic factor for the clinical outcome. Since then, more and more scientists are exploring the role of the microen-
vironment and immune response in the development of m alignancies11–20. A great variety of immunocompetent
cells, cytokines, and chemokines are currently investigated. Our team has already tested some of these factors in
Scientific Reports | (2021) 11:775 | https://doi.org/10.1038/s41598-020-80382-2 5
Vol.:(0123456789)www.nature.com/scientificreports/
SDF-1high/CD8 + high SDF-1high/CD8 + low SDF-1low/CD8 + high SDF-1low/CD8 + low
N = 35 (100%) N = 121 (100%) N = 98 (100%) N = 359 (100%) p value
Age
Years, mean ± SD 68.5 ± 10.6 69.4 ± 10.9 67.6 ± 12.0 69.1 ± 11.0 0.751
Tumor diameter
mm, mean ± SD 53.2 ± 14.2 48.2 ± 16.1 52.5 24.4 49.9 ± 20.2 0.253
Gender
Female 25 71.4 60 49.6 52 53.1 189 52.6
Male 10 28.6 61 50.4 46 46.9 170 47.4 0.146
Tumor location
Left-sided 23 65.7 97 80.2 64 65.3 244 67.9 0.046
Right-sided 12 34.3 24 19.8 33 33.7 114 31.8
Missing values 0 0.0 0 0.0 1 1.0 1 0.3
Histologic subtype
Mucinous 2 5.7 3 2.5 3 3.1 22 6.1 0.292
Non-mucinous 33 94.3 118 97.5 95 96.9 337 93.9
pT stage
pT1-2 9 25.7 23 19.0 23 23.5 59 16.4 0.177
pT3-4 24 68.6 96 79.3 70 71.4 295 82.2
Missing values 2 5.7 2 1.7 5 5.1 5 1.4
pN stage
pN0 23 65.7 61 50.4 67 68.4 166 46.2 < 0.001
pN1-2 12 34.3 57 47.1 27 27.5 183 51.0
Missing values 0 0.0 3 2.5 4 4.1 10 2.8
Tumor grade
G1 0 0.0 2 1.7 2 2.0 10 2.8 0.097
G2 32 91.4 112 92.5 79 80.6 329 91.6
G3 1 2.9 5 4.1 12 12.3 15 4.2
Missing values 2 5.7 2 1.7 5 5.1 5 1.4
Vascular invasion
Absent 26 74.3 88 72.7 67 68.4 244 68.0 0.559
Present 7 20.0 31 25.6 26 26.5 110 30.6
Missing values 2 5.7 2 1.7 5 5.1 5 1.4
Tumor border
Pushing 13 37.1 37 30.6 39 39.8 91 25.4 0.014
Infiltrating 20 57.2 82 67.7 54 55.1 261 72.7
Missing values 2 5.7 2 1.7 5 5.1 7 1.9
PTL inflammation
Absent 20 57.2 94 77.7 67 68.4 282 78.5 0.051
Present 13 37.1 25 20.6 26 26.5 72 20.1
Missing values 2 5.7 2 1.7 5 5.1 5 1.4
Microsatellite stability
Deficient 3 8.6 5 4.1 18 18.4 48 13.4 0.004
Proficient 32 91.4 116 95.9 80 81.6 311 86.6
5-year survival rate
(95% CI) 0.66 (0.48–0.79) 0.40 (0.310.48) 0.55 (0.45–0.64) 0.45 (0.40–0.50) 0.0004
CXCR4 histoscore
mean ± SD 203.5 ± 100.2 177.3 ± 95.5 152.9 ± 94.4 143.6 ± 99.7 0.001
CXCR4 TIC
mean ± SD 50.7 ± 62.3 53.5 ± 130.7 121.9 ± 208.8 70.7 ± 145.8 0.016
pCXCR4 histoscore
mean ± SD 76.3 ± 97.3 32.4 ± 64.2 54.1 ± 81.8 20.9 ± 49.2 0.0002
pCXCR4 TIC
mean ± SD 6.2 ± 9.1 4.3 ± 10.4 7.6 ± 14.0 4.0 ± 6.8 0.001
Table 2. Association of SDF-1 + tumor expression and CD8+ low and high immune cell density with
clinicopathological features in CRC (n = 613). Variables are indicated as absolute numbers, %, median or range;
age and tumor size were evaluated using the Kruskal–Wallis test. Gender, anatomical site, T stage, N stage,
grade, vascular invasion, and tumor border configuration were analyzed using the χ2 test. Survival analysis was
performed using the Kaplan–Meier method. Significant p values are bold.
Scientific Reports | (2021) 11:775 | https://doi.org/10.1038/s41598-020-80382-2 6
Vol:.(1234567890)www.nature.com/scientificreports/
SDF-1 + tumor CXCR4 tumor pCXCR4 tumor pCXCR4
expression SDF-1 + TIC CD8 expression expression CXCR4 + TIC TIC
SDF-1 + tumor
1.000
expression
− 0.1143
SDF-1 + TIC 1.0000
0.0149
− 0.0359 0.1648
CD8 1.0000
0.4455 0.0004
CXCR4 tumor 0.1864 0.0571 0.1244
1.0000
expression 0.0001 0.2252 0.0080
pCXCR4 tumor 0.0296 − 0.0245 0.2601 0.2764
1.0000
expression 0.5291 0.6035 0.0000 0.0000
− 0.0957 0.3752 0.2128 0.1174 0.1020
CXCR4 + TIC 1.0000
0.0418 0.0000 0.0000 0.0124 0.0300
− 0.0806 0.1572 0.2034 0.1131 0.2725 0.3706
pCXCR4 + TIC 1.0000
0.0865 0.0008 0.0000 0.0160 0.0000 0.0000
Table 3. Spearman’s correlation analysis of SDF-1 protein expression with CXCR4, pCXCR4 and CD8.
Figure 2. Kaplan–Meier survival curves of the overall cohort with the pairwise comparisons between the
different curves. Effects of combined high CD8+ T-cell density and SDF-1 tumor expression on overall survival
in patients with CRC. Kaplan–Meier overall survival curves were designed according to SDF-1 tumor expression
and CD8+ cell density in patients bearing CRC as indicated. Cut-off values established by regression tree
analysis were 200 for SDF-1 and 10 cells/punch for CD8+ cell infiltration30–32. Cumulative effects of SDF-1
expression and CD8+ cell density were explored. Black line indicates tumors with low CD8+ T-cell density
and low SDF-1 expression. Red line refers to tumors with low CD8+ T-cell density and high SDF-1 expression.
Green line indicates tumors with high CD8+ T-cell density and low SDF-1 expression. Blue line refers to tumors
with high CD8+ T-cell density and high SDF-1 expression. In each curve is also represented in the background
the overall survival according to the stage (light grey). Stage I is represented with a solid line, stage II with a
dashed line and stage III with a dotted line. The pairwise comparisons between the different curves showed the
following p-values: SDF-1negative/CD8negative(black) versus SDF-1negative/CD8positiv(green) p = 0.015. SDF-1negative/
CD8negative(black) versus SDF-1positive/CD8negative(red) p = 0.89. SDF-1negative/CD8negative(black) versus SDF-1positive/
CD8positiv(blue) p = 0.001. SDF-1positive/CD8negative(red) versus SDF-1negative/CD8positiv(green) p = 0.020. SDF-1positive/
CD8negative(red) versus SDF-1positive/CD8positiv(blue) p = 0.001. SDF-1negative/CD8positive (green) versus SDF-1positive/
CD8positiv(blue) p = 0.065.
previous studies34–36. Furthermore, a study of Pagès et al.44 from May 2018 showed that the Immunoscore could
determine the risk of recurrence in patients with colon cancer.
Among other immune markers, several studies have investigated the expression of SDF-1 and its role in
tumor immunobiology. However, these studies came to conflicting data. Some of them showed that the high
expression of SDF-1 is associated with reduced overall survival in patients with lung, pancreatic, and esophagus-
gastric cancer. In contrast to these results, it was observed that in breast cancer, the high expression of SDF-1
Scientific Reports | (2021) 11:775 | https://doi.org/10.1038/s41598-020-80382-2 7
Vol.:(0123456789)www.nature.com/scientificreports/
Figure 3. Kaplan–Meier overall survival curves according to CD8+ T-cell density and SDF-1 expression after
stratifying the patients in testing and validation groups as well as in nodal negative and nodal positive groups.
Kaplan–Meier overall survival curves after stratifying the patients in testing and validation groups as well as
in nodal negative and nodal positive groups. (A) (Testing group): in this group the overall p value is 0.040 and
the survival of patients with double positive markers is the only one, which (almost) reaches p values < 0.05 in
comparison to the case with negative CD8+ T-cells. (B) (Validation group): Here the overall p value is 0.009. The
survival of patients with double positive markers is the only one that reaches p values < 0.05 in comparison to the
case with negative CD8+ T-cells. (C) (Stage I&II): No combination reaches the adjusted for multiple comparison
p values < 0.05, even though overall p is 0.04. (D) (Stage III): With an overall p value of 0.02, the combination of
high density of CD8+ T-cells and high expression of SDF-1 has an outstanding positive impact in the survival of
patients with CRC at stage III.
was associated with increased overall survival37–40. In the case of colorectal cancer, there is a high heterogeneity
across existing s tudies26–29.
Some of the cells that produce SDF-1 are the endothelial and bone marrow cells, mucosal epithelial cells,
tumor cells, and T-lymphocytes41. SDF-1 expression is increased in tissues characterized by neo-angiogenesis
and inflammation, supporting chemotactic gradients attracting immune cells. In a previous study of our team,
we investigated the SDF-1-CXCR4 chemokine axis in cell trafficking as well as in tumor p rogression42. In that
study, we showed that the activation of CXCR4, which is suggested by the presence of its phosphorylated form
(pCXCR4), in CRC tumors and in infiltrating immune cells is associated with a significant favorable prognosis.
According to our data, Stanisavljevic et al.29 have also shown that SDF-1 expression represents a favorable prog-
nostic factor for disease-free survival in CRC.
In the presented study we explored these two markers in CRC and investigated the role of each of them alone
and in combination. We found that a better prognosis characterizes CRC showing high CD8+ T-cells density
with high SDF-1 tumor expression in contrast to CRC having high CD8+ T-cell density only, most likely due to
an effective antigen-specific immune response. Knowing that patients with metastatic disease in the lymph nodes
Scientific Reports | (2021) 11:775 | https://doi.org/10.1038/s41598-020-80382-2 8
Vol:.(1234567890)www.nature.com/scientificreports/
Univariate Multivariate
HR 95%CI p value HR 95%CI p value
Age 1.03 1.02 1.04 < 0.001 1.04 1.03 1.05 < 0.001
Gender (male vs female) 1.53 1.23 1.90 < 0.001 1.61 1.28 2.02 < 0.001
pT (high vs low) 3.42 2.32 5.04 < 0.001 2.41 1.57 3.71 < 0.001
pN (high vs low) 3.28 2.61 4.14 < 0.001 2.36 1.84 3.02 < 0.001
Grade (high vs low) 5.31 1.32 21.33 0.019 2.88 0.69 11.95 0.146
Vascular invasion 2.49 1.99 3.12 < 0.001 1.99 1.56 2.53 < 0.001
Invasive margin 1.92 1.48 2.50 < 0.001 1.41 1.06 1.88 0.017
MMR status 1.53 1.07 2.19 0.021 1.32 0.91 1.92 0.149
SDF-1high/CD8 + low 1.09 0.84 1.42 0.526 1.18 0.89 1.55 0.247
SDF-1low/CD8 + high 0.66 0.47 0.92 0.015 0.89 0.62 1.29 0.549
SDF-1high/CD8 + high 0.34 0.17 0.66 0.002 0.45 0.23 0.89 0.021
Table 4. Uni- and multivariate Hazard Cox regression survival analysis considering the combination of both
markers (n = 613 and n = 576, respectively). Multivariate analyses showing Hazard Ratios and p value for all
CRCs (n = 576 less than 613 due to missing values) conferred by SDF-1 expression and CD8 + cell density, age,
sex, tumor size, lymph node involvement, tumor grade, vascular invasion, tumor border configuration and
microsatellite stability33. Significant p values are bold.
have a worse prognosis compared to patients with negative nodes, we stratified our cohort in nodal positive and
nodal negative groups and found that the combination of the two markers had mainly a prognostic impact in
the nodal positive group. Since this group has a much worse prognosis compared to Stages I and II cancers, it is
imperative to find better methods of evaluation and subsequently treatment for this group. Therefore this finding
may help in this direction, since it seems that the combination of high CD8+ T-cells and high SDF-1 expression
is associated with a significantly better prognosis. Our data provide novel insights into the prognostic relevance
of the interaction between the innate and adaptive immune system in CRC microenvironment. Therefore our
results could be the reason to design studies that explore the combination of CD8+ T-cells density with high
expression of SDF-1 in other types of cancer (for example lung, pancreatic and esophagus-gastric cancer), where
current data already showed reduced overall survival in the single marker analysis of SDF-1. For instance, Roy
et al. showed in an experimental model of pancreatic cancer that SDF-1 expression inhibited tumor growth and
cancer cell metastasis formation through cell cycle arrest, resulting in increased overall survival, conflicting the
existing data about SDF-1 expression and prognosis in pancreatic cancer43.
Finally, we were able to identify a panel of immune markers with modest to strong correlation on a gene
expression level (r > 0.39): CD163, MMP2, CD4, CD11b, CD45, CCL21, CD56, CD11c, CD18, MMP9, CD16A,
IL-10, CCL7, CCL19, CCL11, CXCR4, FOXP3, CCL8, CCL23, CD14, CCL18, TGF-beta, CCL13 and T-bet and
we found a strong upregulation of MMP-2, HLA-DR and CD14 in the SDF-1high/CD8 + high group indicating
possibly an effective antigen-specific immune response in this patient subgroup.
When it comes to limitations, we have to begin with the fact that our study is a retrospective one. Never-
theless, by using the data that emerge from extensive retrospective analyses, we may, in the future, be able to
develop prospective studies. Secondary, TMA technology may fail to represent tumor tissue heterogeneity. Yet,
the blocks included in our TMA were derived from tumor centers and included more than 50% of cancer cells.
Additionally, the large number of individual CRC specimens (> 600) may partly compensate for the heterogeneity
of the immune contexture in different tumor areas. Finally, the group investigated in this study includes CRC
patients that were operated between 1985 and 1998. At that time, the use of neoadjuvant therapy was not part
of the treatment of CRC.
Conclusions
Our data show for the first time that the combination of high CD8+ T-cell density with SDF-1 expression rep-
resents an independent, favorable, prognostic condition in nodal positive CRC, thereby shedding new light on
the biological role of CD8+ T-cells and SDF-1 in colorectal cancer progression. With this side, we provide novel
insights into the prognostic role of the immune microenvironment in CRC and raise a number of points, which
might have a significant impact on clinical decision-making. Our finding might help to pave new avenues towards
the development of novel treatment modalities by modifying the tumor immune microenvironment in CRC
patients, especially in the context of personalized medicine.
Data availability
The datasets used and/or analyzed during the current study are available from the corresponding author on
reasonable request.
Received: 5 March 2020; Accepted: 21 December 2020
Scientific Reports | (2021) 11:775 | https://doi.org/10.1038/s41598-020-80382-2 9
Vol.:(0123456789)www.nature.com/scientificreports/
References
1. Siegel, R. L., Miller, K. D. & Jemal, A. Cancer statistics, 2019. CA Cancer J. Clin. 69, 7 (2019) (Epub 2019 Jan 8 PMID: 30620402).
2. Bray, F. et al. Global cancer statistics 2018: GLOBOCAN estimates of incidence and mortality worldwide for 36 cancers in 185
countries. CA Cancer J. Clin. 68(6), 394–424 (2018) (PMID: 30207593).
3. Brierley, J. D., Gospodarowicz, M. K. & Wittekind, C. TNM classification of malignant tumours 8th edn. (Wiley, Hoboken, 2017).
4. Vogel, J. D. et al. The American Society of colon and rectal surgeons clinical practice guidelines for the treatment of colon cancer.
Dis. Colon Rectum 60(10), 999–1017 (2017) (PMID: 28891842).
5. Shi, Q., Paul, J. & Grothey, A. Duration of adjuvant chemotherapy for stage III colon cancer. N. Engl. J. Med. 379(4), 396–397 (2018)
(PMID: 30044940).
6. Quirke, P. et al. The future of the TNM staging system in colorectal cancer: time for a debate?. Lancet Oncol. 8(7), 651–657 (2007)
(Review. PMID: 17613427).
7. Zlobec, I. & Lugli, A. Prognostic and predictive factors in colorectal cancer. J. Clin. Pathol. 61(5), 561–569 (2008) (Epub 2008 Mar
6. Review. PMID: 18326017).
8. Fridman, W. H. et al. The immune contexture in human tumours: impact on clinical outcome. Nat. Rev. Cancer 12, 298–306 (2012)
(PMID: 22419253).
9. Mlecnik, B. et al. Biomolecular network reconstruction identifies T-cell homing factors associated with survival in colorectal
cancer. Gastroenterology 138(4), 1429–1440 (2010) (PMID: 19909745).
10. Mlecnik, B. et al. Histopathologic-based prognostic factors of colorectal cancers are associated with the state of the local immune
reaction. J. Clin. Oncol. 29, 610–618 (2011) (PMID: 21245428).
11. Pagès, F. et al. Immune infiltration in human tumors: a prognostic factor that should not be ignored. Oncogene 29(8), 1093–1102
(2010) (PMID: 19946335).
12. Broussard, E. K. & Disis, M. L. TNM staging in colorectal cancer: T is for T cell and M is for memory. J. Clin. Oncol. 29, 601–603
(2011) (PMID: 21245434).
13. Gao, G. & Jakobsen, B. Molecular interactions of coreceptor CD8 and MHC class I: the molecular basis for functional coordination
with the T-cell receptor. Immunol. Today 21(12), 630–636 (2000) (PMID 11114424).
14. Naito, Y., Saito, K. & Shiiba, K. et al. CD8+ T cells infiltrated within cancer cell nests as a prognostic factor in human colorectal
cancer. Cancer Res. 58(16), 3491–3494 (1998).
15. Galon, J. et al. Towards the introduction of the ‘Immunoscore’ in the classification of malignant tumours. J. Pathol. 232(2), 199–209
(2014) (PMID: 24122236).
16. Zlobec, I. et al. TIA-1 cytotoxic granule-associated RNA binding protein improves the prognostic performance of CD8 in mismatch
repair-proficient colorectal cancer. PLoS ONE 5, e14282 (2010) (PMID:21179245).
17. Pagès, F. et al. In situ cytotoxic and memory T cells predict outcome in patients with early-stage colorectal cancer. J. Clin. Oncol.
27(35), 5944–5951 (2009) (PMID: 19858404).
18. Prall, F. et al. Prognostic role of CD8+ tumor-infiltrating lymphocytes in stage III colorectal cancer with and without microsatellite
instability. Hum. Pathol. 35, 808–816 (2004) (PMID:15257543).
19. Chiba, T. et al. Intraepithelial CD8+ T-cell-count becomes a prognostic factor after a longer follow-up period in human colorectal
carcinoma: possible association with suppression of micrometastasis. Br. J. Cancer 91(9), 1711–1717 (2004) (PMID: 15494715).
20. Donnem, T. et al. Stromal CD8+ T-cell density-a promising supplement to TNM staging in non-small cell lung Cancer. Clin Cancer
Res. 21, 2635–2643 (2015) (PMID: 25680376).
21. Nakano, O. et al. Proliferative activity of intratumoral CD8(+) T-lymphocytes as a prognostic factor in human renal cell carcinoma:
clinicopathologic demonstration of antitumor immunity. Cancer Res. 61, 5132–5136 (2001) (PMID: 11431351).
22. Kondratiev, S. et al. Intratumoral CD8+ T lymphocytes as a prognostic factor of survival in endometrial carcinoma. Clin. Cancer
Res. 10, 4450–4456 (2004) (PMID: 15240536).
23. Bleul, C. C. et al. A highly efficacious lymphocyte chemoattractant, stromal cell-derived factor 1 (SDF-1). J. Exp. Med. 184(3),
1101–1109 (1996) (PMID: 9064327).
24. Guo, F. et al. CXCL12/CXCR4: a symbiotic bridge linking cancer cells and their stromal neighbors in oncogenic communication
networks. Oncogene 35(7), 816–826 (2016) (PMID: 25961926).
25. Samarendra, H. et al. A meta-analysis of CXCL12 expression for cancer prognosis. Br. J. Cancer 117(1), 124–135 (2017) (PMID:
28535157).
26. Akishima-Fukasawa, Y. et al. Prognostic significance of CXCL12 expression in patients with colorectal carcinoma. J. Clin. Pathol.
132(2), 202–210 (2009) (PMID: 19605814).
27. Amara, S. et al. Stromal cell derived factor-1 and CXCR4 expression in colorectal cancer promote liver metastasis. Cancer Biomark.
15(6), 869–879 (2015) (PMID: 26406413).
28. Sakai, N. et al. CXCR4/CXCL12 expression profile is associated with tumor microenvironment and clinical outcome of liver
metastases of colorectal cancer. Clin. Exp. Metastasis 29(2), 101–110 (2012) (PMID: 22075627).
29. Stanisavljević, L. et al. CXCR4, CXCL12 and the relative CXCL12-CXCR4 expression as prognostic factors in colon cancer. Tumour
Biol. 37(6), 7441–7452 (2016) (PMID: 26678887).
30. Sauter, G., Simon, R. & Hillan, K. Tissue microarrays in drug discovery. Nat. Rev. Drug Discov. 2(12), 962–972 (2003) (PMID:
14654795).
31. Däster, S. et al. High frequency of CD8 positive lymphocyte infiltration correlates with lack of lymph node involvement in early
rectal cancer. Dis. Markers 2014, 792183 (2014).
32. Zlobec, I., Steele, R., Terracciano, L., Jass, J. R. & Lugli, A. Selecting immunohistochemical cut-off scores for novel biomarkers of
progression and survival in colorectal cancer. J. Clin. Pathol. 60(10), 1112–1116 (2007).
33. Bradburn, M. J. et al. Survival analysis part II: multivariate data analysis—an introduction to concepts and methods. Br. J. Cancer
89(3), 431–436 (2003) (PMCID: PMC2394368).
34. Däster, S. et al. Absence of myeloperoxidase and CD8 positive cells in colorectal cancer infiltrates identifies patients with severe
prognosis. Oncoimmunology 4(12), e1050574 (2015) (PMID: 26587320).
35. Weixler, B. et al. OX40 expression enhances the prognostic significance of CD8 positive lymphocyte infiltration in colorectal cancer.
BMC Cancer 16, 639 (2016) (PMID: 26439988).
36. Droeser, R. A. et al. High myeloperoxidase positive cell infiltration in colorectal cancer is an independent favorable prognostic
factor. PLoS ONE 8(5), e64814 (2013) (PMID: 23734221).
37. Sterlacci, W. et al. Expression of the CXCR4 ligand SDF-1/CXCL12 is prognostically important for adenocarcinoma and large cell
carcinoma of the lung. Virchows Arch. 468(4), 463–471 (2016) (PMID: 26818832).
38. Jun-Chao, G. et al. CXCL12-CXCR7 axis contributes to the invasive phenotype of pancreatic cancer. Br. J. Cancer 89(3), 431–436
(2003) (PMID: 12888808).
39. Ishigami, S. et al. Clinical implication of CXCL12 expression in gastric cancer. Ann. Surg. Oncol. 14(11), 3154–3158 (2007) (PMID:
17653799).
40. Mirisola, V. et al. CXCL12/SDF1 expression by breast cancers is an independent prognostic marker of disease-free and overall
survival. Eur. J. Cancer 45(14), 2579–2587 (2009) (PMID: 19646861).
Scientific Reports | (2021) 11:775 | https://doi.org/10.1038/s41598-020-80382-2 10
Vol:.(1234567890)www.nature.com/scientificreports/
41. Phillips, R. J. et al. The stromal derived factor-1/CXCL12-CXC chemo- kine receptor 4 biological axis in non-small cell lung cancer
metastases. Am. J. Respir. Crit. Care Med. 167, 1676–1686 (2003) (PMID: 12626353).
42. Weixler, B. et al. Phosphorylated CXCR4 expression has a positive prognostic impact in colorectal cancer. Cell Oncol. (Dordr)
40(6), 609–619 (2017) (PMID: 28936810).
43. Roy, I. et al. CXCL12 chemokine expression suppresses human pancreatic cancer growth and metastasis. PLoS ONE 9, e90400
(2014) (PMID: 24594697).
44. Pagés, F. et al. International validation of the consensus immunoscore for the classification of colon cancer: a prognostic and
accuracy study. Lancet 391, 2128–2139 (2018) (PMID: 29754777).
Acknowledgements
All authors have agreed to the submission and have participated in the study to a sufficient extent to be named
as authors.
Author contributions
R.D. and A.P. designed the study. A.T. and A.L. performed immunohistochemical analysis independently. Our
experienced pathologist, L.T., validated the date independently. The Manuscript was written mainly by A.L. All
authors read, suggested corrections and approved the final manuscript.
Funding
There was no funding for this study.
Competing interests
The authors declare no competing interests.
Additional information
Correspondence and requests for materials should be addressed to A.L. or R.A.D.
Reprints and permissions information is available at www.nature.com/reprints.
Publisher’s note Springer Nature remains neutral with regard to jurisdictional claims in published maps and
institutional affiliations.
Open Access This article is licensed under a Creative Commons Attribution 4.0 International
License, which permits use, sharing, adaptation, distribution and reproduction in any medium or
format, as long as you give appropriate credit to the original author(s) and the source, provide a link to the
Creative Commons licence, and indicate if changes were made. The images or other third party material in this
article are included in the article’s Creative Commons licence, unless indicated otherwise in a credit line to the
material. If material is not included in the article’s Creative Commons licence and your intended use is not
permitted by statutory regulation or exceeds the permitted use, you will need to obtain permission directly from
the copyright holder. To view a copy of this licence, visit http://creativecommons.org/licenses/by/4.0/.
© The Author(s) 2021
Scientific Reports | (2021) 11:775 | https://doi.org/10.1038/s41598-020-80382-2 11
Vol.:(0123456789)You can also read