PD-L1 Status in Gastric Cancers, Association with the Transcriptional, Growth Factors, AKT/mTOR Components Change, and Autophagy Initiation - MDPI
←
→
Page content transcription
If your browser does not render page correctly, please read the page content below
International Journal of
               Molecular Sciences

Article
PD-L1 Status in Gastric Cancers, Association with the
Transcriptional, Growth Factors, AKT/mTOR Components
Change, and Autophagy Initiation
Liudmila Spirina 1,2, * , Alexandra Avgustinovich 1 , Sergei Afanas’ev 1 , Maxim Volkov 1 , Alexey Dobrodeev 1 ,
Olga Cheremisina 1 and Dmitry Kostromitsky 1

                                          1   Cancer Research Institute, Tomsk National Research Medical Center, 634000 Tomsk, Russia;
                                              aov862@yandex.ru (A.A.); AfanasievSG@oncology.tomsk.ru (S.A.); dok75-75@mail.ru (M.V.);
                                              dobrodeev@oncology.tomsk.ru (A.D.); cheremisinaov@oncology.tomsk.ru (O.C.);
                                              info@oncology.tomsk.ru (D.K.)
                                          2   Biochemistry and Molecular Biology Department, Medical and Biological Faculty, Siberian State Medical
                                              University, 634000 Tomsk, Russia
                                          *   Correspondence: spirinalvl@mail.ru; Tel.: +7-960-975-8577

                                          Abstract: Introduction: The programmed death receptor ligand 1 (PD-L1) immunohistochemistry
                                          (IHC) assay is a widely used selection method for pembrolizumab treatment in gastric cancer (GC)
                                          patients. PD-L1 is the main regulator of immunity in oncogenesis. Material and methods: The study

                                          included 38 patients with GC. The combined treatment consisted of neoadjuvant FOLFOX6, or FLOT,
                                   chemotherapy and surgery. PD-L1 + tumor status was recorded in 12 patients (CPS > 5), with a
Citation: Spirina, L.; Avgustinovich,     negative status recorded in 26 patients. RT-PCR determined the expression of molecular markers.
A.; Afanas’ev, S.; Volkov, M.;            The level of LC3B protein was detected by Western Blotting analysis. Results: An overexpression
Dobrodeev, A.; Cheremisina, O.;           of PD-1, PD-L2 in the tumor is associated with AKT/mTOR mRNA profile change and autophagy
Kostromitsky, D. PD-L1 Status in          initiation in IHC PD-L1 positive GCs. NACT influences these biological features, modifying the
Gastric Cancers, Association with the     expression of AKT/mTOR components and autophagic flux. In PD-L1 positive cancers, the effect of
Transcriptional, Growth Factors,          NACT and molecular markers rearrangements are essential compared to the PD-L1 negative cancers.
AKT/mTOR Components Change,
                                          Conclusion: The IHC PD-L1 status in gastric cancers is the significant marker of cancer progression,
and Autophagy Initiation. Int. J. Mol.
                                          recovering the multiple inner mechanisms of cancer spreading and leading to ineffective therapy.
Sci. 2021, 22, 11176. https://doi.org/
                                          Autophagy induction and angiogenesis are found in PD-L1 positive gastric cancers.
10.3390/ijms222011176

                                          Keywords: PD-L1; gastric cancers; transcriptional factors; growth factors; AKT/mTOR compo-
Academic Editor: Grazyna Kochan
                                          nent; LC3B
Received: 30 August 2021
Accepted: 12 October 2021
Published: 16 October 2021
                                          1. Introduction
Publisher’s Note: MDPI stays neutral           In recent decades, gastric cancers have remained a global burden. The fundamental
with regard to jurisdictional claims in   issue in modern oncology is the search for effective anti-cancer drugs and neoadjuvant
published maps and institutional affil-   chemotherapy (NACT) regimens. The expression of programmed death receptor ligand
iations.                                  1 (PD-L1) can be determined by an immunohistochemistry (IHC) assay, a widely used
                                          selection method for pembrolizumab treatment in gastric cancer (GC) patients. PD-L1
                                          expression in GC patients is correlated with molecular features. In 59.3% of GC patients
                                          with a PD-L1 positive status, MSI (microsatellite instability) and EBV (Epstein–Barr virus)
Copyright: © 2021 by the authors.         positivity was found [1]. A limited number of patients achieved clinical benefits, highlight-
Licensee MDPI, Basel, Switzerland.        ing the importance of a greater selection of patients or the need for additional treatment to
This article is an open access article    overcome this resistance to PD-1/PD-L1 blockade [2].
distributed under the terms and                Tumor infiltration by immunocompetent cells and, consequently, the production of
conditions of the Creative Commons        PD receptors, PD-L1, and PD-L2 ligands by tumor cells, are also controlled by AKT/mTOR
Attribution (CC BY) license (https://     kinases [3]. An increase in PD-L1 and PD-L2 expression is associated with cancer spreading
creativecommons.org/licenses/by/          and the involvement of distant organs.
4.0/).

Int. J. Mol. Sci. 2021, 22, 11176. https://doi.org/10.3390/ijms222011176                                        https://www.mdpi.com/journal/ijms
Int. J. Mol. Sci. 2021, 22, 11176 2 of 10
Multiple molecular mechanisms are involved in GCs immunity. PD-L1 expression in
the residual tumor can be used as a prognostic marker in patients after receiving NACT [4].
High CTLA-4 and p-Akt expression levels in pretreatment tumor cells were associated
with poor clinical outcomes [5]. Positive correlations were found among PD-L1, c-MET,
and HGF, based on TCGA datasheets and paired cancer specimens. Moreover, the resistant
mechanisms increase PD-L1 expression and attenuate the activation and cytotoxicity of
lymphocytes [6].
Increased AKT mRNA expression correlates with lymph node metastasis, while
decreased PTEN mRNA levels correlate with advanced tumor stage and lymph node
metastasis [7]. The findings reveal that PD-L1 expression promotes the EMT of cancer cells
resistant to anti-cancer therapy [8].
Transcriptional and growth factors are also implemented during oncogenesis via
a modification of the immune response. Hypoxia-inducible factor 1 (HIF-1) plays an
indispensable role in the hypoxic tumor microenvironment [9].
Furthermore, PD-L1 positive immune cells also initiate autophagy—the most potent
mechanism of cancer progression. The pattern of proteins affecting immunity includes
autophagic proteins. It is known the PD-L1 positive cells express LC3B, suggesting the
need for further investigation into the modulation of the immune microenvironment [10].
However, misfolded proteins, damaged mitochondria, and other unwanted components
in cells can be decomposed and reused via autophagy in some specific cases (including
hypoxic stress, low energy states, or nutrient deprivation) [11]. Dynamic LC3B and p62
changes are found in gastric tumorigenesis and are used as predictive biomarkers, and
potential therapeutic targets, for GCs [12].
The effects of NACT on immune markers and the biological features in cancers
remain largely unknown. NACT significantly alters the expression of immunosuppressive
molecules, suggesting a choice of immune response combinations [13]. NACT increases
immune infiltration. The evaluation of immune parameters in post-NACT tumors may
help select patients for immunotherapy trials [14].
Moreover, the effect of NACT on tumor-infiltrating lymphocytes and PD-L1 expres-
sion in tumors has clinical significance [15]. AKT/mTOR activation is a critical event in
response to NACT [16]. Commonly, neoadjuvant PI3K/mTOR/AKT inhibition reduces
tumor growth [17]. The cellular degradation process has a complex role in tumorigenesis
and resistance to cancer treatment in humans; therefore, a mechanism is required to en-
sure autophagy regulation. However, the high expression of autophagy-related proteins
post-treatment shows a strong, negative association with the efficacy of NACT in cancer
patients [18].
Autophagy may contribute to an acquired resistance against Her2-targeted therapy
in cancers; therefore, combining Her2 and autophagy inhibition might be beneficial for
cancer patients [19]. In addition, the anti-cancer treatment can also be seen to reduce
the expression of mTOR, p62, BCL2, and upregulated Beclin 1 and LC3-I/II, which are
significant autophagy-related genes. These processes induce potent cell apoptosis in cancer
cells. NACT exerts antitumor activities by blocking molecular signaling pathways [20].
Autophagy regulates PD-L1 expression in gastric cancer through the p62/SQSTM1-NF-
κB pathway. Thus, the pharmacological modulation of autophagy may influence the
therapeutic efficacy of PD-L1 blockade in gastric cancer [21].
The prognostic significance of autophagy-related proteins highlights the importance
of autophagy in the biologic behavior of chemoresistant cancer cells. LC3B can be used as
a prognostic marker in cancer patients after NACT. Furthermore, evaluating and targeting
autophagy in a neoadjuvant setting may help prevent disease relapse in patients [22]. This
study aimed to analyze the PD-1, PD-L1, PD-L2, transcriptional, growth factors, and LC3B
expression in GC patients associated with the IHC PD-L1 status.Int. J. Mol. Sci. 2021, 22, 11176 3 of 10
2. Results
2.1. PD-Status in Cancers Impacts Transcriptional Growth Factors, AKT/mTOR Components, and
PD-1, PD-L1, and PD-L2 Expression
Table 1 summarizes the PD-1, PD-L1, PD-L2 expression in IHC PD-L1 negative and
positive cancers. PD-1 and PD-L2 expression increased by 3.86 and 2.43 times in PD-L1
positive GCs.
Table 1. PD, PD-L1, PD-L2 expression in GC tissues depending on IHC PD-L1 status, Me (Q1; Q3).
PD-L1 Tumor Status
PD-L1 Negative, (CPS > 5) PD-L1 Positive, (CPS < 5)
PD-1 0.69 (0.67; 1.32) 2.67 (0.55; 8.21) *
PD-L1 0.81 (0.31; 1.12) 0.59 (0.31; 0.82)
PD-L2 1.91 (1.07; 2.20) 4.65 (1.70; 18.51) *
Note: *—the significance of differences compared to patients with PD-L1 positive status, p < 0.05.
The tumor infiltration by immunocompetent cells and, consequently, the produc-
tion of PD receptors and PD-L1, PD-L2 ligands by tumor cells are also controlled by an
AKT/mTOR signaling cascade, transcription, and growth factors [3]. The NF-κB p50
and HIF-2 expression increased by 15.05 and 12.34 times in PD+ tumors compared to the
negative ones (Table 2).
Table 2. Molecular markers in GC tissues’ gastric cancer depend on IHC PD-L1 status, Me (Q1; Q3).
PD-L1 Tumor Status
PD-L1 Positive, (CPS < 5) PD-L1 Negative, (CPS > 5)
AKT/mTOR signaling cascade components and AMPK
PDK 0.57 (0.51; 1.14) 0.44 (0.19; 0.95)
AKT 1.27 (0.85; 2.73) 1.74 (0.21; 6.91)
c-RAF 1.10 (0.63; 1.50) 1.24 (0.43; 6.75)
GSK-3β 3.13 (0.44; 4.48) 0.68 (0.44; 0.92)
PTEN 1.25 (0.41; 1.57) 1.47 (0.13; 10.36)
mTOR 0.97 (0.69; 1.35) 0.70 (0.09; 1.59)
4EBP1 1.30 (0.94; 2.35) 1.36 (0.15; 2.88)
70s 6 kinase 1.19 (0.72; 2.30) 1.37 (0.72; 4.09)
AMPK 1.16 (0.43; 2.16) 0.79 (0.07; 3.26)
Transcriptional and growth factors
NF-κBp65 1.34 (0.46; 2.20) 1.38 (0.54; 2.81)
NF-κBp50 0.51 (0.39; 1.36) 7.68 (1.36; 26.70) *
HIF-1 2.30 (0.99; 5.22) 5.16 (0.93; 27.21)
HIF-2 0.83 (0.39; 1.37) 10.25 (0.13; 24.21) *
VEGF 0.50 (0.32; 1.44) 6.97 (0.18; 25.27)
CAIX 1.04 (0.35; 1.90) 0.74 (0.05; 3.66)
VEGFR2 1.04 (0.58; 4.98) 0.59 (0.01; 1.05)
Note: *—the significance of differences compared to patients with PD-L1 positive status, p < 0.05.
2.2. PD-Status in Cancers and Autophagy Initiation
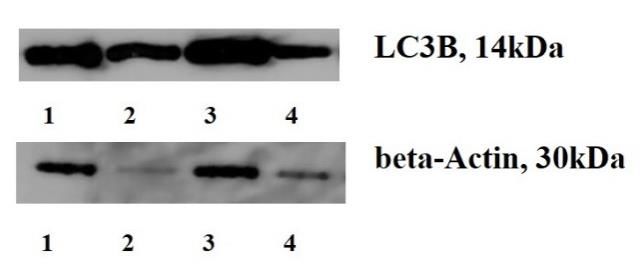
LC3B mRNA level was associated with PD-L1 tumor status. We found that mRNA and
protein content increases by 3.49 and 1.76 times in IHC PD-L1 positive cancers compared
to negative ones (Table 3, Figure 1).Int. J. Mol. Sci. 2021, 22, x FOR PEER REVIEW 4 of 10
Int. J. Mol. Sci. 2021, 22, 11176 Table 3. Expression of LC3B, mTOR, AMPK, and autophagosome LC3B protein content
4 of 10
in gastric tumor tissue depending on PD-L1 tumor status.
PD-L1 Tumor Status
Table 3. Expression of LC3B, mTOR, AMPK,
PD-L1 and autophagosome
Negative, (CPS > 5)LC3B protein
PD-L1 content
Positive, in gastric
(CPS < 5)
tumor tissue depending on PD-L1
LC3B expression, Relative tumor status.
0.57 (0.38; 1.44) 1.99 (0.38; 3.80) *
Units PD-L1 Tumor Status
LC3B protein level, % to the PD-L1 Negative, (CPS > 5) 146.65
PD-L1 Positive,166.56)
(CPS < 5)
83.00 (55.7; 100.35) (126.75; *
normal tissues
LC3B expression, Relative Units 0.57 (0.38; 1.44) 1.99 (0.38; 3.80) *
Note: *—the significance of differences compared
LC3B protein level, % to the normal tissues
to patients with PD-L1
83.00 (55.7; 100.35)
positive status,
146.65 (126.75; 166.56) *
pNote:
< 0.05.
*—the significance of differences compared to patients with PD-L1 positive status, p < 0.05.
Figure 1.
1. LC3B
LC3Bcontent
contentininGCs
GCs tissues and
tissues adjacent
and adjacentnon-transformed
non-transformed ones. (Figure
ones. 1. Note:
(Figure 1, 3– 1,
1. Note:
cancers, 2,4—non-transformed
3–cancers, 2,4—non-transformedtissues;tissues;LC3B
LC3Bcontent
contentisisaakey
keyoncogenic
oncogenicevent
event in
in GCs
GCs develop-
development,
ment, indicating
indicating the autophagy
the autophagy initiation.
initiation. The modified
The modified biological
biological features
features in cancers
in cancers after
after the the are
NACT
NACT are responsible
responsible for the development
for the development of anti-cancer
of anti-cancer therapy resistance).
therapy resistance).
2.3. Molecular Mechanisms of of Modified
Modified Immunity
ImmunityAreare Due to the
the Impact
Impact of
of NACT,
NACT,the
theRole
Roleofofthe
AKT/mTOR Signaling Cascade, and LC3B
the AKT/mTOR Signaling Cascade, and LC3B
Previous studies
Previous studieshave
havenoted
notedthe
thechanges
changesininthe expression
the expressionof of
thethe
AKT/mTOR
AKT/mTOR signaling
signal-
cascade associated with GC extension [3]. After the NACT, we revealed a decrease
ing cascade associated with GC extension [3]. After the NACT, we revealed a decrease in 4EBP1 in
expression
4EBP1 by 2.2 times
expression by 2.2intimes
the tumors (Table 4),
in the tumors with4),
(Table an with
increase in VEGFinexpression
an increase VEGF expres-and
CAIXand
sion by CAIX
7.25 and
by 5.1
7.25times, compared
and 5.1 to the non-altered
times, compared tissues. tissues.
to the non-altered
Table 4. Influence of neoadjuvant therapy on the expression of the AKT/mTOR signaling pathway
Table 4. Influence of neoadjuvant therapy on the expression of the AKT / mTOR signaling pathway
components and
components and AMPK
AMPK inin gastric
gastric tumors.
tumors.
Indicator, Relative
Indicator, Relative Units
Units Before NACT
Before NACT After NACT
After NACT
AKT/mTOR signaling cascade components
AKT/mTOR signaling cascade components and AMPK and AMPK
PDF
PDF 1.54
1.54 (0.35; 6.89)
(0.35; 6.89) 1.25
1.25 (0.06; 9.49)
(0.06; 9.49)
AKT
AKT 0.99
0.99 (0.21; 2.21)
(0.21; 2.21) 1.95
1.95 (1.58; 76.00)
(1.58; 76.00)
c-RAF
c-RAF
6.77 (1.27; 29.60)
6.77 (1.27; 29.60)
15.07 (6.57; 120.76)
15.07 (6.57; 120.76)
GSK-3β 1.95 (0.30; 16.84) 1.12 (0.02; 2.29)
GSK-3β 1.95 (0.30; 16.84) 1.12 (0.02; 2.29)
PTEN 2.13 (0.20; 9.78) 7.18 (0.00; 29.82)
PTEN 2.13 (0.20; 9.78) 7.18 (0.00; 29.82)
mTOR 0.99 (0.19; 1.62) 4.74 (0.15; 6.83)
mTOR
4EBP1 0.99(0.45;
3.1 (0.19;56.87)
1.62) 1.414.74 (0.15;15.62)
(0.48; 6.83) *
70s4EBP1
6 kinase 3.1 (0.45;
3.92 (0.54;56.87)
15.40) 1.41 (0.48;
8.02 (0.26;15.62)
32.66)*
АМРК
70s 6 kinase 1.45 (0.11;15.40)
3.92 (0.54; 7.95) 11.10 (0.07;32.66)
8.02 (0.26; 15.38)
AMPK Transcriptional and 7.95)
1.45 (0.11; growth factors 11.10 (0.07; 15.38)
NF-κBp65 0.76 (0.23; 2.26)
Transcriptional and growth factors 1.93 (0.78; 10.68)
NF-κBp50
NF-κBp65
0.60 (0.38; 10.26)
0.76 (0.23; 2.26)
1.33 (0.24; 10.34)
1.93 (0.78; 10.68)
HIF-1 2.02 (0.54; 9.17) 8.12 (0.77; 20.49)
NF-κBp50 0.60 (0.38; 10.26) 1.33 (0.24; 10.34)
HIF-2 1.37 (0.09; 4.5) 0.89 (0.4; 6.31)
HIF-1 2.02 (0.54; 9.17) 8.12 (0.77; 20.49)
VEGF 0.32 (0.03; 2.13) 2.32 (0.40; 10.75) *
HIF-2
САIX 1.37(0.13;
0.51 (0.09; 1.46)
4.5) 2.570.89(0.56;
(0.4; 6.31)
7.04) *
VEGF
VEGFR2 0.32 (0.20;
0.78 (0.03; 2.13)
5.31) 2.32
1.7 (0.40;
(0.33;10.75)
2.59) *
CAIX 0.51 (0.13; 1.46) 2.57 (0.56; 7.04) *
VEGFR2 0.78 (0.20; 5.31) 1.7 (0.33; 2.59)
Note: *—the significance of the differences in comparison with the indicator before treatment, p < 0.05.Int. J. Mol. Sci. 2021, 22, 11176 5 of 10
We found an LC3B expression increase of 5.12 times after NACT (Table 5). However,
the PD, PD-L1, and PD-L2 expression in cancers before and after NACT did not change.
Table 5. Expression of LC3B, PD, PD-L1, PD-L2 in gastric tumor tissue before and after NACT.
Indicator, Relative Units Before NACT After NACT
LC3B expression 0.57 (0.28; 1.52) 2.94 (0.85; 3.25) *
PD-1 expression 0.83 (0.31; 2.15) 0.97 (0.66; 1.93)
PD-L1 expression 1.91 (0.77; 7.00) 0.70 (0.05; 1.91)
PD-L2 expression 1.14 (0.20; 3.02) 1.42 (0.56; 11.10)
Note: *—the significance of the differences in comparison with the indicator before treatment, p < 0.05.
We detected a decrease in AKT and mTOR mRNA levels in 5.66 and 11.05 times in PD-
L1 positive GCs with the enhancement of the HIF-1, VEGF, and CAIX, increasing by 26.8,
8.0, and 14.19 times compared to the negative ones (Table 6). The obtained change in the
biological properties of cancers highlights the involvement of multiple inner mechanisms
in the regulation behavior of cancer cells.
Table 6. Molecular markers in gastric cancers depending on the PD-L1 status after NACT.
PD-L1 Tumor Status
PD-L1 Positive, (CPS < 5) PD-L1 Negative, (CPS > 5)
AKT/mTOR signaling cascade components and AMPK
PDK 1.37 (0.60; 2.63) 0.71 (0.00; 1.42)
AKT 2.21 (1.18; 3.32) 0.39 (0.03; 0.75) *
c-RAF 4.95 (1.38; 11.19) 5.76 (2.00; 6.44)
GSK-3β 3.31 (0.44; 6.44) 0.68 (0.44; 0.92)
PTEN 2.33 (1.07; 8.4 5.00 (3.08; 6.92)
mTOR 2.21 (0.61; 4.28) 0.20 (0.00; 0.40) *
4EBP1 2.28 (1.49; 3.04) 1.53 (1.53; 1.54)
70s 6 kinase 1.34 (0.83; 2.77) 1.36 (0.65; 2.07
AMPK 0.71 (0.00; 6.27) 0.56 (0.56; 0.57)
Transcriptional and growth factors
NF-κBp65 2.80 (2.23; 14.54) 5.45 (0.22; 10.68)
NF-κBp50 0.91 (0.35; 30.36) 4.47 (1.05; 7.90)
HIF-1 3.44 (1.60; 15.81) 92.46 (70.13; 114.80) *
HIF-2 4.45 (2.44; 29.46) 0.75 (0.53; 0.98)
VEGF 0.63 (0.38; 1.68) 5.04 (0.06; 10.75) *
CAIX 2.00 (0.74; 3.58) 28.39 (1.06; 55.72) *
VEGFR2 1.85 (1.14; 14.01) 2.08 (1.58; 2.59)
Note: *—the significance of differences compared to patients with PD-L1 positive status, p < 0.05.
Table 7 presents data on the growth of LC3B protein levels in GCs after NACT. The
adaptation to the anti-cancer therapy was accompanied by autophagy induction. We
indicated the PD-1 expression enhancement in IHC PD-L1 positive tumors. A 24.1 fold
increase of the indicator shows an immunity modification depending on the PD-L1 status
in GCs.Int. J. Mol. Sci. 2021, 22, 11176 6 of 10
Table 7. Molecular markers in gastric cancers depending on the PD-L1 status after NACT.
PD-L1 Tumor Status
PD-L1 negative, (CPS > 5) PD-L1 Positive, (CPS < 5)
LC3B expression, Relative
3.25 (2.80; 3.78) 1.75 (0.54; 4.65)
Units
LC3B protein level, % to the
83.00 (55.70; 100.35) 146.65 (2.80; 3.78) *
normal tissues
PD-1, Relative Units 5.24 (0,58; 10.40) 71.1 (4.2; 123.34) *
PD-L1, Relative Units 2.39 (0.53; 4.61) 0.88 (0.57; 1.20)
PD-L2, Relative Units 6.52 (0.00; 24.93) 0.45 (0.23; 0.68)
Note: *—the significance of differences compared to patients with PD-L1 positive status, p < 0.05.
3. Discussion
The PD-L1 tumor status is closely associated with increased PD-1 and PD-L2 expres-
sion. It has been determined that multiple molecular mechanisms are involved in the
GCs immunity [5]. Positive correlations were found among PD-L1, growth, and nuclear
factors in cancer cells [6]. Moreover, an increase in inflammatory factors (NF-κB and HIF-2)
was detected in PD-L1+ GCs. Therefore, immunity modulation is an essential oncogenic
trigger [15].
We revealed that, after the treatment, a decrease in the AKT/mTOR signaling cas-
cade was more pronounced in IHC PD-L1 positive cancers. Hypoxia and HIF signaling
were found to activate cancer progression due to the vascular endothelial growth factor,
prostaglandin E2, and PD-1 overexpression [9,23].
We revealed molecular markers and autophagy-related proteins modification in GCs.
The decrease in 4EBP expression and LC3B mRNA level growth is crucial in GCs, involving
specific hallmarks in cancer cells.
Autophagy, a cellular degradation process, has complex roles in tumorigenesis and
determines the resistance to anti-cancer treatment in humans. An increase in LC3B con-
tent recovers the inner mechanism of PD-L1 overproduction in GCs. The expression of
autophagy-related proteins shows a strong negative association with the response to NACT
in patients [18]. This study found that the fundamental explanation for GC aggressiveness
depends on immunity modulation and pre-existing cellular resistance. Autophagy is an
essential process in tumor behavior, especially in IHC PD-L1 positive GCs. Consequently,
changes to this behavior may be associated with the varying influence of NACT.
The findings revealed that PD-L1 promotes GC resistance to anti-cancer therapy [8],
noting an increased PD-1 expression in cancers after the NACT. Currently, there is only
isolated, ambiguous information regarding the relationship between molecular markers
and the effects of NACT. It is believed that primary resistance to anti-cancer therapy is a
multistep process [9]. NACT gastric cancer therapy affects the 4EBP1 expression in the tu-
mor. A high expression of AMPK, mTOR, and 4EBP1 in tumors before treatment mediates
the NACT effect in GC patients and is associated with tumor response to anti-cancer ther-
apy [3]. The impact of NACT on cancers depends on immunity, PD-1 expression, and PD-L1
protein content. The activation of autophagy, and the overexpression of transcriptional and
growth factors, are more pronounced in GCs with PD-L1 positive status.
NACT is the most potent factor, changing the immune response and affecting most
molecular processes. It is known that NACT exerts antitumor activities and affects the
autophagy pathway [20]. LC3B levels can be used as a prognostic marker in patients
after they have received NACT, highlighting the importance of autophagy in the biologic
behavior of chemoresistant cancer cells. Furthermore, evaluating and targeting autophagy
in a neoadjuvant setting may help to prevent disease relapse in patients [22]. Similarly,
PD-L1 positive immune cells also initiate autophagy [19]. The pattern of proteins affecting
immunity includes autophagic proteins. It is known that the PD-L1 positive cells expressInt. J. Mol. Sci. 2021, 22, 11176 7 of 10
LC3B, suggesting the need for further investigations regarding autophagy and the immune
microenvironment [10–12].
Consequently, NACT significantly alters the expression of molecular markers deter-
mining the modified invasive and metastatic potential in cancers. NACT increases immune
infiltration and PD-L1 overexpression. The marker levels are a prognostic at diagnosis and
remain a prognostic after NACT. Evaluating immune parameters in the post-NACT tumor
may help to select patients for immunotherapy trials. Moreover, the effect of NACT on
biological processes and oncogenesis is understood. AKT activation is an important event
in response to NACT and affects the body’s sensitivity to anti-cancer therapy. The data
explains that the growth in LC3B expression and protein content in IHC PD-L1 positive
cancers makes them the most resistant to NACT. A focus on autophagy as a therapeutic
target could therefore improve the efficacy of NACT.
4. Materials and Methods
The study included 38 patients with GC. Combined GC therapy consisted of neoadju-
vant FOLFOX6, or FLOT, chemotherapy and surgery. The patients underwent eight courses
of NACT with 14 days of recess. The time between the end of the last NACT course and
surgery was from 4 to 8 weeks. Stage T3N0-2M0 and T4N0-2M0 were revealed in 10 and
28 patients, respectively. Stage T1-4N0M0 was diagnosed in 14 patients, T1-4N1M0-in
16 patients, and T1-4N2M0— in 8 patients (Table 8). PD-L1 + tumor status was recorded
in 12 patients (CPS > 5), with a negative status in 26 patients. The additional clinical
characteristics are presented in Table 8.
Table 8. Clinical characterization of GC patients.
Characteristics Participants, n (%)
Gender
Male 26 (68.4%)
female 12 (31.6%)
Age, years
20–40 5 (13.3%)
40–60 12 (31.5%)
>60 21 (55.2%)
Tumor stage
T1-4N0M0 14 (37.0%)
T3-4N1M0 16 (42.0%)
T3-4N2M0 8 (21.0%)
PD-L1 status
PD-L1+ 12 (31.5%)
PD-L1 26 (68.5%)
Response to NACT
Complete response 3 (12.5%)
Partial response 6 (25%)
Progression 4 (16.7%)
Stabilization 11 (45.8%)
In the presence of positive HER2 tumor status, trastuzumab 4 mg/kg was admin-
istered intravenously on the first day of chemotherapy (loading dose 6 mg/kg), with a
PD-L1-positive status pembrolizumab 200 mg IV drip once every 3 weeks. The combined
effect of the treatment was evaluated in patients with locally advanced GC and was carried
out using the RECIST 1.1 scale.
The Ethics Committee approved the study of the Cancer Research Institute of the
Tomsk National Research Medical Center. The material used within this study (tumor
tissue and normal stomach tissue located at a distance of at least 1 cm from the border of
the tumor) was obtained during diagnostic video gastroscopy. The collected specimens
were frozen and stored at −80 ◦ C. To analyze the expression of molecular markers andInt. J. Mol. Sci. 2021, 22, 11176 8 of 10
RNA isolation, the tissue samples were placed in an RNAlater solution (Ambion) and held
at −80 ◦ C after a 24 h incubation at 4 ◦ C.
HER2 status detection. A combination of IHC and fluorescence in situ hybridization
(FISH) was used for HER-2 status detection. HER-2 (+3) was assessed as positive. If the
results of IHC were ambiguous (2+), the FISH technique was used.
IHC PD-L1 status detection. IHC was applied for the detection of the PD-L1 status.
PD-L1 + tumor status was detected in tissues with CPS >5.
IHC procedure. Paraffin-embedded tissue sections were deparaffinized in xylene for
15 min, rehydrated through a decreasing series of graded ethanol (100, 90, 80, and 70%),
incubated in 3% hydrogen peroxide/methanol solution for 30 min at room temperature to
quench the endogenous peroxidase activity, and washed with distilled water for 5 min. For
PD-L1 detection, antigen retrieval was performed by heating sections with a 0.01 mol/L
citrate buffer (pH 6.0) at 100 ◦ C for 3 min in a microwave. Following antigen retrieval, the
sections were blocked with 10% normal goat serum (Vector Laboratories, Inc., Burlingame,
CA, USA) for 20 min at room temperature in a humidified chamber. The sections were
subsequently incubated with the following primary antibodies at 4 ◦ C overnight: anti-PD-
L1 (rabbit; 1:500; cat. no. ab205921; Abcam, Göttingen, Germany). Following primary
antibody incubation, the sections were incubated with a secondary biotinylated antibody
(cat. no. PK-6101, Vector Laboratories, Inc.) using the avidin-biotin complex method. Color
development was performed by setting the sections with a 0.02% Histofine® DAB substrate
(Nichirei Biosciences, Inc., Tokyo, Japan) at room temperature before counterstaining with
Mayer’s hematoxylin. Stained cells were visualized under an optical microscope at a low
(×20) and high (×100 and×200) magnification.
RNA extraction. Total RNA was extracted using the RNeasy Mini Kit contain-
ing DNase I (Qiagen, Hilden, Germany). The concentration and purity of the isolated
RNA were assessed spectrophotometrically on a NanoDrop 2000 spectrophotometer
(Thermo Scientific, Waltham, MA, USA). RNA concentration varied from 80 to 250 ng/µL;
A260/A280 = 1.95–2.05; A260/A230 = 1.90–2.31. The integrity of the isolated RNA was
evaluated using capillary electrophoresis on a TapeStation (Agilent Technologies, Santa
Clara, CA, USA) using an R6K ScreenTape kit (Agilent Technologies). RIN was 5.6–7.8.
Quantitative reverse transcription PCR was conducted in a reaction mixture (25 µL) contain-
ing 12.5 µL BioMaster HS-qPCR SYBR Blue (Biolabmix, Novosibirsk, Russia) and 300 nM
of forward and reverse primers. PD-L2: F 50 -GTTCCACATACCTCAAGTCCAA-30 , R 50 -
ATAGCACTGTTCACTTCCCTCTT-30 ; PD-L1: F 50 -AGGGAGAATGATGGATGTGAA-30 ,
R 50 -ATCATTCACAACCACACTCACAT-30 ; PD-1-1: F 50 -CTGGGCGGTGCTACAACT-
30 , R 50 -CTTCTGCCCTTCTCTCTGTCA-30 ; 4-BP1: F 50 -CAGCCCTTTCTCCCTCACT-
30 , R 50 -TTCCCAAGCACATCAACCT-30 ; AKT1: F 50 -CGAGGACGCCAAGGAGA-30 , R
50 -GTCATCTTGGTCAGGTGGTGT-30 ; C-RAF: F 50 -TGGTGTGTCCTGCTCCCT-30 , R 50 -
ACTGCCTGCTACCTTACTTCCT-30 ; GSK3b: F 50 -AGACAAGGACGGCAGCAA-30 , R 50 -
TGGAGTAGAAGAAATAACGCAAT-30 ; 70S kinase alpha: F 50 -CAGCACAGCAAATCCTCAGA-
30 , R 50 -ACACATCTCCCTCTCCACCTT-30 ; m-TOR: F 50 -CCAAAGGCAACAAGCGAT-30 ,
R 50 -TTCACCAAACCGTCTCCAA-30 ; PDK1: F 50 -TCACCAGGACAGCCAATACA-30 ,
R 50 -CTCCTCGGTCACTCATCTTCA-30 ; VHL F 50 -GGCAGGCGAATCTCTTGA-30 , R 50 -
CTATTTCCTTTACTCAGCACCATT-30 ; AMPK: F 50 -AAGATGTCCATTGGATGCACT-30 ,
R 50 -TGAGGTGTTGAGGAACCAGAT-30 ; LC3B: F 50 -CCCAAACCGCAGACACAT-30 , R
50 -ATCCCACCAGCCAGCAC-30 ; GAPDH: F 50 -GGAAGTCAGGTGGAGCGA-30 , R 50 -
GCAACAATATCCACTTTACCAGA-30 . A preincubation at 94 ◦ C for 10 min was used to
activate the Hot Start DNA polymerase and denature the DNA. This was followed by 40
amplification cycles of denaturation at 94◦ for 10 s and annealing at 60◦ for 20 s. The primers
were selected using Vector NTI Advance 11.5 software and the NCBI database. GADPH
served as the reference gene; the expression of each specific mRNA was standardized
relative to GADPH expression.
Determination of LC3B content. Electrophoresis SDS-PAGE (Laemmli) was used.
The protein was transferred to a 0.2-/xm pore-sized PVDF membrane (GE Healthcare,Int. J. Mol. Sci. 2021, 22, 11176 9 of 10
Chalfont Saint Giles, UK), either at 150 mA or 100 V for 1 h using a Bio-Rad Mini Trans-Blot
electrophoresis cell. The membrane was incubated in a 1:2500 dilution of monoclonal
mouse anti-human LC3B (Affinity Biosciences, Cincinnati, OH, USA) at 4 ◦ C overnight.
PVDF samples were incubated in an Amersham ECL western blotting detection
analysis system (GE Medical Systems Information Technologie, Milwaukee, WY, USA). The
results were standardized using the beta-actin expression in a sample and were expressed
in percentages to the protein content in non-transformed tissues. The level of protein in
normal gastric tissue was indicated as 100.
Statistical analysis. Statistical analysis was performed using SPSS 19.0 software. Data
were expressed as median and ranges. The Mann–Whitney test was used for comparing
differences in mean values. Nonparametric one-way ANOVA on ranks was carried out to
test whether samples originate from the same distribution, which is used to compare two
or more independent samples of equal or different sample sizes.
5. Conclusions
The PD-L1 status of gastric cancers is the most significant marker to predict the anti-
cancer therapy effect. The prominent anti-cancer targets are autophagy-related proteins.
During this study, the prevalence of PD-1 and PD-L2 overexpression in IHC PD-L1 positive
GCs was found. Immunity modulation is a critical oncogenic process. Cellular signaling in
cancers results in the depression of the AKT/mTOR signaling pathway and the activation
of transcriptional and growth factors.
This study verified the inner molecular signal indicating a pre-existing resistance in
cancers. Hypoxia is an autophagy inducer, and the relationship between immunity and
autophagic flux is a well-known adaptation mechanism. Elemental resistance to NACT
provokes a reduced response to the treatment. We determined the impact of molecular
marker overactivation and NACT on PD-L1 positive GCs. The PD-L1 protein is the driver
of immunity in cancers. We also found out the effects of PD-1 and PD-L2 on GCs behavior
and the impact this has on the patients’ outcome, resulting in molecular profile modulation
and the NACT response.
Author Contributions: Conceptualization, L.S.; methodology, A.A.; formal analysis, M.V.; investiga-
tion, S.A.; resources, A.D. and D.K.; writing—original draft preparation, O.C.; writing—review and
editing, L.S. All authors have read and agreed to the published version of the manuscript.
Funding: This research received no external funding.
Institutional Review Board Statement: The study was conducted according to the guidelines of
the Declaration of Helsinki and approved by the Institutional Review Board (or Ethics Committee)
(protocol code 12; 10 April 2018).
Informed Consent Statement: Written informed consent has been obtained from the patient(s) to
publish this paper.
Data Availability Statement: Not applicable.
Conflicts of Interest: The authors declare no conflict of interest.
References
1. Liu, X.; Choi, M.G.; Kim, K.; Kim, K.M.; Kim, S.T.; Park, S.H.; Cristescu, R.; Peter, S.; Lee, J. High PD-L1 expression in gastric
cancer (GC) patients and correlation with molecular features. Pathol. Res. Pract. J. 2020, 216, 152881. [CrossRef] [PubMed]
2. Kawazoe, A.; Shitara, K.; Boku, N.; Yoshikawa, T.; Terashima, M. Current status of immunotherapy for advanced gastric cancer.
Jpn. J. Clin. Oncol. 2021, 51, 20–27. [CrossRef] [PubMed]
3. Spirina, L.V.; Avgustinovich, A.V.; Afanas’ev, S.G.; Kondakova, I.V.; Volkov, M.Y.; Dobrodeev, A.Y.; Boronkina, A.I. AKT/mTOR
Signal Cascade and Expression of PD-1, PD-L1, and PD-L2 in Gastric Cancer. Bull. Exp. Biol. Med. 2020, 170, 75–78. [CrossRef]
4. Chen, S.; Wang, R.X.; Liu, Y.; Yang, W.T.; Shao, Z.M. PD-L1 expression of the residual tumor serves as a prognostic marker in local
advanced breast cancer after neoadjuvant chemotherapy. Int. J. Cancer 2017, 140, 1384–1395. [CrossRef]
5. Chakravarti, N.; Ivan, D.; Trinh, V.A.; Glitza, I.C.; Curry, J.L.; Torres-Cabala, C.; Tetzlaff, M.T.; Bassett, R.L.; Prieto, V.G.; Hwu,
W.J. High cytotoxic T-lymphocyte-associated antigen four and phospho-Akt expression in tumor samples predicts poor clinical
outcomes in ipilimumab-treated melanoma patients. Melanoma Res. 2017, 27, 24–31. [CrossRef] [PubMed]Int. J. Mol. Sci. 2021, 22, 11176 10 of 10
6. Peng, S.; Wang, R.; Zhang, X.; Ma, Y.; Zhong, L.; Li, K.; Nishiyama, A.; Arai, S.; Yano, S.; Wang, W. EGFR-TKI resistance promotes
immune escape in lung cancer via increased PD-L1 expression. Mol. Cancer Res. 2019, 18, 165. [CrossRef] [PubMed]
7. Han, K.; Zhang, Y. mRNA expression of programmed cell death ligand 1 and components of the phosphatidylinositol 3-
kinase/AKT/phosphatase and tensin homolog pathway in epidermal growth factor receptor mutation-positive lung adenocarci-
noma. J. Cancer Res. Ther. 2019, 15, 914–920. [CrossRef]
8. Xu, G.L.; Ni, C.F.; Liang, H.S.; Xu, Y.H.; Wang, W.S.; Shen, J.; Li, M.M.; Zhu, X.L. Upregulation of PD-L1 expression promotes
epithelial-to-mesenchymal transition in sorafenib-resistant hepatocellular carcinoma cells. Gastroenterol. Rep. 2020, 8, 390–398.
[CrossRef] [PubMed]
9. You, L.; Wu, W.; Wang, X.; Fang, L.; Adam, V.; Nepovimova, E.; Wu, Q.; Kuca, K. The role of hypoxia-inducible factor 1 in tumor
immune evasion. Medicinal Res. Rev. 2021, 41, 1622–1643. [CrossRef]
10. Karpathiou, G.; Dridi, M.; Krebs-Drouot, L.; Vassal, F.; Jouanneau, E.; Jacquesson, T.; Barrey, C.; Prades, J.M.; Dumollard, J.M.;
Meyronet, D.; et al. Autophagic Markers in Chordomas: Immunohistochemical Analysis and Comparison with the Immune
Microenvironment of Chordoma Tissues. Cancers 2021, 13, 2169. [CrossRef] [PubMed]
11. Chen, C.; Gao, H.; Su, X. Autophagy-related signaling pathways are involved in cancer (Review). Exp. Ther. Med. 2021, 22, 710.
[CrossRef]
12. Kim, J.S.; Bae, G.E.; Kim, K.H.; Lee, S.I.; Chung, C.; Lee, D.; Lee, T.H.; Kwon, I.S.; Yeo, M.K. Prognostic Significance of LC3B and
p62/SQSTM1 Expression in Gastric Adenocarcinoma. Anticancer Res. 2019, 39, 6711–6722. [CrossRef] [PubMed]
13. Blanc-Durand, F.; Genesee, C.; Galende, E.Y.; Gouy, S.; Morice, P.; Pautier, P.; Mallard, A.; Mesnage, S.; Le Formal, A.; Brizais,
C.; et al. Distribution of novel immune-checkpoint targets in ovarian cancer tumor microenvironment: A dynamic landscape.
Gynecol. Oncol. 2021, 160, 279–284. [CrossRef] [PubMed]
14. Mesnage, S.L.; Auguste, A.; Genesee, C.; Dunant, A.; Pain, E.; Drusch, F.; Gouy, S.; Morice, P.; Bentivegna, E.; Lhomme, C.;
et al. Neoadjuvant chemotherapy (NACT) increases immune infiltration and programmed death-ligand 1 (PD-L1) expression in
epithelial ovarian cancer (EOC). Ann. Oncol. 2017, 28, 651–657. [CrossRef] [PubMed]
15. Pelekanou, V.; Carvajal-Hausdorf, D.E.; Altan, M.; Wasserman, B.; Carvajal-Hausdorf, C.; Wimberly, H.; Brown, J.; Lannin, D.;
Pusztai, L.; Rimm, D.L. Effect of neoadjuvant chemotherapy on tumor-infiltrating lymphocytes and PD-L1 expression in breast
cancer and its clinical significance. Breast Cancer Res. Treat. 2017, 19, 91. [CrossRef]
16. Koyama, F.C.; Lopes Ramos, C.M.; Ledesma, F.; Alves, V.A.F.; Fernandes, J.M.; Vailati, B.B.; São Julião, G.P.; Habr-Gama, A.;
Gama-Rodrigues, J.; Perez, R.O.; et al. Effect of Akt activation and experimental pharmacological inhibition on responses to
neoadjuvant chemoradiotherapy in rectal cancer. Br. J. Surg. 2018, 105, e192–e203. [CrossRef]
17. Jondal, D.E.; Thompson, S.M.; Butters, K.A.; Knudsen, B.E.; Anderson, J.L.; Roberts, L.R.; Callstrom, M.R.; Woodrum, D.A.
Single-Dose Neoadjuvant AKT Pathway Inhibitor Reduces Growth of Hepatocellular Carcinoma after Laser Thermal Ablation in
Small-Animal Model. Radiology 2019, 292, 752–759. [CrossRef]
18. Shim, B.Y.; Sun, S.; Won, H.S.; Lee, M.A.; Hong, S.U.; Jung, J.H.; Cho, H.M.; Ko, Y.H. Role of autophagy-related protein expression
in patients with rectal cancer treated with neoadjuvant chemoradiotherapy. BMC Cancer 2016, 16, 207. [CrossRef]
19. Janser, F.A.; Adams, O.; Bütler, V.; Schläfli, A.M.; Dislich, B.; Seiler, C.A.; Kröll, D.; Langer, R.; Tschan, M.P. Her2-Targeted Therapy
Induces Autophagy in Esophageal Adenocarcinoma Cells. Int. J. Mol. Sci. 2018, 19, 3069. [CrossRef]
20. Lin, S.; Yang, L.; Yao, Y.; Xu, L.; Xiang, Y.; Zhao, H.; Wang, L.; Zuo, Z.; Huang, X.; Zhao, C. Flubendazole demonstrates valid
antitumor effects by inhibiting STAT3 and activating autophagy. J. Exp. Clin. Cancer Res. 2019, 38, 293. [CrossRef]
21. Wang, X.; Wu, W.K.K.; Gao, J.; Li, Z.; Dong, B.; Lin, X.; Li, Y.; Li, Y.; Gong, J.; Qi, C.; et al. Autophagy inhibition enhances PD-L1
expression in gastric cancer. J. Exp. Clin. Cancer Res. 2019, 38, 140. [CrossRef] [PubMed]
22. Chen, S.; Jiang, Y.Z.; Huang, L.; Zhou, R.J.; Yu, K.D.; Liu, Y.; Shao, Z.M. The residual tumor autophagy marker LC3B serves
as a prognostic marker in local advanced breast cancer after neoadjuvant chemotherapy. Clin. Cancer Res. 2013, 19, 6853–6862.
[CrossRef] [PubMed]
23. Bortnik, S.; Tessier-Cloutier, B.; Leung, S.; Xu, J.; Asleh, K.; Burugu, S.; Magrill, J.; Greening, K.; Derakhshan, F.; Yip, S.; et al.
Differential expression and prognostic relevance of autophagy-related markers ATG4B, GABARAP, and LC3B in breast cancer.
Breast Cancer Res. Treat 2020, 183, 525–547. [CrossRef] [PubMed]You can also read