Expression and Prognostic Value of MCM Family Genes in Osteosarcoma
←
→
Page content transcription
If your browser does not render page correctly, please read the page content below
ORIGINAL RESEARCH
                                                                                                                                             published: 22 June 2021
                                                                                                                                     doi: 10.3389/fmolb.2021.668402

                                           Expression and Prognostic Value of
                                           MCM Family Genes in Osteosarcoma
                                           Jian Zhou 1, Mingyong Wang 2,3, Zhen Zhou 4, Wanchun Wang 1, Juan Duan 5* and Gen Wu 1*
                                           1
                                             Department of Orthopedics, The Second Xiangya Hospital, Central South University, Changsha, China, 2College of
                                           Pharmaceutical Sciences, Soochow University, Suzhou, China, 3Institute of Osteoporosis Diagnosis and Treatments of
                                           Soochow University, Suzhou, China, 4Menzies Institute for Medical Research, University of Tasmania, Hobart, TAS, Australia,
                                           5
                                             Department of Geriatrics, The Second Xiangya Hospital, Central South University, Changsha, China

                                           We performed a detailed cancer VS normal analysis to explore the expression and
                                           prognostic value of minichromosome maintenance (MCM) proteinsin human sarcoma.
                                           The mRNA expression levels of the MCM family genes in sarcoma were analyzed using
                                           data from ONCOMINE, GEPIA and CCLE databases. KEGG database was used to analyze
                                           the function of MCM2–7 complex in DNA replication and cell cycle. QRT-PCR and western
                                           blot were used to confirm the differential expression of key MCMs in osteosarcoma cell lines.
                                           Cell Counting Kit-8 and flow cytometry method were used to detect the cell proliferation and
                           Edited by:      apoptosis of hFOB1.19 cells. The results showed that MCM1–7 and MCM10 were all
                    Hem Chandra Jha,       upregulated in sarcoma in ONCOMINE database. MCM2, and MCM4–7 were highly
Indian Institute of Technology Indore,
                                 India
                                           expressed in sarcoma in GEPIA database. Moreover, all these ten factors were highly
                        Reviewed by:
                                           expressed in sarcoma cell lines. Furthermore, we analyzed the prognostic value of MCMs for
                   Sayan Chakraborty,      sarcoma in GEPIA and found that MCM2, MCM3, MCM4, and MCM10 are prognostic
Institute of Molecular and Cell Biology    biomarkers for human sarcoma. Analysis results using KEGG datasets showed that MCM4
                 (ApSTAR), Singapore
                        Chien-Feng Li,     and MCM6–7 constituted a core structure of MCM2-7 hexamers. We found that AzadC
  National Health Research Institutes,     treatment and overexpression of MCM4 significantly promoted hFOB1.19 cell proliferation
                                Taiwan
                                           and inhibited apoptosis. The present study implied that MCM2–4 and 10 are potential
                 *Correspondence:
                         Juan Duan
                                           biomarkers for the prognosis of sarcoma. The prognostic role of MCM4 may be attributable
             duanjuan86@csu.edu.cn         to the change in its DNA methylation patterns.
                           Gen Wu
                wu.gen@csu.edu.cn          Keywords: MCMs, sarcoma, expression, prognosis, DNA methylation

                   Specialty section:
        This article was submitted to      INTRODUCTION
           Molecular Diagnostics and
                        Therapeutics,      Sarcomas are malignant tumors derived from mesenchymal tissues (including connective tissue and
               a section of the journal    muscle), and they mostly occur in the skin, subcutaneous, periosteum and both ends of long bones.
   Frontiers in Molecular Biosciences
                                           Sarcomas can be divided into soft tissue sarcoma and osteosarcoma. Osteosarcoma is more common in
        Received: 16 February 2021         adolescents and occurs in the metaphysis of the extremities, especially the distal femur and proximal tibia.
          Accepted: 10 June 2021
                                           Common symptoms of osteosarcoma include pain, swelling, numbness, varicose veins, and even
          Published: 22 June 2021
                                           pathological fractures. Osteosarcoma is highly malignant, grows rapidly, and often spreads to the lungs
                             Citation:     through blood. Some sarcomas, in contrast, are more common in the elderly, such as liposarcoma and
 Zhou J, Wang M, Zhou Z, Wang W,
                                           leiomyosarcoma, of which the clinical manifestations are often non-specific and are often related to the
Duan J and Wu G (2021) Expression
and Prognostic Value of MCM Family
                                           degree of the malignancy. Soft tissue sarcomas account for about 0.8% of human malignant tumors, with
             Genes in Osteosarcoma.        the annual incidence rate of about 2.38/100,000 in China and increasing significantly with age. The most
        Front. Mol. Biosci. 8:668402.      common site of soft tissue sarcomas is limb, accounting for 53%, followed by retroperitoneum (19%), trunk
    doi: 10.3389/fmolb.2021.668402         (12%), head and neck (11%). The most common primary bone malignant tumor is classic osteosarcoma,

Frontiers in Molecular Biosciences | www.frontiersin.org                          1                                            June 2021 | Volume 8 | Article 668402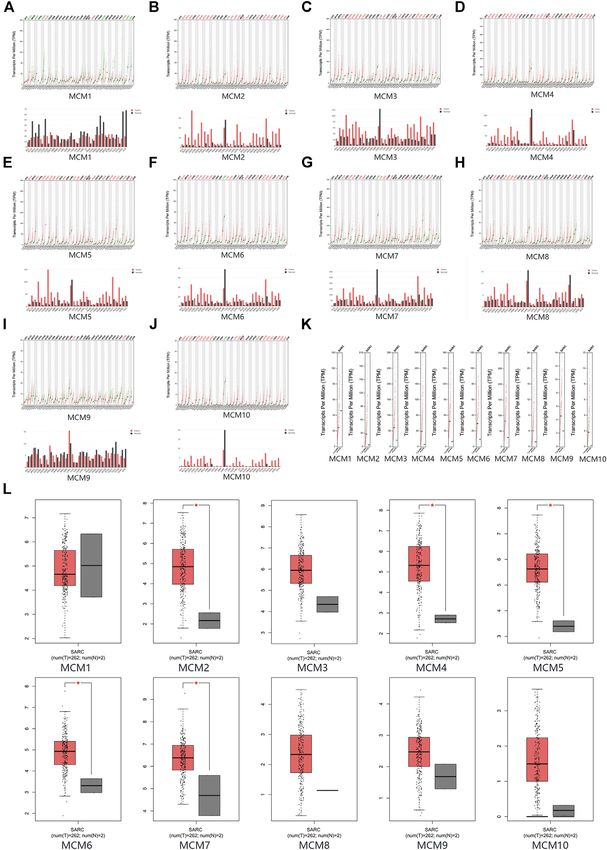
Zhou et al.                                                                                                           Prognosis for MCMs in Sarcoma

which accounts for about 0.2% of human malignant tumors. The                 The p value was generated by using a Students’ t-test. We defined
most common sites of incidence are the distal femur and proximal             the cut-off of p-value and fold change as 0.01 and 2, respectively. It
tibia, followed by In the proximal humerus, osteosarcomas in these           was also used to find the co-expression genes of MCMs in sarcoma.
three locations account for approximately 85% of all osteosarcomas.
Now, sarcomas are divided into two categories at the molecular level:
1) genetically complex, high mutation burden, and complex                    Gene Expression Profile Interactive
karyotype; and 2) genetically simple, with a single disease-specific          Analysis Dataset
translocation, mutation, or amplification in a relatively static genome       GEPIA (Gene Expression Profile Interactive Analysis) is a web-
background, mutation or amplification. This histological and                  based tool for delivering fast and customizable functionalities
molecular heterogeneity makes sarcomas particularly difficult to              based on TCGA and GTEx data. In our study, Data from the
diagnose. Therefore, new biomarkers are needed as prognostic                 GEPIA datasets were used to analyze the different expression
indicators to guide individualized treatment and improve patients’           levels of MCMs in sarcoma and normal tissues. We also analyzed
prognosis (Dancsok et al., 2017).                                            the correction between MCMs in sarcoma by using the GEPIA
    Minichromosome maintenance proteins (MCMs) comprised                     dataset. In order to explore the prognostic value of MCMs in
ten proteins, which play essential roles in DNA replication and cell         sarcoma patients, GEPIA was also used to analyze the association
cycle progression (Maiorano et al., 2006; Li et al., 2019). They were        of the expression levels of MCMs with the OS and DFS.
first discovered in Saccharomyces cerevisiae and identified as
essential factors for the maintenance of extra-chromosomal                   Cancer Cell Line Encyclopedia Dataset
DNA (Ishimi, 2018). MCM1 influences the process of cell cycle,                CCLE (Cancer Cell Line Encyclopedia) is a tumor genomics
growth, differentiation, and apoptosis by regulating the activation          research project led by the Broad Institute. It collects and sorts
of multiple genes. It belongs to MADS box transcription factor               out the omics data of 1,457 cell lines. We analyzed the expression
family (Pramila et al., 2002). The MCM2-7 form a heterohexameric             levels of the ten MCMs in sarcoma cell lines, by using CCLE dataset.
complex that serves as a DNA duplicating helicase, which unwinds
the DNA duplex template during DNA replication (Fei and Xu,
2018; Suzuki et al., 2019). MCM8 and nine were reported to make              Kyoto Encyclopedia of Genes and Genomes
up the CMG complex with Cdt1 and GINS. (Griffin and Trakselis,                Dataset
2019). MCM10 plays an important role in the initiation of DNA                KEGG (Kyoto Encyclopedia of Genes and Genomes) is a practical
replication and elongation (Baxley and Bielinsky, 2017). As same as          database resource for understanding advanced functions and
many DNA replication proteins, MCM proteins were reported to                 biological systems (such as cells, organisms, and ecosystems),
play an important role in cancer development (Yu et al., 2020).              genome sequencing and other high-throughput experimental
MCMs has been detected that were overexpressed in multiple                   technologies generated from molecular level information,
cancer tissues and carcinoma cell lines, such as lymphomas                   especially large molecular data sets. In our study, we used data
(Marnerides et al., 2011; Rusiniak et al., 2012), brain tumors               from the KEGG to analyze the functional role of MCM2–7
(Winther and Torp, 2017; Cai et al., 2018), gastrointestinal tract           complex in DNA replication and cell cycle.
tumors (Giaginis et al., 2009; Shomori et al., 2010; Peng et al.,
2016), breast cancer (Wojnar et al., 2011), prostate cancer (Stewart         CpG Island Prediction
et al., 2017), renal cell carcinoma (Zhong et al., 2017), and lung           We obtained the human MCM4 (ENSG00000104738) sequence
squamous cell carcinoma (Wu et al., 2018). However, the role of              from Ensembl genome browser (http://asia.ensembl.org/index.
MCM family members in the development of sarcoma has not                     html). We used MethPrimer software (http://www.urogene.org/
been fully understood, and its prognostic value for sarcoma is still         methprimer) to analyze CpG islands, and to detect the first exon
unknown. In this present study, we used database research and                sequence. We predict the candidate transcription factor by
bioinformatic analysis to assess the expression of MCMs in                   JASPAR (http://jaspar.binf.ku.dk/).
sarcoma and analyze its prognostic value for sarcoma.
                                                                             Cell Culture
                                                                             We purchase hFOB1.19 cell line in Chinese Science Institute
METHODS                                                                      (Shanghai, China). hFOB1.19 cells were cultured in Roswell Park
                                                                             Memorial Institute (RPMI) 1,640 medium (HyClone, Logan, UT,
Oncomine Analysis                                                            United States), containing 10% fetal bovine serum (FBS) (Sijiqing,
Oncomine is currently the world’s largest cancer gene chip                   Hangzhou, China).
database and integrated data mining platform. It aims to mine
cancer genetic information. It integrates RNA and DNA-seq data               Total RNA Isolation and qRT-PCR
from GEO, TCGA and published literature sources, and has the                 We isolate RNA from 100 mg of tissue (liquid nitrogen grounding
most complete cancer mutation spectrum, gene expression data                 method performed before RNA extraction) and 2 × 10⁶ cells by
and related clinical information. It can be used to discover new             TRIzol Reagent (Invitrogen, Carlsbad, CA, United States). We
biomarkers and new therapeutic targets.                                      performed RNA qualification and quantification using Biotek
   With using Oncomine datasets, we performed multiple                       (Winooski, VT, United States). A total of 2 μg RNA was reverse
expression analyses of MCMs in sarcoma and normal samples.                   transcribed to cDNA with Superscript III Reverse Transcriptase

Frontiers in Molecular Biosciences | www.frontiersin.org                 2                                       June 2021 | Volume 8 | Article 668402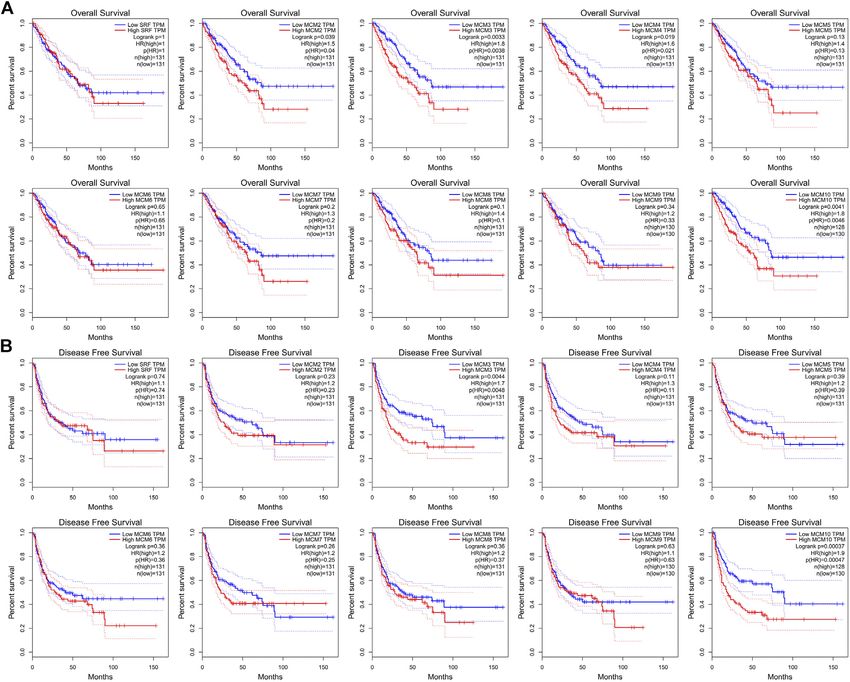
Zhou et al. Prognosis for MCMs in Sarcoma
(Invitrogen). Quantitative real-time PCRs (qRT-PCRs) were with normal tissues, MCM1 was overexpressed in
conducted in an ABI StepOnePlus instrument, with the SYBR leiomyosarcoma with a fold change of 2.063 (Table 1).
(TaKaRa) system, and a thermal profile of 40 cycles of 95°C for Quade Uterus datasets (Quade et al., 2004) showed that
10 s and 58°C for 30 s. All of the results were standardized to the MCM2 was overexpressed in uterine corpus leiomyosarcoma
expression level of the housekeeping gene, β-actin. Relative with a fold change of 26.250. The datasets of Barretina
mRNA expression levels were calculated using 2−△△ CT. Sarcoma (Barretina et al., 2010) also showed the increased
expression of MCM2. The fold change of MCM2 in patients
Western Blot with pleomorphic liposarcoma, myxofibrosarcoma,
We washed the monolayer cells with 1× PBS and extracted the leiomyosarcoma, myxoid/round cell liposarcoma and
proteins by using RIPA lysis buffer. All the specimens were dedifferentiated liposarcoma was 3.538, 3.819, 4.437, 3.012,
centrifuged (10000 g, 4°C for 10 min). Protein concentration and 2.539, respectively. Using datasets of Detwiller Sarcoma,
was measured using BCA protein assay kit (Beyotime). MCM2 was also found to be overexpressed in leiomyosarcoma
Proteins were resolved by 10% SDS-PAGE and then (fold change 7.904), fibrosarcoma (fold change 4.867) and
transferred to PVDF membranes which was blocked using 5% malignant fibrous histiocytoma (fold change 4.180) compared
non-fat milk in 1× TBS mixed with Tween-20. After that, the with normal samples (Table 1).
membrane was incubated overnight with anti-MCM2/4 antibody Using Barretina Sarcoma’s datasets, MCM3 was found to be
(1:2000, abcam) at 4°C. The PVDF membrane was washed using overexpressed in pleomorphic liposarcoma (fold change 2.316),
1 × TBS-T for 15 min for 3 times. Secondary anti-rabbit IgG myxoid/round cell liposarcoma (fold change 2.769),
antibody was used to incubate (1:10,000, biosharp) for 1 h. myxofibrosarcoma (fold change 2.122) and leiomyosarcoma
Electrochemiluminescence was added to PVDF membrane and (fold change 2.212) when compared with normal samples.
the membrane was exposed on an X-ray film. MCM3 was also overexpressed in fibrosarcoma with a fold
change of 2.979 and synovial sarcoma with a fold change of
Cell Proliferation Assay 2.167, reported in Detwiller Sarcoma (Table 1).
We analyzed cell proliferation by the Cell Counting Kit-8 (Dojindo). Using datasets of Barretina Sarcoma, compared with normal
After 2 days, hFOB1.19 cells were inducible. AzadC-treated cells were samples, MCM4 was overexpressed in pleomorphic liposarcoma,
then incubated for another 24 h. A BioTek microplate reader was used myxofibrosarcoma, dedifferentiated liposarcoma,
to measure the optical density of each group. leiomyosarcoma and myxoid/round cell liposarcoma, with the
fold change of 3.142, 3.455, 2.195, 3.042, and 2.227 respectively.
Cell Apoptosis Assay In Detwiller Sarcoma’s datasets, MCM4 was also showed to be
We analyzed the hFOB1.19 cell apoptosis using flow cytometry overexpressed in pleomorphic liposarcoma (fold change
method (FCM). We collected the cells 2 days after treatment with 13.735), fibrosarcoma (fold change 10.126), malignant
AzadC, washed with PBS, and suspended in 500 μL binding fibrous histiocytoma (fold change 10.011), synovial sarcoma
buffer. The cells were incubated with annexin V at room (fold change 3.401) and leiomyosarcoma (fold change 8.153),
temperature for 10 min and stained with PI, and then compared with normal samples (Table 1).
analyzed by FCM for relative quantitative apoptosis. Analysis using Barretina Sarcoma’s datasets found a higher
expression of MCM5 in pleomorphic liposarcoma (fold change
Statistics 3.772), leiomyosarcoma (fold change 3.538), myxoid/round cell
The data were presented as mean ± SD and statistical differences liposarcoma (fold change 2.817) and dedifferentiated liposarcoma
were determined with Student’s t test. In the presented study, the (fold change 2.536), when compared with normal samples. Using
experiments conducted have been repeated for 3 times. The Detwiller Sarcoma’s datasets, MCM5 was also found to be
representative experiments were shown in results. Significant overexpressed in malignant fibrous histiocytoma (fold change
differences were defined at p < 0.05. 4.703) compared with normal samples. (Table 1).
Overexpression of MCM6 in sarcoma was also found in both
datasets. In Detwiller Sarcoma’s datasets, MCM6 was
RESULTS overexpressed in leiomyosarcoma (fold change 5.847),
fibrosarcoma (fold change 5.500), malignant fibrous
Transcriptional Levels of Minichromosome histiocytoma (fold change 4.896) and synovial sarcoma (fold
Maintenance in Patients With Sarcoma change 4.175). In Barretina Sarcoma’s datasets, MCM6 was
Previous studies have identified ten MCM factors in eukaryotic overexpressed in pleomorphic liposarcoma (fold change 3.300),
cells and archaea (Maiorano et al., 2006). In the present study, we myxofibrosarcoma (fold change 3.234), leiomyosarcoma (fold
used ONCOMINE database to compare the transcription levels of change 3.034), dedifferentiated liposarcoma (fold change
MCMs in cancer and normal tissues. The results showed that 2.076) and myxoid/round cell liposarcoma (fold change 2.141)
MCMs were generally upregulated in various of tumors. In compared with normal samples (Table 1).
sarcoma, most of MCM members were highly expressed in Analyses using these two datasets also showed the
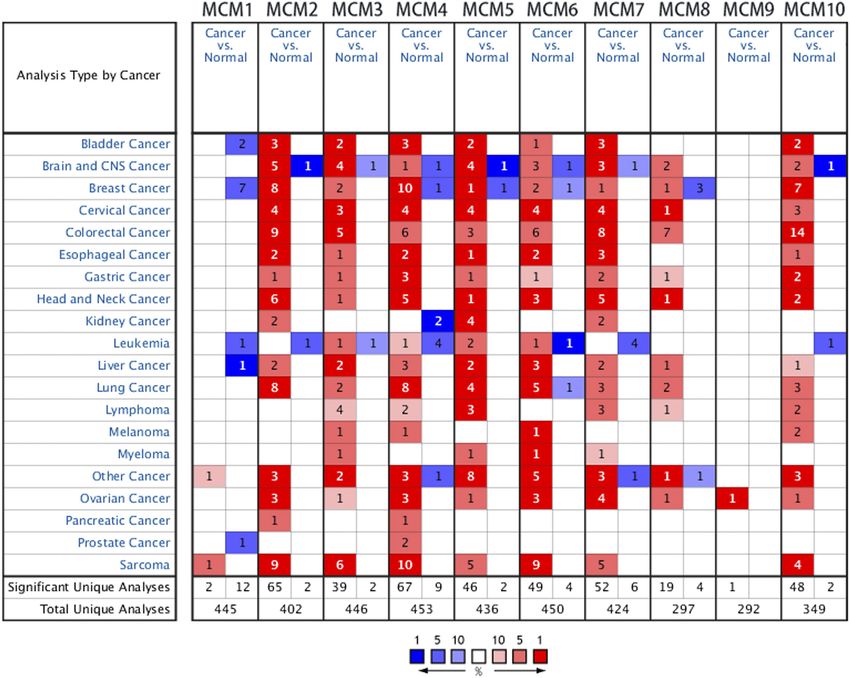
cancer tissues, except for MCM8 and MCM9 (Figure 1). The overexpression of MCM7 in sarcoma. Using Barretina
mRNA expression levels of MCMs were showed in Table 1. In the Sarcoma’s datasets, the results showed that MCM7 was higher
datasets of Detwiller Sarcoma (Detwiller et al., 2005), compared expressed in myxoid/round cell liposarcoma (fold change 3.047),
Frontiers in Molecular Biosciences | www.frontiersin.org 3 June 2021 | Volume 8 | Article 668402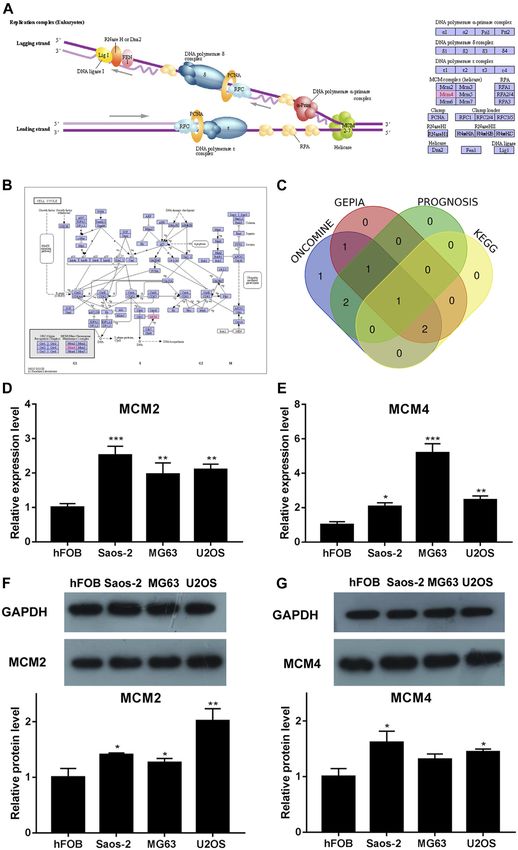
Zhou et al. Prognosis for MCMs in Sarcoma
FIGURE 1 | The transcription levels of MCM factors in different types of cancers.
pleomorphic liposarcoma (fold change 2.349), leiomyosarcoma that except for MCM1, all other MCM factors had higher
(fold change 2.288) and myxofibrosarcoma (fold change 2.339) expression levels in sarcoma than in normal tissues (p < 0.05
compared with normal samples. Using Detwiller Sarcoma’s for MCM2, MCM4, MCM5, MCM6 and MCM7)
datasets, the results showed the overexpression of MCM7 in (Figures 2A–L).
fibrosarcoma (fold change 2.236) compared with normal
samples (Table 1).
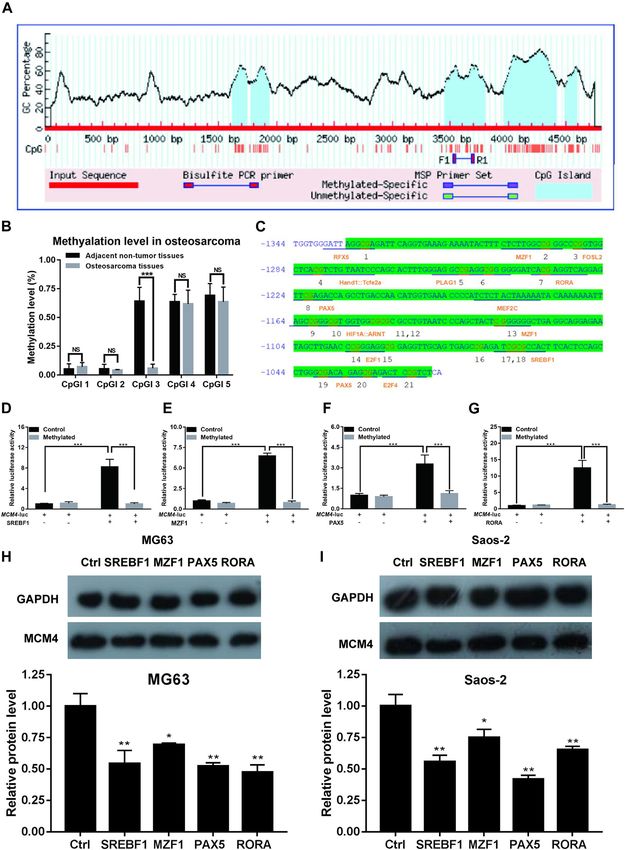
Overexpression of MCM10 was found in the analysis using Minichromosome Maintenance Expression
Detwiller Sarcoma’s datasets. The MCM10 fold change of patients in Sarcoma Cell Lines
with round cell liposarcoma, Malignant fibrous histiocytoma, CCLE was used to expand the detailed annotation process of the
synovial Sarcoma and fibrosarcoma was 7.893, 7.758, 5.892, and preclinical human cancer models. We found that the ten MCM
9.258, respectively (Table 1). family members were all highly expressed in sarcoma cell lines
(Figure 3).
Association Between Minichromosome
Maintenance mRNA Levels and The Prognostic Values of Minichromosome
Clinicopathological Parameters in Patients Maintenance in Sarcoma
With Sarcoma We investigated the prognostic role of the ten MCM factors in
The mRNA expression levels of MCM factors in sarcoma and sarcoma by using the GEPIA online service. The results showed
normal tissues were compared using GEPIA datasets. We found that high levels of MCM3 and MCM10 mRNA significantly
Frontiers in Molecular Biosciences | www.frontiersin.org 4 June 2021 | Volume 8 | Article 668402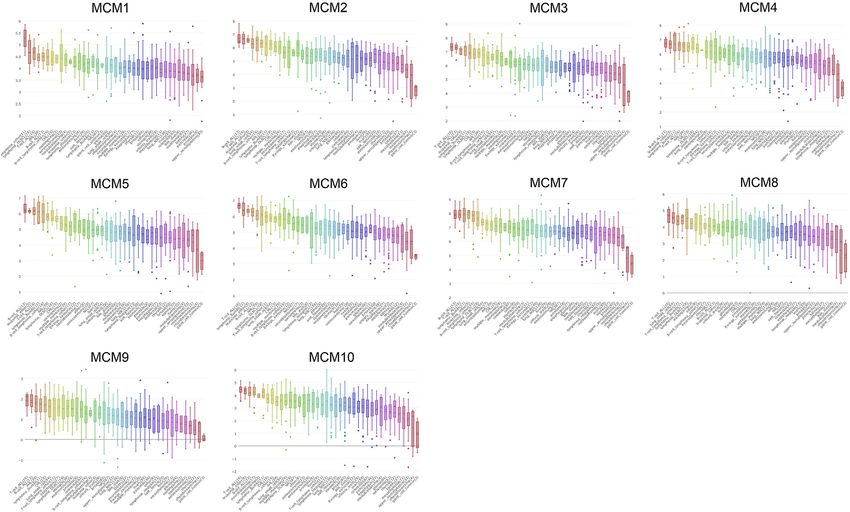
Zhou et al.                                                                                                             Prognosis for MCMs in Sarcoma

TABLE 1 | The significant changes of MCMs expression in subgroups of sarcoma.

Gene ID                     Types of sarcoma vs. Normal                 Fold change               p Value          t Test                Renfrences

MCM1                  Leiomyosarcoma vs. Normal                             2.063                 9.03E-5           4.752             Detwiller sarcoma
MCM2                  Uterine corpus leiomyosarcoma vs. Normal             26.250                 3.47E-7          12.037             Quade uterus
                      Pleomorphic liposarcoma vs. Normal                    3.538                5.71E-14          12.932             Barretina sarcoma
                      Myxofibrosarcoma vs. Normal                            3.819                3.38E-16          14.472             Barretina sarcoma
                      Leiomyosarcoma vs. Normal                             4.437                1.15E-13          11.848             Barretina sarcoma
                      Myxoid/Round cell liposarcoma vs. Normal             3.012                 7.51E-13          13.922             Barretina sarcoma
                      Dedifferentiated liposarcoma vs. Normal               2.539                8.57E-13          10.845             Barretina sarcoma
                      Leiomyosarcoma vs. Normal                             7.904                 1.54E-7           8.860             Detwiller sarcoma
                      Fibrosarcoma vs. Normal                              4.867                  2.06E-6           6.741             Detwiller sarcoma
                      Malignant fibrous histiocytoma vs. Normal              4.180                 1.05E-6           6.440             Detwiller sarcoma
MCM3                  Pleomorphic liposarcoma vs. Normal                    2.316                2.00E-13          12.368             Barretina sarcoma
                      Myxoid/Round cell liposarcoma vs. Normal             2.769                 9.19E-14          13.442             Barretina sarcoma
                      Myxofibrosarcoma vs. Normal                            2.122                1.02E-11           9.391             Barretina sarcoma
                      Leiomyosarcoma vs. Normal                             2.212                9.93E-10           8.245             Barretina sarcoma
                      Fibrosarcoma vs. Normal                              2.979                  1.98E-7           8.423             Detwiller sarcoma
                      Synovial sarcoma vs. Normal                           2.167                 4.19E-5           6.349             Detwiller sarcoma
MCM4                  Pleomorphic liposarcoma vs. Normal                    3.142                3.36E-15          14.259             Barretina sarcoma
                      Myxofibrosarcoma vs. Normal                            3.455                1.12E-15          12.861             Barretina sarcoma
                      Dedifferentiated liposarcoma vs. Normal               2.195                6.46E-14          10.370             Barretina sarcoma
                      Leiomyosarcoma vs. Normal                             3.042                9.01E-11           9.360             Barretina sarcoma
                      Myxoid/Round cell liposarcoma vs. Normal             2.227                 3.15E-10           9.407             Barretina sarcoma
                      Pleomorphic liposarcoma vs. Normal                   13.735                 1.34E-8          10.545             Detwiller sarcoma
                      Fibrosarcoma vs. Normal                              10.126                 2.41E-8           8.507             Detwiller sarcoma
                      Malignant fibrous histiocytoma vs. Normal             10.011                 1.50E-8           8.331             Detwiller sarcoma
                      Synovial sarcoma vs. Normal                           3.401                 5.28E-7           7.400             Detwiller sarcoma
                      Leiomyosarcoma vs. Normal                             8.153                 2.50E-6           6.623             Detwiller sarcoma
MCM5                  Pleomorphic liposarcoma vs. Normal                    3.772                8.63E-10          10.061             Barretina sarcoma
                      Leiomyosarcoma vs. Normal                             3.538                 2.41E-9           8.260             Barretina sarcoma
                      Myxoid/Round cell liposarcoma vs. Normal             2.817                  7.49E-8           8.303             Barretina sarcoma
                      Dedifferentiated liposarcoma vs. Normal               2.536                 8.54E-7           8.457             Barretina sarcoma
                      Malignant fibrous histiocytoma vs. Normal              4.703                 8.32E-5           4.561             Detwiller sarcoma
MCM6                  Leiomyosarcoma vs. Normal                             5.847                 3.58E-7           8.247             Detwiller sarcoma
                      Fibrosarcoma vs. Normal                              5.500                  5.30E-7           7.678             Detwiller sarcoma
                      Malignant fibrous histiocytoma vs. Normal              4.896                 7.34E-7           6.930             Detwiller sarcoma
                      Synovial sarcoma vs. Normal                           4.175                 2.67E-5           6.725             Detwiller sarcoma
                      Pleomorphic liposarcoma vs. Normal                    3.300                3.76E-12          10.849             Barretina sarcoma
                      Myxofibrosarcoma vs. Normal                            3.234                3.06E-15          12.962             Barretina sarcoma
                      Leiomyosarcoma vs. Normal                             3.034                1.41E-12          10.712             Barretina sarcoma
                      Dedifferentiated liposarcoma vs. Normal               2.076                2.14E-10          10.804             Barretina sarcoma
                      Myxoid/Round cell liposarcoma vs. Normal             2.141                 2.91E-10           9.875             Barretina sarcoma
MCM7                  Myxoid/Round cell liposarcoma vs. Normal              3.047                1.35E-10          12.092             Barretina sarcoma
                      Pleomorphic liposarcoma vs. Normal                    2.349                 1.27E-8           9.695             Barretina sarcoma
                      Leiomyosarcoma vs. Normal                             2.288                 9.17E-9           8.526             Barretina sarcoma
                      Myxofibrosarcoma vs. Normal                            2.339                 9.65E-9           9.552             Barretina sarcoma
                      Fibrosarcoma vs. Normal                              2.236                  3.44E-5           5.259             Detwiller sarcoma
MCM8                  NA                                                     NA                     NA               NA               NA
MCM9                  NA                                                     NA                     NA               NA               NA
MCM10                 Round cell liposarcoma vs. Normal                     7.893                 2.81E-7           8.065             Detwiller sarcoma
                      Malignant fibrous histiocytoma vs. Normal              7.758                 5.16E-8           7.751             Detwiller sarcoma
                      Synovial sarcoma vs. Normal                           5.892                 7.40E-6           6.531             Detwiller sarcoma
                      Fibrosarcoma vs. Normal                              9.258                  1.26E-5           6.289             Detwiller sarcoma

decreased the over survival (OS) (p < 0.05) and disease-free                       Kyoto Encyclopedia of Genes and Genomes
survival (DFS) (p < 0.05) of sarcoma patients (Figures 4A,B).                      Analysis and Venn Diagram Analysis
Moreover, high levels of MCM2 and MCM4 mRNA significantly
                                                                                   We analyzed the pathways related to the function changes of
decreased the OS (p < 0.05) of sarcoma patients (Figure 4A). The
                                                                                   MCMs by using KEGG datasets. The results showed that
mRNA expression levels of other MCM factors had no
statistically significant effect on OS and DFS in patients with                     MCM2–7 proteins formed a heterohexamer complex and
sarcoma (Figures 4A,B). Therefore, MCM2, MCM3, MCM4, and                           participated in the initial step of DNA synthesis (Figure 5A).
MCM10 were four potential biomarkers for the prognosis of                          The cell cycle pathway was involved in the tumorigenesis and
sarcoma and a higher expression indicates worse outcomes.                          pathogenesis of sarcoma (Figure 5B). A venn diagram was used

Frontiers in Molecular Biosciences | www.frontiersin.org                       5                                   June 2021 | Volume 8 | Article 668402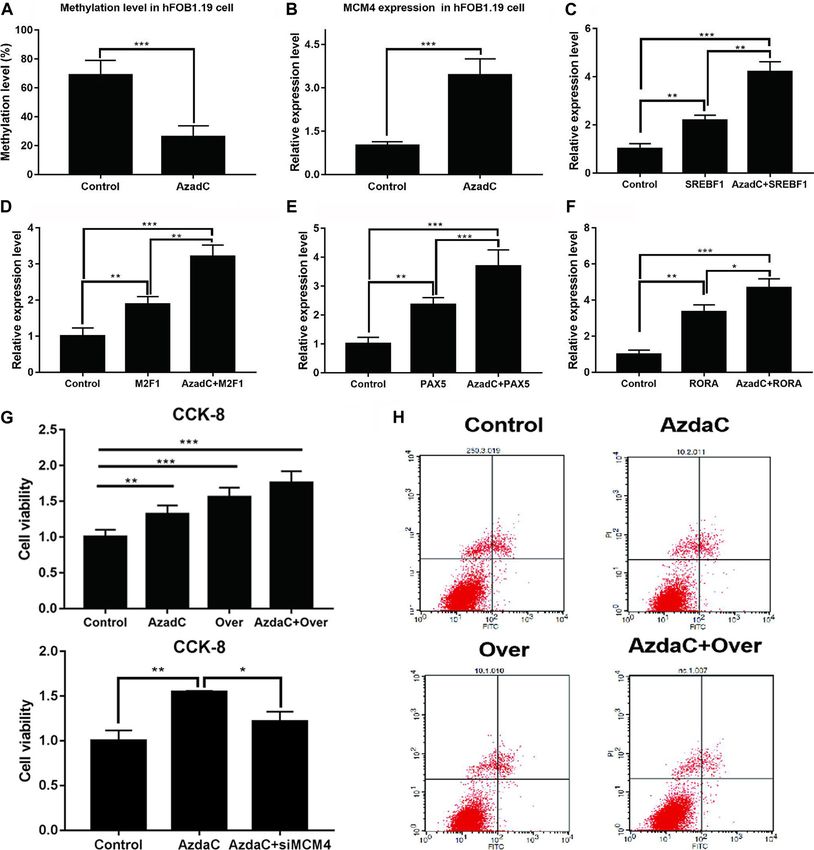
Zhou et al.                                                                                                                Prognosis for MCMs in Sarcoma

  FIGURE 2 | The expression of MCMs in sarcoma. (A–J) The expression of MCM1-10 in pan-cancer. (K–L) The expression of MCMs in sarcoma.

to show the relationship between ONCOMINE, GEPIA,                               were elevated expressed in ONCOMINE and GEPIA
PROGNOSIS biomarker and KEGG datasets (Figure 5C).                              datasets with prognostic values, so the key MCM family
According to the results, we found that MCM2 and MCM4                           genes including MCM2 and MCM4 were chosen to be

Frontiers in Molecular Biosciences | www.frontiersin.org                    6                                        June 2021 | Volume 8 | Article 668402
Zhou et al.                                                                                                    Prognosis for MCMs in Sarcoma

  FIGURE 3 | The expression of MCMs sarcoma cell lines.

confirmed in sarcoma cell lines (Figures 5D–G). Previous study            transcription factors SREBF1, MZF1, PAX5, and RORA activated
indicated that MCM4 and MCM6-7 constituted a core structure of           MCM4-luc expression, but transcription factors SREBF1, MZF1,
MCM2-7 hexamers (Champasa et al., 2019). We found that MCM4              PAX5 and RORA were not able to activate MCM4-luc
played a core role in all analyses (using ONCOMINE, GEPIA,               expression when MCM4-luc was methylated in vivo (Figures
PROGNOSIS biomarker and KEGG datasets) and the differential              6D–G). Additionally, we found that knockdown of these
expression of MCM4 in osteosarcoma cell line was confirmed using          transcription factors including SREBF1, MZF1, PAX5 and
qRT-PCR and western blot, this has led us to further explore the         RORA can reduce the MCM4 protein level in MG63 and
mechanism of prognostic value of MCM4 in sarcoma.                        Saos-2 cell line (Figures 6H,I). The results indicated that
                                                                         transactivation of potential transcription factors is affected by
                                                                         methylated MCM4 promoter.
Methylation of MCM4 Promoter Inhibits the
Transactivation of Potential Transcription                               Demethylation of MCM4 on the Proliferation
Factors                                                                  and Apoptosis of hFOB1.19 Cells
We obtained the 5 kb MCM4 promoter sequence via the Ensembl              Bisulfite sequencing PCR results indicated that the methylation
genome browser. CpG islands were identified using MethPrimer              ratio of the MCM4 promoter decreased after AzadC treatment
software. Five CpG islands were identified in the 5 kb promoter           (Figure 7A). The results of qRT-PCR showed that expression of
region (Figure 6A). The degree of methylation of CpGI three was          MCM4 significantly increased after AzadC treatment
significantly reduced in patients with osteosarcoma (Figure 6B).          (Figure 7B). We investigated if overexpression of potential
To check MCM4 gene modulation, the transcription factor                  transcription factors increased demethylated MCM4 gene
binding sites of the CpGI three were analyzed using JASPAR.              expression. HFOB1.19 cells were co-transfected with potential
In the CpGI 3, the following transcription factors were predicted        transcription factors. The results of qRT-PCR indicated that the
to interact with the CpG sites: RFX5, M2F1, FOSL2, PLAG1,                transcription factors SREBF1, MZF1, PAX5, and RORA could
RORA, PAX5, MEF2C, MZF1, E2F1, SREBF1, PAX5, and E2F4                    activate MCM4 expression alone. When SREBF1, MZF1, PAX5,
(Figure 6C). We selected these four transcription factors with the       and RORA were treated along with AzadC, the expression of
highest scores including SREBF1, MZF1, PAX5, and RORA for                MCM4 expression increased significantly, compared with that
further investigation. According to the results, we found that           observed for transcription factor alone (Figures 7C–F).

Frontiers in Molecular Biosciences | www.frontiersin.org             7                                    June 2021 | Volume 8 | Article 668402
Zhou et al. Prognosis for MCMs in Sarcoma FIGURE 4 | The prognostic value of MCMs in patients with sarcoma. (A) The association between MCM genes and overall survival in patients with sarcoma. (B) The association between MCM genes and disease-free survival in patients with sarcoma. HR, hazard ratio; TPM, Transaction per million. Moreover, the CCK-8 and TUNEL experiment was conducted DISCUSSION to detect hFOB1.19 cellular proliferation and apoptosis after treatment with AzadC. The results indicated that AzadC Proteins involved in the replication of DNA were widely proposed as promoted hFOB1.19 proliferation compared to control. In promising cancer biomarkers (Yu et al., 2020). MCMs family has ten order to check the MCM4 function, overexpression was members and each of them was essential for viability. This protein performed and the results indicated that sole overexpression of family plays an important role in different stages of DNA replication, MCM4 obtained similar results as AzadC treatment. Together, especially the initial step (Edwards et al., 2002; Das and Rhind, 2016). MCM4 overexpression and AzadC treatment showed the The overexpression of MCM factors was identified in multiple stronger promotion of cell proliferation, and siMCM4 cancers, including breast cancer, lung cancer and colorectal cancer decreased the effect of proliferation induced by AzadC (Gonzalez et al., 2003; Nishihara et al., 2008; Liu et al., 2017; Yu et al., (Figure 7G). The TUNEL experiment results showed that 2020). To our best knowledge, this is the first study that systematically AzadC decreased the apoptosis of hFOB1.19 cells compared to analyzed the expression and prognostic value of MCM factors in control. The sole overexpression of MCM4 obtained similar human sarcoma. The study results may have important implications results as AzadC treatment. Together, MCM4 overexpression for improving the prognosis of sarcoma patients. and AzadC treatment showed stronger inhibition of cell apoptosis MCM1 was reported to be localized at the replication origins than the control (Figure 7H). The results showed that decreased of DNA and influences the local structure of replication origins MCM4 methylation enhanced cellular proliferation and inhibited (Chang et al., 2003). In our study, we analyzed the expression apoptosis in hFOB1.19 cells. level of MCM1 suing ONCOMINE datasets, and found that the Frontiers in Molecular Biosciences | www.frontiersin.org 8 June 2021 | Volume 8 | Article 668402
Zhou et al.                                                                                                                          Prognosis for MCMs in Sarcoma

  FIGURE 5 | KEGG analysis of MCMs, crosscheck of analysis and differential expression of MCM2 and MCM4 in osteosarcoma cell lines. (A) DNA replication and
  (B) cell cycle pathway regulated by the MCM alteration in sarcoma (KEGG). (C) Crosscheck of the results of ONCOMIN, GEPIA, Prognosis and KEGG analysis. Elevated
  expression of (D) MCM2 and (E) MCM4 detected in osteosarcoma cell lines using qRT-PCR. Up regulated expression of (F) MCM2 and (G) MCM4 detected in
  osteosarcoma cell lines using western blot, *p < 0.05, **p < 0.01, ***p < 0.001.

Frontiers in Molecular Biosciences | www.frontiersin.org                          9                                            June 2021 | Volume 8 | Article 668402
Zhou et al.                                                                                                                       Prognosis for MCMs in Sarcoma

  FIGURE 6 | Methylation analysis of MCM4. (A) Five CpG islands were predicted in the MCM4 promoter region. (B) The methylation rate of CpGI3 was significantly
  decreased in osteosarcoma tissues compared with the normal tumor-adjacent lung tissues. (C) A large CpG island predicted in the MCM4 promoter. (D–G) SREBF1,
  MZF1, PAX5, and RORA candidate transcription factor transactivation of MCM4 expression in cell transfection experiment. Knockdown of SREBF1, MZF1, PAX5, and
  RORA would reduce the MCM4 protein level in MG63 (H) and Saos-2 (I) cell lines, *p < 0.05, **p < 0.01, ***p < 0.001.

Frontiers in Molecular Biosciences | www.frontiersin.org                       10                                           June 2021 | Volume 8 | Article 668402
Zhou et al.                                                                                                                             Prognosis for MCMs in Sarcoma

  FIGURE 7 | Cell proliferation and apoptosis analysis of MCM4 demethylation and overexpression. (A) After treatment with AzadC, MCM4 promoter methylation
  level showed a significantly decreased methylation rate. (B) MCM4 mRNA level significantly increased. (C–F) The activity of transcription factors (SREBF1, MZF1, PAX5,
  and RORA) increased. (G) AzadC treatment and overexpression of MCM4 significantly promoted hFOB1.19 cell proliferation. SiMCM4 can decrease the effect
  of hFOB1.19 cell proliferation induced by AzadC. (H) AzadC treatment and overexpression of MCM4 significantly inhibited hFOB1.19 cell apoptosis, *p < 0.05,
  **p < 0.01, ***p < 0.001.

expression level of MCM1 was higher in sarcoma tissue than in                           prognostic value of MCM1 in sarcoma patients, but the result
normal tissue. But in GEPIA datasets, the result was opposite.                          showed that there was no significant relationship between the
Then we searched the expression levels of MCM1 in the cell lines                        expression level of MCM1 and DFS or OS of patients with sarcoma.
by using CCLE datasets and found MCM1 was highly expressed in                              MCM2-7 protein complex exhibits DNA helicase activity and
human cell lines. With GEPIA datasets, we tried to explore the                          plays central roles in regulating transcription, chromatin remodeling

Frontiers in Molecular Biosciences | www.frontiersin.org                           11                                             June 2021 | Volume 8 | Article 668402
Zhou et al.                                                                                                            Prognosis for MCMs in Sarcoma

and checkpoint responses (Ishimi, 2018). Previous studies                     the mechanism of prognostic value of MCM4 in sarcoma was
demonstrated that MCM2-7 protein complex could act as                         explored. The results revealed that demethylation treatment
biomarkers for dysplasia and malignancy (Freeman et al., 1999). It            increased the transactivation of potential transcription factors and
was also showed to be prognostic markers for many kinds of human              enabled high levels of MCM4 expression in hFOB1.19 cells. CKK-8
cancers (Liu et al., 2017). We analyzed the expression levels of these        and TUNEL experiment was conducted and the results showed that
six genes in ONCOMINE datasets and GEPIA datasets, the results                decreased MCM4 methylation enhanced cellular proliferation and
showed that they were all upregulated in sarcoma compared with                inhibited apoptosis in hFOB1.19 cells. Therefore, the prognostic role
normal tissues. Using CCLE datasets, we analyzed their expression             of MCM4 in sarcoma may be attributable to changes in DNA
levels in sarcoma cell lines and found that they were all highly              methylation patterns. There was limitation in the present study. The
expressed. But the prognosis value of the six genes in sarcoma was            data used for analysis were obtained from online services. We need
different. With further using GEPIA datasets, we analyzed the                 to carry out more clinical experiments in a well-established tumor
association between the high expression of these genes and the                cohort to confirm our findings.
OS and DSF of sarcoma patients. The results showed that high
expression of MCM2, MCM3 and MCM4 was significantly related to
poor OS of sarcoma patients. Highly expressed MCM3 was also                   CONCLUSIONS
significantly related to poor DFS of sarcoma patients. The other three
genes had no significant relation between the expression levels and            In this study, we found that MCM2, 3, 4, and 10 could be used as
the prognosis of sarcoma patients. So MCM2, MCM3, and MCM4                    molecular markers to identify high-risk subgroups of sarcoma
seemed to be three potential biomarkers for the prognosis of sarcoma.         patients. The four MCM family members, MCM2, 3, 4, and 10
    MCM8–9 also formed a complex and was a homolog of the                     could be prognostic biomarkers for human sarcoma and a higher
MCM2–7 hetero-hexameric helicase complex. The resent studies                  expression of these MCM factors predicts poorer outcomes. The
claimed that MCM8–9 played an essential role during replication               prognostic role of MCM4 may be attributable to changes in DNA
elongation and recombination of DNA (Maiorano et al., 2005;                   methylation patterns.
Gambus and Blow, 2013). Cancer cells underwent more
replication stress because they were hyperstimulated to grow, and
it was reported that inhibiting MCM8-9 could increase the                     DATA AVAILABILITY STATEMENT
sensitivity of tumors to cisplatin (Morii et al., 2019). In the
present study, we analyzed the expression levels of MCM8 and                  The original contributions presented in the study are included in
MCM9 in ONCOMINE datasets. But there was no data about the                    the article/Supplementary Material, further inquiries can be
two factors. Then we searched their expression level in GEPIA                 directed to the corresponding authors.The datasets used and/
datasets, and the results showed that both of them were upregulated           or analyzed during the current study are available from the
in sarcoma compared to normal tissues. Using CCLE datasets, we                corresponding author on reasonable request.
found that MCM8 and MCM9 were both overexpressed in che cell
line of sarcoma. At last, we analyzed the association between
expression levels of the two genes and the OS and DFS of                      AUTHOR CONTRIBUTIONS
sarcoma patients, with no significant associations observed.
    MCM10, an important regulator of DNA replication                          MW conducted the western blot, qRT-PCR, Cell assay, CCK8 and
initiation, was found to be crucial to maintain genome                        flow cytometry. JZ and GW performed ONCOMINE, GEPIA,
integrity (Bielinsky, 2016). There is accumulating evidence                   CCLE, Venn diagram and KEGG analysis. JZ and GW wrote the
suggesting that in the development of tumor, dysregulation of                 manuscript. WW and JD edited the paper. ZZ revised the
MCM10 contributed to aberrant proliferation and genome                        manuscript. JZ and GW provided the research guide. All
instability. MCM10 was reported to play an important role in                  authors read and approved the final manuscript.
several tumors including breast cancer and urothelial carcinoma
(Li et al., 2016; Yang and Wang, 2019). In our study, we analyzed
the expression level of MCM10 in ONCOMINE datasets and                        FUNDING
GEPIA datasets. The results showed that MCM10 was
upregulated in sarcoma compared to normal samples. In                         This work was supported by the Fundamental Research Funds for
CCLE, we also found that MCM10 was highly expressed in                        the Central Universities of Central South University (Grant No.
sarcoma cell lines. To explore the prognosis value of MCM10                   2018zzts930).
in sarcoma, we analyzed the data in GEPIA and found that highly
expressed MCM10 was associated with poor OS of sarcoma
patients, indicating that MCM10 was a potential biomarker of                  ACKNOWLEDGMENTS
prognosis for sarcoma patients.
    According to our results, we also found that MCM4 played a core           The authors would like to especially thank MW from Soochow
role in ONCOMINE, GEPIA, PROGNOSIS biomarker and KEGG                         University for his experimental support including western blot,
analysis and the differential expression of MCM4 in osteosarcoma              qRT-PCR, cell assay, CCK8 and flow cytometry. The authors
cell line was confirmed using qRT-PCR and western blot. Therefore,             thank ZZ for English language support in preparing manuscript.

Frontiers in Molecular Biosciences | www.frontiersin.org                 12                                      June 2021 | Volume 8 | Article 668402
Zhou et al. Prognosis for MCMs in Sarcoma
REFERENCES Marnerides, A., Vassilakopoulos, T. P., Boltetsou, E., Levidou, G., Angelopoulou,
M. K., Thymara, I., et al. (2011). Immunohistochemical Expression and
Prognostic Significance of CCND3, MCM2 and MCM7 in Hodgkin
Barretina, J., Taylor, B. S., Banerji, S., Ramos, A. H., Lagos-Quintana, M., DeCarolis, P. Lymhoma. Anticancer Res. 31, 3585–3594.
L., et al. (2010). Subtype-specific Genomic Alterations Define New Targets for Morii, I., Iwabuchi, Y., Mori, S., Suekuni, M., Natsume, T., Yoshida, K., et al.
Soft-Tissue Sarcoma Therapy. Nat. Genet. 42, 715–721. doi:10.1038/ng.619 (2019). Inhibiting the MCM8-9 Complex Selectively Sensitizes Cancer Cells
Baxley, R., and Bielinsky, A.-K. (2017). Mcm10: A Dynamic Scaffold at Eukaryotic to Cisplatin and Olaparib. Cancer Sci. 110, 1044–1053. doi:10.1111/
Replication forks. Genes 8, 73. doi:10.3390/genes8020073 cas.13941
Bielinsky, A.-K. (2016). Mcm10: The Glue at Replication forks. Cell Cycle 15, Nishihara, K., Shomori, K., Fujioka, S., Tokuyasu, N., Inaba, A., Osaki, M., et al. (2008).
3024–3025. doi:10.1080/15384101.2016.1216925 Minichromosome Maintenance Protein 7 in Colorectal Cancer: Implication of
Cai, H.-Q., Cheng, Z.-J., Zhang, H.-P., Wang, P.-F., Zhang, Y., Hao, J.-J., et al. Prognostic Significance. Int. J. Oncol. 33, 245–251. doi:10.3892/ijo_00000003
(2018). Overexpression of MCM6 Predicts Poor Survival in Patients with Peng, Y.-P., Zhu, Y., Yin, L.-D., Zhang, J.-J., Guo, S., Fu, Y., et al. (2016). The
Glioma. Hum. Pathol. 78, 182–187. doi:10.1016/j.humpath.2018.04.024 Expression and Prognostic Roles of MCMs in Pancreatic Cancer. PLoS One 11,
Champasa, K., Blank, C., Friedman, L. J., Gelles, J., and Bell, S. P. (2019). A e0164150. doi:10.1371/journal.pone.0164150
Conserved Mcm4 Motif Is Required for Mcm2-7 Double-Hexamer Formation Pramila, T., Miles, S., GuhaThakurta, D., Jemiolo, D., and Breeden, L. L. (2002).
and Origin DNA Unwinding. Elife 8. e45538. doi:10.7554/eLife.45538 Conserved Homeodomain Proteins Interact with MADS Box Protein Mcm1 to
Chang, V. K., Fitch, M. J., Donato, J. J., Christensen, T. W., Merchant, A. M., and Restrict ECB-dependent Transcription to the M/G1 Phase of the Cell Cycle.
Tye, B. K. (2003). Mcm1 Binds Replication Origins. J. Biol. Chem. 278, Genes Dev. 16, 3034–3045. doi:10.1101/gad.1034302
6093–6100. doi:10.1074/jbc.M209827200 Quade, B. J., Wang, T.-Y., Sornberger, K., Cin, P. D., Mutter, G. L., and Morton, C.
Dancsok, A. R., Asleh-Aburaya, K., and Nielsen, T. O. (2017). Advances in Sarcoma C. (2004). Molecular Pathogenesis of Uterine Smooth Muscle Tumors from
Diagnostics and Treatment. Oncotarget 8, 7068–7093. doi:10.18632/oncotarget.12548 Transcriptional Profiling. Genes Chromosom. Cancer 40, 97–108. doi:10.1002/
Das, S. P., and Rhind, N. (2016). How and Why Multiple MCMs Are Loaded at gcc.20018
Origins of DNA Replication. Bioessays 38, 613–617. doi:10.1002/bies.201600012 Rusiniak, M. E., Kunnev, D., Freeland, A., Cady, G. K., and Pruitt, S. C. (2012).
Detwiller, K. Y., Fernando, N. T., Segal, N. H., Ryeom, S. W., D’Amore, P. A., and Mcm2 Deficiency Results in Short Deletions Allowing High Resolution
Yoon, S. S. (2005). Analysis of Hypoxia-Related Gene Expression in Sarcomas and Identification of Genes Contributing to Lymphoblastic Lymphoma.
Effect of Hypoxia on RNA Interference of Vascular Endothelial Cell Growth Oncogene 31, 4034–4044. doi:10.1038/onc.2011.566
Factor a. Cancer Res. 65, 5881–5889. doi:10.1158/0008-5472.CAN-04-4078 Shomori, K., Nishihara, K., Tamura, T., Tatebe, S., Horie, Y., Nosaka, K., et al.
Edwards, M. C., Tutter, A. V., Cvetic, C., Gilbert, C. H., Prokhorova, T. A., (2010). Geminin, Ki67, and Minichromosome Maintenance 2 in Gastric
and Walter, J. C. (2002). MCM2-7 Complexes Bind Chromatin in a Hyperplastic Polyps, Adenomas, and Intestinal-type Carcinomas:
Distributed Pattern Surrounding the Origin Recognition Complex Pathobiological Significance. Gastric Cancer 13, 177–185. doi:10.1007/
inXenopus Egg Extracts. J. Biol. Chem. 277, 33049–33057. doi:10.1074/ s10120-010-0558-z
jbc.M204438200 Stewart, P. A., Khamis, Z. I., Zhau, H. E., Duan, P., Li, Q., Chung, L. W. K., et al.
Fei, L., and Xu, H. (2018). Role of MCM2-7 Protein Phosphorylation in Human (2017). Upregulation of Minichromosome Maintenance Complex Component
Cancer Cells. Cell Biosci. 8, 43. doi:10.1186/s13578-018-0242-2 3 during Epithelial-To-Mesenchymal Transition in Human Prostate Cancer.
Freeman, A., Morris, L. S., Mills, A. D., Stoeber, K., Laskey, R. A., Williams, G. H., Oncotarget 8, 39209–39217. doi:10.18632/oncotarget.16835
et al. (1999). Minichromosome Maintenance Proteins as Biological Markers of Suzuki, Y., Yamaguchi, Y., Hanada, H., and Ishimi, Y. (2019). Changes in MCM2-7
Dysplasia and Malignancy. Clin. Cancer Res. 5, 2121–2132. Proteins at Senescence. Genes Genet. Syst. 94, 123–132. doi:10.1266/ggs.18-
Gambus, A., and Blow, J. J. (2013). Mcm8 and Mcm9 Form a Dimeric Complex 00062
inXenopus Laevisegg Extract that Is Not Essential for DNA Replication Winther, T. L., and Torp, S. H. (2017). MCM7 Expression Is a Promising Predictor
Initiation. Cell Cycle 12, 1225–1232. doi:10.4161/cc.24310 of Recurrence in Patients Surgically Resected for Meningiomas. J. Neurooncol.
Giaginis, C., Georgiadou, M., Dimakopoulou, K., Tsourouflis, G., Gatzidou, E., 131, 575–583. doi:10.1007/s11060-016-2329-0
Kouraklis, G., et al. (2009). Clinical Significance of MCM-2 and MCM-5 Wojnar, A., Pula, B., Piotrowska, A., Jethon, A., Kujawa, K., Kobierzycki, C., et al.
Expression in colon Cancer: Association with Clinicopathological (2011). Correlation of Intensity of MT-I/II Expression with Ki-67 and MCM-2
Parameters and Tumor Proliferative Capacity. Dig. Dis. Sci. 54, 282–291. Proteins in Invasive Ductal Breast Carcinoma. Anticancer Res. 31, 3027–3033.
doi:10.1007/s10620-008-0305-z Wu, W., Wang, X., Shan, C., Li, Y., and Li, F. (2018). Minichromosome
Gonzalez, M. A., Pinder, S. E., Callagy, G., Vowler, S. L., Morris, L. S., Bird, K., et al. Maintenance Protein 2 Correlates with the Malignant Status and Regulates
(2003). Minichromosome Maintenance Protein 2 Is a strong Independent Proliferation and Cell Cycle in Lung Squamous Cell Carcinoma. Onco. Targets
Prognostic Marker in Breast Cancer. J. Clin. Oncol. 21, 4306–4313. Ther. 11, 5025–5034. doi:10.2147/OTT.S169002
doi:10.1200/JCO.2003.04.121 Yang, W. D., and Wang, L. (2019). MCM10 Facilitates the Invaded/migrated
Griffin, W. C., and Trakselis, M. A. (2019). The MCM8/9 Complex: A Recent Potentials of Breast Cancer Cells via Wnt/β-catenin Signaling and Is Positively
Recruit to the Roster of Helicases Involved in Genome Maintenance. DNA Interlinked with Poor Prognosis in Breast Carcinoma. J. Biochem. Mol. Toxicol.
Repair 76, 1–10. doi:10.1016/j.dnarep.2019.02.003 33, e22330. doi:10.1002/jbt.22330
Ishimi, Y. (2018). Regulation of MCM2-7 Function. Genes Genet. Syst. 93, 125–133. Yu, S., Wang, G., Shi, Y., Xu, H., Zheng, Y., and Chen, Y. (2020). MCMs in Cancer:
doi:10.1266/ggs.18-00026 Prognostic Potential and Mechanisms. Anal. Cell Pathol. 2020, 1–11.
Li, S., Jiang, Z., Li, Y., and Xu, Y. (2019). Prognostic Significance of doi:10.1155/2020/3750294
Minichromosome Maintenance mRNA Expression in Human Lung Zhong, H., Chen, B., Neves, H., Xing, J., Ye, Y., Lin, Y., et al. (2017). Expression of
Adenocarcinoma. Oncol. Rep. 42, 2279–2292. doi:10.3892/or.2019.7330 Minichromosome Maintenance Genes in Renal Cell Carcinoma. Cancer
Li, W.-M., Huang, C.-N., Ke, H.-L., Li, C.-C., Wei, Y.-C., Yeh, H.-C., et al. (2016). Manag. Res. 9, 637–647. doi:10.2147/CMAR.S146528
MCM10 Overexpression Implicates Adverse Prognosis in Urothelial
Carcinoma. Oncotarget 7, 77777–77792. doi:10.18632/oncotarget.12795 Conflict of Interest: The authors declare that the research was conducted in the
Liu, Y.-Z., Wang, B.-S., Jiang, Y.-Y., Cao, J., Hao, J.-J., Zhang, Y., et al. (2017). absence of any commercial or financial relationships that could be construed as a
MCMs Expression in Lung Cancer: Implication of Prognostic Significance. potential conflict of interest.
J. Cancer 8, 3641–3647. doi:10.7150/jca.20777
Maiorano, D., Cuvier, O., Danis, E., and Méchali, M. (2005). MCM8 Is an MCM2- Copyright © 2021 Zhou, Wang, Zhou, Wang, Duan and Wu. This is an open-access
7-Related Protein that Functions as a DNA Helicase during Replication article distributed under the terms of the Creative Commons Attribution License (CC
Elongation and Not Initiation. Cell 120, 315–328. doi:10.1016/j.cell.2004.12.010 BY). The use, distribution or reproduction in other forums is permitted, provided the
Maiorano, D., Lutzmann, M., and Méchali, M. (2006). MCM Proteins and DNA original author(s) and the copyright owner(s) are credited and that the original
Replication. Curr. Opin. Cel Biol. 18, 130–136. doi:10.1016/j.ceb.2006.02.006 publication in this journal is cited, in accordance with accepted academic practice.
Frontiers in Molecular Biosciences | www.frontiersin.org 13 June 2021 | Volume 8 | Article 668402You can also read