Assessment of Epigenetic and Phenotypic Variation in Populus nigra Regenerated via Sequential Regeneration - Frontiers
←
→
Page content transcription
If your browser does not render page correctly, please read the page content below
ORIGINAL RESEARCH
                                                                                                                                                 published: 06 July 2021
                                                                                                                                         doi: 10.3389/fpls.2021.632088

                                             Assessment of Epigenetic and
                                             Phenotypic Variation in Populus
                                             nigra Regenerated via Sequential
                                             Regeneration
                                             Weixi Zhang 1,2 , Yanbo Wang 1,2,3 , Shu Diao 1,2 , Shanchen Zhong 1,2 , Shu Wu 1,2 , Li Wang 1,2 ,
                                             Xiaohua Su 1,2 and Bingyu Zhang 1,2*
                                             1
                                              State Key Laboratory of Tree Genetics and Breeding, Research Institute of Forestry, Chinese Academy of Forestry, Beijing,
                                             China, 2 Key Laboratory of Tree Breeding and Cultivation of State Forestry and Grassland Administration, Research Institute
                                             of Forestry, Chinese Academy of Forestry, Beijing, China, 3 Nanchang Institute of Technology, Nanchang, China

                                             Somatic variation has been demonstrated in tissue culture regenerated plants of
                                             many species. In the genus Populus, phenotypic variation caused by changes in 5-
                                             methylcytosine within the plant genome have been reported. To date, the phenotypic
                                             and epigenetic stability of plants regenerated from sequential regeneration has not
                                             been tested in trees. In this study, we detected DNA methylation of CCGG sites in
                            Edited by:       regenerated plants of five generations in Populus nigra using methylation-sensitive
                     Alma Balestrazzi,       amplified polymorphisms, and evaluated their growth performance and physiological
               University of Pavia, Italy
                                             traits. About 10.86–26.80% of CCGG sites in the regenerated plant genome were
                       Reviewed by:
                                             demethylated and 5.50–8.45% were methylated, resulting in significantly lower DNA
                             Dejun Li,
  Rubber Research Institute, Chinese         methylation levels among all regenerated plants than among donor plants. We detected
    Academy of Tropical Agricultural         a significant difference in methylation levels between first regeneration regenerated
                     Sciences, China
                      Yuepeng Song,          plants (G1) and those of the other four generations (G2–G5); there were no significant
    Beijing Forestry University, China       differences among the four later generations. Therefore, the dramatic decrease in
                  *Correspondence:           DNA methylation levels occurred only in the first and second poplar regenerations;
                        Bingyu Zhang
                                             levels then stabilized later in the regeneration process, indicating that two regeneration
                   byzhang@caf.ac.cn
                                             events were sufficient to change the methylation statuses of almost all CCGG sites
                   Specialty section:        sensitive to regeneration. Differences in growth and physiological traits were observed
         This article was submitted to
                       Plant Breeding,
                                             between regenerated plants and donor plants, but were significant only among plants
               a section of the journal      of certain generations. Significant correlations were detected between methylation
            Frontiers in Plant Science       level and transpiration rate, net photosynthetic rate, peroxidase activity, and instant
       Received: 22 November 2020            water utilization efficiency, indicating the involvement of epigenetic regulation in this
           Accepted: 14 June 2021
           Published: 06 July 2021           unpredictable phenotypic variation.
                             Citation:       Keywords: sequential regenerants, MSAP, DNA methylation, epigenetic variation, Populus nigra
           Zhang W, Wang Y, Diao S,
   Zhong S, Wu S, Wang L, Su X and
         Zhang B (2021) Assessment
        of Epigenetic and Phenotypic
                                            INTRODUCTION
            Variation in Populus nigra
          Regenerated via Sequential
                                            In vitro plant cell and tissue culture techniques are the basis of micropropagation and genetic
                         Regeneration.      transformation programs (Miguel and Marum, 2011; Rathore et al., 2012). Phenotypes of plants
         Front. Plant Sci. 12:632088.       clonally propagated through tissue culture sometimes differ from those of the mother plant,
      doi: 10.3389/fpls.2021.632088         especially in plants regenerated from callus in plant species such as rye (de la Puente et al., 2008),

Frontiers in Plant Science | www.frontiersin.org                                    1                                             July 2021 | Volume 12 | Article 632088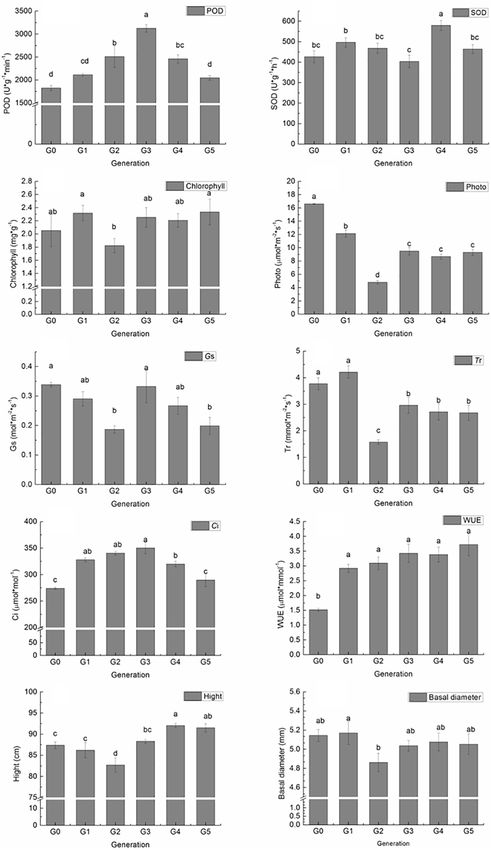
Zhang et al.                                                                                            Epigenetic and Phenotypic Variation in Populus nigra

potato (Bordallo et al., 2004), pea (Kuznetsova et al., 2006), cocoa        of clone “N46” were sterilized with 10% sodium hypochlorite for
(Rodríguez López et al., 2010), and poplars (Saieed et al., 1994;           5 min and cultured on hormone-free Murashige and Skoog (MS)
Rani et al., 1995). Such somaclonal variation is thought to be              medium at 28◦ C and a 16-h photoperiod. We cut and cultured 2-
caused by in vitro-induced stress and the breakdown of normal               cm axillary buds on rooting medium (1/2 MS + 0.01 mg/L indole-
cellular processes (Phillips et al., 1994; Miguel and Marum,                3-butyric acid + 0.01 mg/L naphthaleneacetic acid [NAA]). These
2011). At the molecular level, somaclonal variation has been                plants were designated as donor plants (G0) (Figures 1A–D).
shown to be caused by DNA mutation and epigenetic changes,                  We then cut leaf explants (about 1 cm2 ) from G0 plants and
specifically by changes in genomic DNA methylation (Kaeppler                cultured these first in shoot induction medium (MS + 0.5 mg/L
et al., 2000; Li et al., 2007; Gao et al., 2010; Rodríguez López            6-benzylaminopurine + 0.03 mg/L NAA) in the dark at 28◦ C
et al., 2010). Methylation instability produced via in vitro plant          for 1 day, and then under a 16-h photoperiod at the same
regeneration has been reported in many plant species, including             temperature (Figure 1E). Regenerated shoots (0.5–0.8 cm) were
maize (Kaeppler and Phillips, 1993; Stelpflug et al., 2014), potato         cut and transferred to rooting medium; plants thus obtained were
(Dann and Wilson, 2011), barley (Li et al., 2007; Orłowska et al.,          designated as G1 plants (Figures 1F,G). G1 leaf explants were
2016), cocoa (Rodríguez López et al., 2010), oil palm (Kubis et al.,        cultured as described above, and G2–G5 plants were ultimately
2003), and poplars (Vining et al., 2013). The transfer of DNA               obtained by repeating this process (Figure 1G–K).
methylation changes from regenerated plants to their progenies                 Four plants were randomly selected from each generation
has been observed in maize (Stelpflug et al., 2014) and rice                (G0–G5) and three mature leaves (the 4th to 6th leaves form
(Stroud et al., 2013), indicating that some epigenetic changes are          the top) were collected from each plant. These leaves were
stable and heritable. Therefore, somaclonal variation could be              frozen immediately in liquid nitrogen, stored at −80◦ C, and used
used to select crops with traits that are more advantageous than            for DNA extraction.
those of the mother plant. In contrast, somaclonal variation can
be an obstacle to maintaining genetic fidelity, as required in clonal       DNA Extraction and MSAP Analysis
propagation or transgenic research.                                         Total genomic DNA was isolated from 100 mg of leaves of
    In the past two decades, studies have shown that the                    four biological replicates of each generation using DNeasy
frequency of somaclonal variation can change over time and with             plant mini kit (QIAGEN, Hilden, Germany) according to
repeated subculturing. For example, leaves of late-regenerated              the manufacturer’s instructions. The integrity, purity, and
plant cocoa exhibited significantly less genetic and epigenetic             quality of total DNA were determined using 1.2% agarose
divergence from source leaves than those exposed to short                   gel electrophoresis and a NanoDrop 8000 spectrophotometer
periods of callus growth (Rodríguez López et al., 2010); hops               (Thermo Scientific, Waltham, MA, United States). Only qualified
derived from third-callus subcultures showed higher genetic                 DNA samples (1.8 < A260/280 < 2.0, 2.0 < A260/230 < 2.3) were
distance from in vitro control plants than those from the                   used for further analysis.
first and second subcultures (Peredo et al., 2009). Recently, by               The MSAP analysis was performed as described by Diao et al.
Agrobacterium-mediated genetic transformation of hypocotyls                 (2016). Briefly, 450ng genomic DNA of each sample was digested
and negative plant regeneration at first step, and then negative            with restriction enzyme combinations EcoRI (10U)/HpaII
plant underwent 4 times of sequential plant regeneration, an elite          (5U) and EcoRI (10U)/MspI (5U) (New England Biolabs,
cotton Jin668, with an extremely high regeneration ability was              United States), respectively at 37◦ C for 12 h and deactivated at
developed from an inbred cultivar Y668; and the average cytosine            65◦ C for 20 min. All digested DNA were ligated to the adapters
methylation levels of protein-coding genes, transposon elements             using T4 DNA ligase (New England Biolabs, United States) at
and TE-related genes in CG, CHG and CHH contexts in leaves of               16◦ C for 16 h. The reaction was stopped by incubating the
Jin668 were different from that of the Y668 (Li et al., 2019).              mixture at 65◦ C for 20 min. The ligated DNA product above
    Although phenotypic variation and cytosine DNA                          was used for pre-selective amplification reaction in a Applied
methylation variation in regenerated plants have been reported              Biosystems Veriti Thermal Cycler (ABI, United States). After
                                                                                       R        R

in poplars (Saieed et al., 1994; Vining et al., 2013), to our               checking for the smear of fragments (100–1,000 bp in lengths)
knowledge, DNA methylation changes and their corresponding                  in 2% agarose gel electrophoresis, the qualified pre-amplification
phenotypic variations have not been reported in trees for during            mixture was diluted to 20-fold in deionized water and used
multiple sequential regenerations. The objectives of this study             as templates for the selective amplification. A touchdown PCR
were to (i) use the MSAP method to detect 5-methylcytosine                  program was used in selective amplification reaction in Applied
changes in Populus nigra plants produced via five regenerations,            Biosystems Veriti Thermal Cycler (ABI, United States).
                                                                                       R            R

(ii) assess the occurrence and extent of phenotypic instability             The digestion, ligation and amplification reactions in all the
induced by repeated plant regeneration.                                     DNA samples were carried out simultaneously to reduce the
                                                                            experimental error.
                                                                               The selective amplification DNA products were separated
MATERIALS AND METHODS                                                       by capillary electrophoresis on GeXP Genetic Analysis System
                                                                            (Beckman, American). Fragment analysis module of GeXP
Plant Materials                                                             software was used to analysis the raw data, fragments within 50–
The P. nigra clone “N46” was propagated from stem cuttings and              700 bp range were marked, exported with 1 (presence of bands)
used for in vitro plant production. New semi-ligneous stem nodes            or 0 (absence of bands) for further data analysis.

Frontiers in Plant Science | www.frontiersin.org                        2                                            July 2021 | Volume 12 | Article 632088
Zhang et al. Epigenetic and Phenotypic Variation in Populus nigra
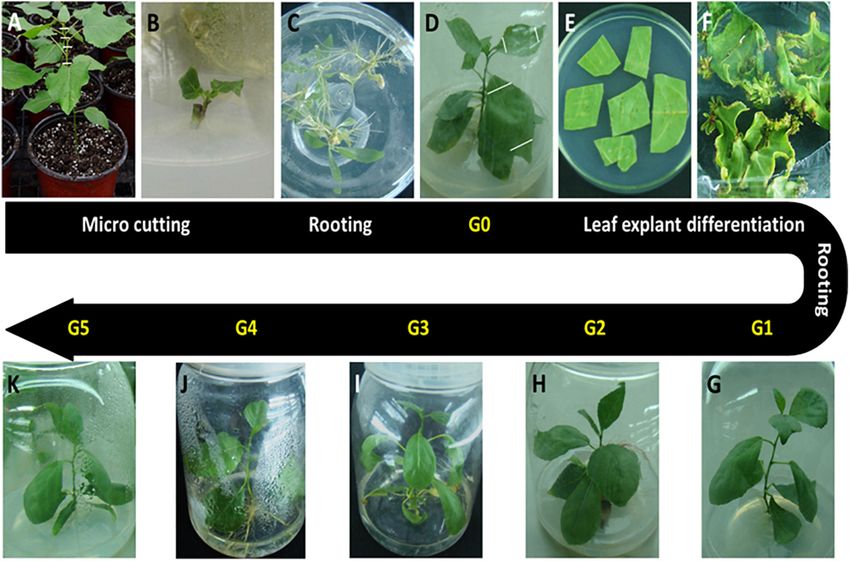
FIGURE 1 | Plant materials used in this study. All in vitro materials were derived from the Populus nigra clone “N46.” (A) Starting material. Stem cuttings (hash
marks) were cut from plants grown in a greenhouse. (B) Stem cuttings were cultured on hormone-free Murashige and Skoog medium for 2–3 weeks until axillary
buds matured. (C) Shoots were cultured on rooting medium for 4 weeks. (D) Plants were grown to 7–8 cm and designated as donor plants (G0). (E) Leaf discs were
cut from G0 plants and cultured on shoot induction medium. (F) Adventitious shoots initiated| from calli formed on leaf cutting edges. (G) Adventitious shoots were
grown to 0.5–0.8 cm, cut, and cultured on rooting medium to produce G1 plants. G1 leaf explants were cultured as described above to obtain G2 (H), G3 (I), G4
(J), and G5 (K) plants by repeating this process.
The amplified DNA fragments were divided into four types: plants) from each generation in a greenhouse in Beijing,
Type I, product amplified by both enzymes combinations. i.e., China (46◦ 44◦ N, 117◦ 10◦ W) in March. Greenhouse conditions
EcoRI/HpaII and EcoRI/MspI, indicating the non-methylated included controlled temperature (24–30◦ C) and natural sunlight;
site. Type II, band appeared only in EcoRI/HpaII but not in three replicates were performed. Plants were rotated every
the EcoRI/MspI, indicating the hemimethylated state of DNA 2 weeks. At the beginning of August, we measured peroxidase
that resulted from methylation in one DNA strand but not (POD) and superoxide dismutase (SOD) activity, chlorophyll
in its complementary strand. Type III, band generated in content, and photosynthetic capacity of mature leaves (third or
EcoRI/MspI but not in the EcoRI/HpaII, represents the case of fourth mature leaves). The height and basal diameter of these
full CG (internal cytosine) methylation. Type IV, no products plants were measured at the end of October.
amplified by any enzyme combination, represents the case of We performed a POD activity assay following the method
full methylation at both cytosines. Percentage of methylation was of Cakmak and Marschner (1992) with minor modifications.
calculated using the following formula (Karan et al., 2012): Fresh leaf samples (200 mg) were homogenized in 3 mL of
ice-cold potassium phosphate buffer (50 mM, pH 6.8) using a
pre-chilled mortar and pestle, and the supernatant was obtained
Total methylation level (%) = [(II + III + IV)/(I + II by centrifugation at 12,000 rpm at 4◦ C for 20 min. The reaction
mixture was prepared by mixing 0.5 mL supernatant, 2.5 mL
+ III + IV)] × 100%; potassium phosphate buffer (50 mM, pH 6.8), 1 mL guaiacol
(50 mM), and 1 mL H2 O2 (0.2%). The optical density was
Fully methylation level (%) = [(III + IV)/(I + II recorded at 470 nm using a microplate reader (SpectraMax
i3x, Molecular Devices, Austria). One unit of POD activity was
+ III + IV)] × 100%; defined as an increase of 0.01 A470 /min.
We performed a SOD activity assay following the method
of Baby and Jini (2011) with minor modifications. Fresh leaf
Hemi − methylation level (%) = [(II) /(I + II + III + IV)] extraction was performed as described above. The reaction
mixture was prepared using 0.3 mL methionine (130 mM),
×100%. 0.3 mL nitro-blue tetrazolium (0.75 mM), 0.3 mL EDTA
(0.1 mM), 1.5 mL potassium phosphate buffer (50 mM, pH 7.8),
Growth and Physiological Parameter 0.3 mL riboflavin (0.02 mM), and 0.1 mL of fresh sample extract.
Measurements The mixture was then incubated under 4,000-lux light at 25◦ C for
We planted six clones (four that were also used for MSAP analysis 40 min. Absorbance was recorded at 560 nm using a microplate
and two randomly selected from among unused regenerated reader (SpectraMax i3x, Molecular Devices, Austria). One unit of
Frontiers in Plant Science | www.frontiersin.org 3 July 2021 | Volume 12 | Article 632088Zhang et al. Epigenetic and Phenotypic Variation in Populus nigra
enzyme was defined as the amount of enzyme corresponding to where C is total chlorophyll content (mg/g); A645 and A663 are
50% SOD inhibition. solution absorbance at 645 and 663 nm, respectively, V is the total
Chlorophyll content was determined according to a modified extract volume; and W is leaf fresh weight.
method outlined by Arnon (1949). Leaf samples (0.2 g) were Photosynthetic rate (Pn), transpiration rate (Tr), stomatal
soaked in 10 mL of 80% acetone solution for 16 h in the dark, conductance (Gs), intercellular CO 2 concentration (Ci), and
shaken, and mixed several times until all leaves turned white. instant water use efficiency (WUE) were measured using a
Solution absorbance was recorded at 663 and 645 nm using a portable infrared gas analyzer (LI-6400; LI-COR, Lincoln, NE,
microplate reader (SpectraMax i3x, Molecular Devices, Austria). United States) at a temperature of 25◦ C and light intensity of
Total chlorophyll content was then calculated as follows: 1,500 µmol/m2 s.
All statistical analyses were performed using
C mg/g = [20.2 (A645 ) + 8.02 (A663 )] × (V/1000 W) . the SPSS v. 17.0 software (SPSS Inc., Chicago, IL,
TABLE 1 | Change in P. nigra N46 DNA methylation levels among regenerated plants of five generations compared with those of donor plants.
MSAP band type G0 G1 G2 G3 G4 G5
I 442 ± 19 488 ± 11 613 ± 15 616 ± 7 646 ± 6 631 ± 13
II 194 ± 16 151 ± 4 98 ± 8 86 ± 8 66 ± 8 85 ± 7
III 213 ± 3 204 ± 2 153 ± 4 166 ± 10 155 ± 9 167 ± 10
IV 90 ± 3 95 ± 8 76 ± 6 71 ± 7 72 ± 3 56 ± 8
Total 939 938 940 939 939 939
T (%)a 52.96 ± 2.05a 48.03 ± 1.26b 34.75 ± 1.60c 34.43 ± 0.71c 31.20 ± 0.65c 32.84 ± 1.37c
F (%)b 32.27 ± 0.28a 31.91 ± 0.81a 24.35 ± 1.07b 25.24 ± 0.54b 24.14 ± 1.23b 23.75 ± 1.89b
H (%)c 20.70 ± 1.81a 16.12 ± 0.46b 10.40 ± 0.87c 9.19 ± 0.85c 7.06 ± 0.87c 9.09 ± 0.73c
a Totalmethylation level (%) = [(II + III + IV)/(I + II + III + IV)] × 100%.b Fullymethylation level (%) = [(III + IV)/(I + II + III + IV)] × 100%. c Hemi-methylation
level
(%) = [(II)/(I + II + III + IV)] × 100%. Type I indicated absence of methylation due to the presence of bands in both EcoRI/HpaII and EcoRI/MspI digest; type II bands
appeared only in EcoRI/HpaII digestion but not in the EcoRI/MspI digest; type III generated bands obtained in EcoRI/MspI digest but not in the EcoRI/HpaII digest; and
type IV represents the absence of band in both enzyme combinations. The different letters after data means significant deferences at P < 0.05.
TABLE 2 | Analysis of DNA methylation patterns in regenerated plants of five generations compared with donor plants.
Description of patten Class Banding patten G1 G2 G3 G4 G5
G0 G1-G5
HpaII MspI HpaII MspI
No Change A 1 0 1 0 122 ± 12 58 ± 1 56 ± 1 47 ± 1 57 ± 8
B 0 1 0 1 178 ± 2 129 ± 3 143 ± 4 129 ± 2 130 ± 5
C 1 1 1 1 400 ± 12 419 ± 20 412 ± 14 425 ± 18 406 ± 19
D 0 0 0 0 58 ± 5 48 ± 4 44 ± 3 44 ± 3 37 ± 3
Total 758 ± 5 655 ± 18 656 ± 15 645 ± 16 630 ± 15
percentage (%) 80.69 ± 0.57 69.76 ± 1.87 69.83 ± 1.61 68.69 ± 1.67 67.09 ± 1.57
Demethylation E 1 0 1 1 59 ± 2 126 ± 13 127 ± 15 133 ± 18 132 ± 14
F 0 1 1 1 24 ± 5 64 ± 9 70 ± 1 81 ± 6 84 ± 5
G 0 0 1 1 0 0 0 0 0
H 0 1 1 0 1±1 15 ± 9 4±2 3±1 6±2
I 0 0 1 0 0 0 0 0 0
J 0 0 0 1 18 ± 2 25 ± 2 24 ± 4 25 ± 3 30 ± 2
Total 102 ± 5 230 ± 15 224 ± 17 242 ± 15 252 ± 19
percentage (%) 10.86 ± 0.56 24.49 ± 1.60 23.89 ± 1.82 25.81 ± 1.58 26.80 ± 2.00
Methylation K 1 1 1 0 25 ± 1 15 ± 2 19 ± 5 9±1 17 ± 3
L 1 1 0 1 15 ± 3 7±3 9±2 8±2 16 ± 9
M 1 1 0 0 3±2 2 3±2 1±1 4±2
N 1 0 0 1 2±1 4±1 5±2 7±3 6±1
O 1 0 0 0 16 ± 5 9±3 13 ± 3 13 ± 2 8±3
P 0 1 0 0 18 ± 4 17 ± 3 10 ± 3 14 ± 1 7±1
Total 79 ± 4 54 ± 6 59 ± 4 52 ± 5 57 ± 13
percentage (%) 8.45 ± 0.40 5.75 ± 0.59 6.28 ± 0.44 5.50 ± 0.58 6.11 ± 1.38
Frontiers in Plant Science | www.frontiersin.org 4 July 2021 | Volume 12 | Article 632088Zhang et al. Epigenetic and Phenotypic Variation in Populus nigra FIGURE 2 | Variation in P. nigra physiological and growth parameters among regenerated plants of five generations compared with those of donor plants. (A) POD activity. (B) SOD activity. (C) Chlorophyll content. (D) Photosynthetic rate. (E) Stomatal conductance. (F) Transpiration rate. (G) Intercellular CO2 concentration. (H) Instant water use efficiency. (I) Height. (J) Basal diameter. Different letters on columns indicate significant differences at P < 0.05. United States). Differences were evaluated using two- physiological parameters and methylation levels were tailed analysis of variance with Duncan’s multiple evaluated using correlation analysis based on Pearson’s range test (P < 0.05). Relationships between correlation coefficient. Frontiers in Plant Science | www.frontiersin.org 5 July 2021 | Volume 12 | Article 632088
Zhang et al.                                                                                                      Epigenetic and Phenotypic Variation in Populus nigra

RESULTS                                                                                (Table 2). Patterns A–D represent monomorphic classes, in
                                                                                       which methylation patterns were the same in G0 plants and
DNA Methylation Levels Decreased                                                       regenerated plants in five subsequent generations. Patterns E–
                                                                                       J indicate cytosine demethylation, and patterns K–P indicate
Dramatically in P. nigra Regenerated
                                                                                       possible cytosine methylation events induced by regeneration
Plants During Multiple Regenerations                                                   processes (Karan et al., 2012).
We used 22 primer combination pairs to determine cytosine                                 We detected similar proportions of CCGG sites in regenerated
methylation statuses at CCGG sites of mature leaves from G0–                           plants among the five generations and in donor plants (67.09–
G5 plants. A total of 938–940 DNA fragments were amplified                             80.69%; Table 2). More demethylated sites were detected in
from DNA extracted from leaves from each generation (Table 1).                         plants of later generations (G2–G5) than in G1, whereas more
Each primer combination produced 20–75 bands (average: 47),                            methylated sites were detected in G1 plants than in later
with the primer combination E3-HM17 producing the most                                 generations. The percentage of sites demethylated during the
bands (n = 75), and E1-HM27 and E2-HM24 producing the                                  regeneration process was much higher than the percentage
fewest (n = 20) (Supplementary Figure 1). Band lengths ranged                          of methylated sites among all regenerated plants among the
from 50 to 700 bp.                                                                     five generations, resulting in an overall demethylation trend
    We calculated the DNA methylation levels of the G0–                                among P. nigra regenerated plants. These results indicate
G5 plants; differences in methylation levels were observed                             that DNA demethylation and methylation events occurred
not only between donor plants (G0 plants) and regenerated                              during the poplar regeneration process, with demethylation
plants, but also among the five generations. The highest total                         generally dominating.
DNA methylation level was observed in G0 plants, followed
by G1; a sharp decrease was observed in G2, followed
by relative stability in G3, G4, and G5 plants. A similar
                                                                                       Phenotypic Variation Among Generations
trend was observed at total and hemi-methylation levels                                and Correlation Between Phenotype and
(Table 1), which were significantly lower in all regenerated                           Methylation Level
plants than in the donor plants. Except for G1 plants, total                           The POD and SOD activity, total chlorophyll, photosynthetic
methylation levels of all regenerated plants were lower than                           parameters, height, and basal diameter of G0 plants and
those of donor plants. Significant differences in methylation                          all regenerated plants among five generations were measured
level were also observed between regenerated plants in all                             to investigate the effect of sequential regeneration on plant
five generations, with those of G1 plants significantly higher                         phenotype (Figure 2). Compared with G0 plants, POD activity
than those of plants in the other four generations; no                                 increased generationally in G1, G2, and G3 plants, followed
significant differences were observed among plants of the later                        by decreases in G4 and G5 plants, finally reaching G0 levels
four generations. Thus, DNA methylation levels of poplar                               (Figure 2A). A significant difference in POD activity was
regenerated plants became stable only after two generations;                           detected between G2, G3, G4, and G0 plants. However, a
the plant regeneration process significantly decreased genomic                         similar trend was not observed in SOD activity, with G3
DNA methylation levels in poplar regenerated plants, especially                        plants having lower and others having higher POD activity
those of the first and second generation, after which this                             than G0 plants; a significant increase in SOD activity was
effect became weaker.                                                                  detected only in G4 plants (Figure 2B). Total chlorophyll
                                                                                       content increased slightly in G1 plants, declined in G2 plants,
Regeneration Processes Induced Both                                                    increased in G3 plants, and then remained stable in G4 and
                                                                                       G5 plants; however, no significant differences were detected
Methylation and Demethylation in                                                       between regenerated plants and donor plants (Figure 2C).
P. nigra Regenerated Plants of Five                                                    Pn and Tr values of all regenerated plants were significantly
Subsequent Generations                                                                 lower than those of donor plants, with the lowest values
Based on MSAP data, all possible banding patterns among                                among G2 plants (Figures 2D,F). Gs decreased significantly
regenerated plants of the five generations were compared                               in G2 and G5 plants (Figure 2E). Ci increased significantly
to those of donor plants to identify changes in cytosine                               in G1 plants, continued to rise in G2 plants, peaked in
methylation patterns during the process of five sequential                             G3 plants, and then decreased in G4 plants; levels became
regenerations. A total of 16 banding patterns were observed                            similar to those of donor plants in G5 (Figure 2G). WUE

TABLE 3 | Correlation coefficients between the DNA methylation levels and phenotypic parameters of P. nigra N46 regenerated plants of five generations.

                                 POD          SOD      Total chlorophyll        Pn         Gs          Ci          Tr        WUE         Height      Basal diameter

Total methylation level (%)     −0.549*      −0.258          0.810†           0.810†      0.427     −0.405      0.664†      −0.756†      −0.292           0.412
Fully methylation level (%)     −0.553*      −0.192          0.766†           0.766†      0.488*    −0.342      0.685†      −0.594†      −0.220           0.525*
Hemi-methylation level (%)      −0.498*      −0.288          0.775†           0.775†      0.340     −0.345      0.589†      −0.821†      −0.342           0.286

*P < 0.05, † P < 0.01.

Frontiers in Plant Science | www.frontiersin.org                                  6                                            July 2021 | Volume 12 | Article 632088
Zhang et al. Epigenetic and Phenotypic Variation in Populus nigra
was significantly higher in all regenerated plants than in donor Somatic variation has long been observed in field and
plants (Figure 2H). in vitro plant propagation (Meyer, 1980), and more often in
Height and basal diameter were measured at the end of the plantlets regenerated from calli, which is a process thought to
growth season. G4 and G5 plants were significantly taller than mainly cause DNA methylation changes (Wang et al., 2012;
donor plants, whereas G2 plants were significantly shorter than Stroud et al., 2013; Duarte-Ake et al., 2016). M. xiaojinensis
donor plants (Figure 2I). Except for G2 plants, which were leaf morphology was observed to vary during tissue culture
significantly lower in basal diameter, there were no significant (Huang et al., 2012); phenotypic variation in oil palm was
differences among plants of different generations (Figure 2J). observed to occur widely and unpredictably following in vitro
Significant positive correlations (P < 0.05) were detected culture (Eeuwens et al., 2002); abnormal flowers, fruits, and
between methylation level and Tr and between methylation level ultimately decreased oil yield were observed in regenerated
and Pn. A significant negative correlation was found between palms (Jaligot et al., 2011). In poplars, variation in growth,
methylation level and POD activity and between methylation leaf phenotype, and gas exchange characteristics of plants
level and WUE (Table 3). regenerated from callus culture have also been reported (Saieed
et al., 1994). In this study, significant phenotypic changes
were observed in P. nigra regenerated plants from certain
DISCUSSION generations: significantly higher plant height were observed in
plants of G4 and G5; significantly lower basal diameter was
Tissue culture conditions, especially the differentiation process only observed in G2 plants; significantly greater WUE and
can cause DNA methylation changes in plants (Gao et al., significantly lower Pn were observed among all regenerated
2010; Stroud et al., 2013). Previous studies showed that plants in all five generations; significantly higher POD and
regenerated plantlets generally had lower methylation levels SOD activity and Ci, and significantly lower Gs, Tr, and basal
than donor plants, and demethylation has been reported in diameter were observed in plants within a few generations. Thus,
regenerated plants of P. trichocarpa (Vining et al., 2013), maize phenotypic variation occurred widely in plantlets sequentially
(Kaeppler and Phillips, 1993; Stelpflug et al., 2014), cocoa regenerated from poplar leaf explants in this study; however,
(Rodríguez López et al., 2010), Malus xiaojinensis (Huang this variation did not generally increase in magnitude as
et al., 2012), rose (Xu et al., 2004), and oil palm (Kubis regeneration time increased. We detected significant correlations
et al., 2003) etc. These results are consistent with those of between DNA methylation level and some of the examined
the present study; we determined that the regeneration process phenotypes (POD activity, Pn, WUE, and Tr), indicating
decreased DNA methylation in P. nigra regenerants. We also that this wide and unpredictable phenotypic variation was
found evidence that DNA demethylation and methylation associated with changes in DNA methylation among poplar
had occurred in CCGG sites of P. nigra regenerated plants regenerated plants.
during the regeneration process, and that more frequent Apart from the CCGG sites, substantial methylation occurs
demethylation resulted in decreased methylation levels among in plant genomes at the CHG and CHH sites; for example,
regenerated plants. methylation levels at CG, CHG, and CHH of approximately
Demethylation in rice regenerated plants has been suggested 24.0, 6.7, and 1.7%, respectively, have been reported for
to be stochastically induced at the tissue culture step (Stroud Arabidopsis (Cokus et al., 2008); and levels of 41.9, 20.9,
et al., 2013), such that variation in the methylation rate in and 3.25%, respectively, have been reported for P. trichocarpa
plantlets increases with tissue culture time. For example, (Feng et al., 2010). In the present study, we used the MSAP
higher methylation variation rates have been observed in method to detect DNA methylation changes in the genome
secondary Clivia miniata plantlets than in primary plantlets of plantlets regenerated five times from leaf explants from
(Wang et al., 2012). Third-callus hop subcultures exhibited P. nigra “N46.” Limited by this method, we detected only
higher epigenetic distance from controls than plants from changes in the CCGG motif, which represents a subset of
first- and second-callus subcultures (Peredo et al., 2006). In cytosine methylation. Genetic changes (e.g., single-nucleotide
the regenerated plants of our study, the total methylation polymorphisms or indels) and other epigenetic changes (e.g.,
level of G1 plants was significantly lower than that of donor histone tail modification or siRNA-based gene silencing) may
plants, and that of G2 plants was significantly lower than that have happened within the genomes of these poplar regenerated
of G1 plants; no significant differences were observed among plants too. The sequential regeneration process induced the wide
G2–G5 plants. Thus, methylation status generally decreased in phenotypic variations in poplar regenerated plants and these
first-generation regenerated plants and continued to decrease variations observed may have caused at least partially by the DNA
dramatically as regeneration time increased in poplar. However, methylation changes.
methylation levels of plants in later generations (G3–G5)
did not always decrease as expected, instead becoming stable
after the second regeneration. Therefore, some sites in the DATA AVAILABILITY STATEMENT
plant genome may be more sensitive to the regeneration
process, changing their methylation status during the first The original contributions presented in the study are included
few generations, and then becoming stable throughout in the article/Supplementary Material, further inquiries can be
subsequent generations. directed to the corresponding author/s.
Frontiers in Plant Science | www.frontiersin.org 7 July 2021 | Volume 12 | Article 632088Zhang et al. Epigenetic and Phenotypic Variation in Populus nigra
AUTHOR CONTRIBUTIONS ACKNOWLEDGMENTS
WZ drafted the original manuscript. WZ and YW performed We would like to thank funders for funding this research and the
the experiments and analyzed the data. BZ, XS, SD, SZ, SW, State Key Laboratory of Tree Genetics and Breeding, Research
and LW were involved in devising and directing the experiments Institute of Forestry, Chinese Academy of Forestry for the
and proofreading the manuscript. BZ contributed to the funding instrument support.
acquisition and edited the final manuscript. All authors reviewed
the manuscript and agreed to the publication of this manuscript.
SUPPLEMENTARY MATERIAL
FUNDING
The Supplementary Material for this article can be found
The financial support of this study was from the Basic Research online at: https://www.frontiersin.org/articles/10.3389/fpls.2021.
Fund of RIF (Grant No. CAFYBB2020SZ002) and the National 632088/full#supplementary-material
Natural Science Foundation of China (Grant Nos. 31700589
and 31770710). Supplementary Figure 1 | Electrophoretogram of MSAP.
REFERENCES xiaojinensis. Plant Cell Tiss. Org. Cult. 111, 153–161. doi: 10.1007/s11240-012-
0179-9
Arnon, D. I. (1949). Copper enzymes in isolated chloroplasts. Polyphenoloxidase Jaligot, E., Adler, S., Debladis, É, Beulé, T., Richaud, F., Ilbert, P., et al. (2011).
in beta vulgaris. Plant Physiol. 24, 1–15. doi: 10.1104/pp.24.1.1 Epigenetic imbalance and the floral developmental abnormality of the in vitro-
Baby, J., and Jini, D. (2011). Development of salt stress-tolerant plants by gene regenerated oil palm Elaeis guineensis. Ann. Bot. 108, 1453–1462. doi: 10.1093/
manipulation of antioxidant enzymes. Asian J. Agric. Res. 5, 17–27. doi: 10.3923/ aob/mcq266
ajar.2011.17.27 Kaeppler, S. M., Kaeppler, H. F., and Yong, R. (2000). Epigenetic aspects of
Bordallo, P. N., Silva, D. H., Maria, J., Cruz, C. D., and Fontes, E. P. (2004). somaclonal variation in plants. Plant Mol. Biol. 43, 179–188. doi: 10.1023/A:
Somaclonal variation on in vitro callus culture potato cultivars. Hortic. Bras. 1006423110134
22, 1–6. doi: 10.1590/S0102-05362004000200027 Kaeppler, S. M., and Phillips, R. L. (1993). Tissue culture-induced DNA
Cakmak, I., and Marschner, H. (1992). Magnesium deficiency and high light methylation variation in maize. Proc. Natl. Acad. Sci. U. S. A. 90, 8773–8776.
intensity enhance activities of superoxide dismutase, ascorbate peroxidase, and doi: 10.1073/pnas.90.19.8773
glutathione reductase in bean leaves. Plant Physiol. 98, 1222–1227. doi: 10.2307/ Karan, R., DeLeon, T., Biradar, H., and Subudhi, P. K. (2012). Salt stress induced
4274236 variation in DNA methylation pattern and its influence on gene expression
Cokus, S. J., Feng, S., Zhang, X., Chen, Z., Merriman, B., Haudenschild, C. D., et al. in contrasting rice genotypes. PLoS One 7:e40203. doi: 10.1371/journal.pone.
(2008). Shotgun bisulphite sequencing of the Arabidopsis genome reveals DNA 0040203
methylation patterning. Nature 452, 215–219. doi: 10.1038/nature06745 Kubis, S. E., Castilho, A. M. M. F., Vershinin, A. V., and Heslop-Harrison, J. S. P.
Dann, A. L., and Wilson, C. R. (2011). Comparative assessment of genetic and (2003). Retroelements, transposons and methylation status in the genome of
epigenetic variation among regenerants of potato (Solanum tuberosum) derived oil palm (Elaeis guineensis) and the relationship to somaclonal variation. Plant
from long-term nodal tissue-culture and cell selection. Plant Cell Rep. 30, Mol. Biol. 52, 69–79. doi: 10.1023/A:1023942309092
631–639. doi: 10.1007/s00299-010-0983-9 Kuznetsova, O. I., Ash, O. A., and Gostimsky, S. A. (2006). The effect of the
de la Puente, R., González, A. I., Ruiz, M. L., and Polanco, C. (2008). Somaclonal duration of callus culture on the accumulation of genetic alterations in pea
variation in rye (Secale cereale L.) analysed using polymorphic and sequenced Pisum sativum L. Russ. J. Genet. 42, 555–562. doi: 10.1134/s1022795406050139
AFLP markers. In Vitro Cell Dev. Biol. Plant 44, 419–426. Li, J., Wang, M., Li, Y., Zhang, Q., Lindsey, K., Daniell, H., et al. (2019). Multi-omics
Diao, S., Wang, Y., Ding, C., Chang, Y., Liang, L., Gao, Y., et al. (2016). No analyses reveal epigenomics basis for cotton somatic embryogenesis through
consistent daily variation in DNA methylation detected in Populus nigra leaves successive regeneration acclimation process. Plant Biotechnol. J. 17, 435–450.
by methylation-sensitive amplification polymorphism analysis. J. For. Res. 28, doi: 10.1111/pbi.12988
653–660. doi: 10.1007/s11676-016-0357-4 Li, X., Yu, X., Wang, N., Feng, Q., Dong, Z., Liu, L., et al. (2007). Genetic and
Duarte-Ake, F., Castillo-Castro, E., Pool, F. B., Espadas, F., Santamaria, J. M., epigenetic instabilities induced by tissue culture in wild barley (Hordeum
Robert, M. L., et al. (2016). Physiological differences and changes in global brevisubulatum (Trin.) Link). Plant Cell Tiss. Org. Cult. 90, 153–168. doi: 10.
DNA methylation levels in Agave angustifolia Haw. albino variant somaclones 1007/s11240-007-9224-5
during the micropropagation process. Plant Cell Rep. 35, 2489–2502. doi: 10. Meyer, M. M. Jr. (1980). In vitro propagation of Hosta sieboldiana. Hortscience 29,
1007/s00299-016-2049-0 819–820. doi: 10.1007/BF00023230
Eeuwens, C. J., Lord, S., Donough, C. R., Rao, V., Vallejo, G., and Nelson, S. Miguel, C., and Marum, L. (2011). An epigenetic view of plant cells cultured
(2002). Effects of tissue culture conditions during embryoid multiplication on in vitro: somaclonal variation and beyond. J. Exp. Bot. 62, 3713–3725. doi:
the incidence of “mantled” flowering in clonally propagated oil palm. Plant Cell 10.1093/jxb/err155
Tiss. Org. Cult. 70, 311–323. doi: 10.1023/A:1016543921508 Orłowska, R., Machczyńska, J., Oleszczuk, S., Zimny, J., and Bednarek, P. T. (2016).
Feng, S., Cokus, S. J., Zhang, X., Chen, P. Y., Bostick, M., Goll, M. G., et al. (2010). DNA methylation changes and TE activity induced in tissue cultures of barley
Conservation and divergence of methylation patterning in plants and animals. (Hordeum vulgare L.). J. Biol. Res. 23:19. doi: 10.1186/s40709-016-0056-5
Proc. Natl. Acad. Sci. U. S. A. 107, 8689–8694. doi: 10.1073/pnas.1002720107 Peredo, E. L., Arroyo-Garcia, R., and Revilla, M. A. (2009). Epigenetic changes
Gao, X., Yang, D., Cao, D., Ao, M., Sui, X., Wang, Q., et al. (2010). In vitro detected in micropropagated hop plants. J. Plant Physiol. 166, 1101–1111. doi:
micropropagation of freesia hybrida and the assessment of genetic and 10.1016/j.jplph.2008.12.015
epigenetic stability in regenerated plantlets. J. Plant Growth Regul. 29, 257–267. Peredo, E. L., Revilla, M. Á, and Rosa, A. G. (2006). Assessment of genetic and
doi: 10.1007/s00344-009-9133-4 epigenetic variation in hop plants regenerated from sequential subcultures of
Huang, H., Han, S. S., Wang, Y., Zhang, X. Z., and Han, Z. H. (2012). Variations organogenic calli. J. Plant Physiol. 163, 1071–1079. doi: 10.1016/j.jplph.2005.09.
in leaf morphology and DNA methylation following in vitro culture of Malus 010
Frontiers in Plant Science | www.frontiersin.org 8 July 2021 | Volume 12 | Article 632088Zhang et al. Epigenetic and Phenotypic Variation in Populus nigra Phillips, R. L., Kaeppler, S. M., and Olhoft, P. (1994). Genetic instability of plant Vining, K., Pomraning, K., Wilhelm, L., Ma, C., Pellegrini, M., Di, Y., et al. (2013). tissue cultures: breakdown of normal controls. Proc. Natl. Acad. Sci. U. S. A. 91, Methylome reorganization during in vitro dedifferentiation and regeneration 5222–5226. doi: 10.1073/pnas.91.12.5222 of Populus trichocarpa. BMC Plant Biol. 13:92. doi: 10.1186/1471-2229- Rani, V., Parida, A., and Raina, S. N. (1995). Random amplified polymorphic DNA 13-92 (RAPD) markers for genetic analysis in micropropagated plants of Populus Wang, Q. M., Wang, Y. Z., Sun, L. L., Gao, F. Z., Sun, W., He, J., deltoides Marsh. Plant Cell Rep. 14, 459–462. doi: 10.1007/BF00234055 et al. (2012). Direct and indirect organogenesis of Clivia miniata Rathore, M. S., Shekhawat, S., Kaur, G., Singh, R. P., and Shekhawat, N. S. (2012). and assessment of DNA methylation changes in various regenerated Micropropagation of vegetable rennet (Withania coagulans [Stocks] Dunal)—a plantlets. Plant Cell Rep. 31, 1283–1296. doi: 10.1007/s00299-012-12 critically endangered medicinal plant. J. Sustain. For. 31, 727–746. doi: 10.1080/ 48-6 10549811.2012.706533 Xu, M., Li, X., and Korban, S. (2004). DNA-methylation alterations and exchanges Rodríguez López, C. M., Wetten, A. C., and Wilkinson, M. J. (2010). Progressive during in vitro cellular differentiation in rose (Rosa hybrida L.). Theor. Appl. erosion of genetic and epigenetic variation in callus-derived cocoa (Theobroma Genet. 109, 899–910. cacao) plants. New Phytol. 186, 856–868. doi: 10.1111/j.1469-8137.2010.03 242.x Conflict of Interest: The authors declare that the research was conducted in the Saieed, N. T., Douglas, G. C., and Fry, D. J. (1994). Induction and stability of absence of any commercial or financial relationships that could be construed as a somaclonal variation in growth, leaf phenotype and gas exchange characteristics potential conflict of interest. of poplar regenerated from callus culture. Tree Physiol. 14, 1–16. doi: 10.1093/ treephys/14.1.1 Copyright © 2021 Zhang, Wang, Diao, Zhong, Wu, Wang, Su and Zhang. Stelpflug, S. C., Eichten, S. R., Hermanson, P. J., Springer, N. M., and Kaeppler, S. M. This is an open-access article distributed under the terms of the Creative (2014). Consistent and heritable alterations of DNA methylation are induced Commons Attribution License (CC BY). The use, distribution or reproduction by tissue culture in maize. Genetics 198, 209–218. doi: 10.1534/genetics.114. in other forums is permitted, provided the original author(s) and the 165480 copyright owner(s) are credited and that the original publication in this Stroud, H., Ding, B., Simon, S. A., Feng, S., Bellizzi, M., Pellegrini, M., et al. (2013). journal is cited, in accordance with accepted academic practice. No use, Plants regenerated from tissue culture contain stable epigenome changes in rice. distribution or reproduction is permitted which does not comply with Elife 2:e00354. doi: 10.7554/eLife.00354 these terms. Frontiers in Plant Science | www.frontiersin.org 9 July 2021 | Volume 12 | Article 632088
You can also read