3D Point Cloud Based Spatio-Temporal Monitoring of Natural Objects
←
→
Page content transcription
If your browser does not render page correctly, please read the page content below
3D Point Cloud Based Spatio-Temporal Monitoring of Natural Objects

 Jens-André PAFFENHOLZ, Germany, Bastian STEINHOFF-KNOPP, Germany and
 Corinna HARMENING, Austria

 Key words: B-splines, Deformation measurement; Engineering survey; Laser scanning; Soil
 erosion

 SUMMARY

 This paper deals with the research field of 3D point cloud based spatio-temporal monitoring
 focussed on natural objects. The 3D point clouds discussed here are predominantly acquired by
 means of laser scanners. The main characteristic of terrestrial laser scanners is their surface-
 based data acquisition, resulting in a 3D point cloud with typically millions of three-
 dimensional individual points along with at least intensity information and optional color
 information. This data allows for solving classical questions of monitoring and also to address
 new questions and monitoring applications, especially in the domain of natural, unstructured
 objects of different scales. Next to a literature review, starting from the challenges and new
 chances by the 3D point cloud based monitoring and showing exemplarily applications, we
 briefly introduce methods to approximate 3D point clouds with the aim to analyse soil erosion
 scenes. Afterwards, we highlight some results of self-conducted laboratory experiments to
 investigate soil erosion scenes with the focus on the quantification of soil erosion volumes.
 Therefore, we apply a GIS-based semi-automated identification of the soil erosion feature and
 its volume calculation. The aim of the approach presented here is to investigate the application
 of B-splines for the approximation of soil surfaces, and to identify methods and indicators with
 the potential to contribute to the process of fully automated volume determination of erosion
 features. Our results for the volume determination are compared with classical methods and
 show a promising correspondence.

3D Point Cloud Based Spatio-Temporal Monitoring of Natural Objects (11119)
Jens-André Paffenholz, Bastian Steinhoff-Knopp (Germany) and Corinna Harmening (Austria)
FIG e-Working Week 2021
Smart Surveyors for Land and Water Management - Challenges in a New Reality
Virtually in the Netherlands, 21–25 June 2021

3D Point Cloud Based Spatio-Temporal Monitoring of Natural Objects

 Jens-André PAFFENHOLZ, Germany, Bastian STEINHOFF-KNOPP, Germany and
 Corinna HARMENING, Austria

 1. MOTIVATION
 This paper shows some new results of selected activities of the IAG working group (WG) 4.1.3
 in collaboration with the FIG Commission 6 in the field of 3D point cloud based spatio-temporal
 monitoring. The focus of the IAG WG is on spatio-temporal monitoring of artificial and natural
 objects with the aid of 3D point clouds. Without loss of generality terrestrial laser scanners
 (TLS) are used to acquire 3D point clouds. The main characteristic of TLS is its surface-based
 data acquisition, resulting in a 3D point cloud with typically millions of three-dimensional
 individual points along with at least intensity information and optional color information. In
 addition to a high spatial resolution, a high temporal resolution with up to 1 million points per
 second is possible. TLS has proven to be a suitable technique for spatio-temporal monitoring
 of artificial structures like bridges, see e.g. Holst and Neuner (2021), Paffenholz and Wujanz
 (2019), Schill and Eichhorn, (2019) as well as of natural objects, see e. g. Butt et al. (2019),
 Holst et al. (2021), Harmening and Paffenholz (2021). Aforementioned authors show that the
 determination of object changes with high accuracy in the low millimeter level is feasible, see
 e. g., Wunderlich et al. (2016) for an overview. However, the use of TLS in the scope of
 geodetic monitoring tasks as an alternative to the classical point-wise deformation analysis is a
 highly topical research field, with several aspects currently being under investigation. These
 include for instance the establishment of an appropriate variance covariance matrix and the
 applied error model, e. g., Kermarrec et al. (2020) and Kerekes and Schwieger (2020), the
 deformation analysis itself, e. g. Harmening and Neuner (2020) and Mukupa et al. (2016), as
 well as the calibration of the sensors, e. g., Medić et al., (2020), to only mention a few aspects.
 Further challenges with respect to a laser scanning based deformation analysis arise due to the
 resulting high point density (Holst and Kuhlmann, 2016).
 In engineering geodetic applications, the focus is usually on the monitoring of artificial objects,
 the laser scanner-based deformation analysis of which is already successfully conducted.
 However, laser scanning has also great potential with respect to the monitoring of natural
 objects and phenomena. Usually, further than the above mentioned challenges arise in natural
 environments. Using the volume determination of soil erosion scenes as an example,
 possibilities and difficulties of the laser scanner-based deformation analysis of natural objects
 are highlighted in this contribution.
 The outline of the paper is as follows: Section 2 gives a comprehensive overview of the several
 contributions in literature in the scope of monitoring with the aid of 3D point clouds acquired
 by TLS sensors. Section 3 introduces our developed and applied methods. In Section 4, we
 utilize our proposed method to determine the volume of three erosion features. Finally,
 Section 5 concludes the paper and provides a perspective to future work.

3D Point Cloud Based Spatio-Temporal Monitoring of Natural Objects (11119)
Jens-André Paffenholz, Bastian Steinhoff-Knopp (Germany) and Corinna Harmening (Austria)
FIG e-Working Week 2021
Smart Surveyors for Land and Water Management - Challenges in a New Reality
Virtually in the Netherlands, 21–25 June 2021
2. STATE OF THE ART
 In the scope of 3D point cloud based spatio-temporal monitoring a central question to answer
 first is: How should 3D point clouds of different epochs be compared? For instance, Mukupa et
 al. (2016) are addressing this question by giving three options. (1) Direct comparison of the
 original 3D point clouds of different epochs, i.e. point-to-point based comparison. (2) Compare
 an original 3D point cloud against a reference surface, i.e. point-to-surface comparison. The
 reference surface is obtained by modeling an original 3D point cloud, e. g., by a suitable surface
 approximation. (3) Make use of only models of 3D point clouds to obtain geometric object
 changes based on, i.e. surface-to-surface comparison. One of the major challenges is then the
 suitable modeling of the 3D point clouds (cf. Neuner et al. (2016) for a detailed overview of
 modeling strategies), as the objects under investigation typically vary in dimension and shape.
 In order to judge and to meaningful interpret changes and differences arising from the
 comparison of either two point clouds or two models of point clouds, the uncertainty budget of
 the sensor as well as the (geo-) referencing procedure and its uncertainty has to be taken into
 account. When analysing the uncertainty budget of the sensors, the focus is often on the range
 uncertainty (cf. e. g. Wujanz et al. (2017) and Winiwarter et al. (2020)). Alternatively, Kerekes
 and Schwieger (2020) apply the elementary error model to establish a variance covariance
 matrix, considering both range and angular uncertainties. Another approach to handle the
 sensor’s uncertainties is the calibration of the laser scanner. Medić et al. (2020) report about the
 design and evaluation of a user-oriented calibration field for a target-based self-calibration of
 laser scanners. The (geo-) referencing procedure, which can be performed directly using
 additional sensors like GNSS equipment or indirectly using classical artificial targets, is
 discussed, e. g., in Osada et al. (2017), Paffenholz (2012) as well as Uggla and Horemuz (2021).
 In the following, spatio-temporal monitoring based on 3D point clouds is reviewed for selected
 applications mainly coming from the infrastructure-building sector, and, hence, with the focus
 lying on artificial objects under investigation.
 Liebig et al., (2011) discuss a combined application for structural measurements and 3D point
 clouds acquired by means of TLS sensors with the aim to calibrate a numerical model for a
 highway bridge under different traffic conditions. In particular, 3D point clouds for a static load
 scenario as well as 2D profiles in driving direction under various speed scenarios are acquired.
 The authors report about the ability to validate their numerical model, here a finite element
 model (FEM), by means of the 2D profiles acquired by means of the TLS.
 Schill and Eichhorn (2019) use 2D profiles obtained by a TLS in order to monitor railway
 bridges. For two selected railway bridges, the authors demonstrate the benefits of TLS, being a
 non-contact measurement technique with a high spatial and high temporal resolution. This
 allows for the efficient capturing of temporally variable structural deformations, resulting in a
 considerably higher spatial resolution of the deformation information than it is provided by
 tactile sensors that are typically used for the deformation monitoring of bridge structures.
 Truong-Hong and Lindenbergh (2019) deal with laser scanning-based monitoring of bridge
 structures, the deformations of which are due to increasing traffic load and aging structures.
 The authors introduce three approaches called point-to-surface (P2S), point-to-cell (P2C) and
 cell-to-cell (C2C) to describe the deformation of a structure by means of 3D point clouds.
 Furthermore, investigations about the impact of the selected reference surface or cell size on

3D Point Cloud Based Spatio-Temporal Monitoring of Natural Objects (11119)
Jens-André Paffenholz, Bastian Steinhoff-Knopp (Germany) and Corinna Harmening (Austria)
FIG e-Working Week 2021
Smart Surveyors for Land and Water Management - Challenges in a New Reality
Virtually in the Netherlands, 21–25 June 2021
the achieved accuracy of the deformation analysis are shown. As an example the authors present
 the task to measure the bridge’s vertical clearance.
 Eling (2009) reports about the structural monitoring of dams using a TLS sensor. The author
 splits his methodology into three parts (1) the deformation measurement and definition of a
 geodetic datum, (2) the 3D point cloud geo-referencing and (3) the analysis of the 3D point
 cloud using a voxel model and local filtering. The advantage is seen in a detailed spatial
 resolution of the structure, here a dam in Lower Saxony, Germany, and in the automation of the
 analysis.
 Holst et al. (2015) introduce an approach for the area-based deformation analysis of a radio
 telescope’s main reflector using a TLS. The authors emphasize the need for an appropriate
 measurement concept and for pre-processing steps, e. g., data reduction, object segmentation
 and sensor calibration, when making use of TLS in applications for deformation analysis.
 Gojcic et al. (2019) focus on the challenge to define point correspondences typically used in
 classical deformation analysis. The authors propose an algorithm establishing point-wise
 correspondences in the feature space utilizing a neural network based approach, which is also
 able to handle outliers. Their proposed algorithm outperforms traditional approaches in terms
 of obtaining true 3D displacement vectors.
 The approximation process of 3D point clouds describing a complex freeform shell by means
 of B-spline surfaces is the topic of Schmitt et al. (2019). The authors point out the benefits of
 using 3D point clouds and their geometric approximation in the scope of the object’s shape
 verification and its structural analysis. Furthermore, the interfacing between B-spline surfaces
 and FEM analysis is addressed.
 The applications summarized above exclusively deal with the monitoring of artificial objects.
 However, laser scanning also offers great potential for monitoring natural objects and
 phenomena. Additional challenges usually arise in this case, which are closely related to the
 properties of the natural objects under investigation.
 A typical example of the monitoring of natural objects in which laser scanning is increasingly
 used is phenotyping. Due to the advantages (automatic, contact-free and fast data acquisition)
 of laser scanners over sensors classically used in crop sciences, the use of laser scanning allows
 for the high throughput phenotyping that is required in plant sciences for achieving meaningful
 results. Hence, a number of approaches dealing with laser scanner-based phenotyping exist in
 literature (see e. g. Harmening and Paffenholz (2021), Jiang et al. (2019), Paulus (2019),
 Ziamtsov and Navlakha (2020)). Compared to the above described examples of the monitoring
 of artificial objects, in these applications great emphasis is usually placed on the development
 of appropriate segmentation strategies that automatically identify the plant organs of interest.
 Furthermore, the subsequent modelling of the segmented plant organs plays a prominent role,
 as simple geometric primitives, that are most often used to model artificial objects, are not
 appropriate.
 As another example for the laser scanner-based monitoring of natural objects, which is also
 dealt with in this contribution, the monitoring of soil erosion scenes must be emphasized. In
 these applications, the determination of the soil erosion’s volume is of superior importance.
 Usually this volume determination is not performed on the original 3D point clouds but on
 models of the 3D point clouds.

3D Point Cloud Based Spatio-Temporal Monitoring of Natural Objects (11119)
Jens-André Paffenholz, Bastian Steinhoff-Knopp (Germany) and Corinna Harmening (Austria)
FIG e-Working Week 2021
Smart Surveyors for Land and Water Management - Challenges in a New Reality
Virtually in the Netherlands, 21–25 June 2021
The basic and most common approach for the volume calculation of soil erosion features (rills,
 gullies, ephemeral gullies) is to calculate the difference of digital surface models (DSM) of two
 epochs (pre- and post-erosion). Applying this approach, e. g. Eltner et al. (2013, 2015) use
 multi-temporal UAV and TLS data to detect changes in the soil surface and estimate erosion
 loss.
 Without information on the pre-erosion state, methods for reconstructing the original terrain
 surface are needed. This includes finding the ridge edge of erosion features. Addressing the
 development of an erosion gully in Spain, Marzloff and Poessen (2009) digitise the gully edgy
 and calculate the volume change within the gully for three epochs, without calculating the
 volume of the whole gully. Implementing a similar approach, d'Oleire-Oltmanns et al. (2012)
 as well as Peter et al. (2014) monitor the volume of a gully by the means of UAV-derived
 DSMs. They use digitised 3D-lines of the gully edge to reconstruct the minimum terrain surface
 before the erosion occurred and calculate the difference between the surfaces to estimate the
 gully volume. Steinhoff-Knopp et al. (2019) use a comparable method to estimate the volume
 of small rills in a laboratory setting. Di Stefano et al. (2017) use structure for motion (SfM)
 techniques to generate a DSM of rills and extract cross sections to calculate the volume between
 the cross sections. Báčová et al. (2018) present an algorithm to determine the volume of erosion
 rills or gullies from DSMs and its implementation in the GIS software ArcGIS. By comparing
 their method within controlled conditions against results from the comparison of pre- and post-
 erosion surfaces (difference of surfaces), the authors estimate that their method underestimates
 the erosion volume by 10 – 15 %. Furthermore, the authors highlight the importance of
 identifying the ridge edge of the soil erosion feature to get valid results.

 Our approach to determine the volume of soil erosion features is based on an adaption and
 refinement of the methods developed and applied by d'Oleire-Oltmanns et al. (2012), Báčová
 et al. (2018) and Steinhoff-Knopp et al. (2019). Hence, we start with a sophisticated pre-
 processing of the 3D point cloud by means of a B-spline approximation. Subsequently, we apply
 a GIS-based semi-automated identification of the soil erosion feature and its volume
 calculation. The aim of the approach presented here is to test the application of B-splines for
 the approximation of soil surfaces, and to identify methods and indicators with the potential to
 contribute to the process of fully automated volume determination of erosion features.

 3. METHODS
 B-spline surfaces
 Free-form curves and surfaces have been used as part of a standard approximation method for
 3D point clouds in many engineering disciplines in the past decade. Examples for geodetic
 applications can be found in Koch (2009), Harmening and Neuner (2015), Bureick et al. (2016),
 Paffenholz and Wujanz (2019) as well as Schmitt et al. (2019) who approximate captured 3D
 point clouds representing artificial objects by means of B-splines and non-uniform rational B-
 splines (NURBS). In addition, Harmening and Paffenholz (2021) use B-splines for the
 approximation of natural objects like plant leaves with the aim of leaf area determinations in
 phenotyping context. In this contribution, B-spline surfaces are used to approximate point
 clouds representing soil erosion features.
 A B-spline surface of degree and is defined by:

3D Point Cloud Based Spatio-Temporal Monitoring of Natural Objects (11119)
Jens-André Paffenholz, Bastian Steinhoff-Knopp (Germany) and Corinna Harmening (Austria)
FIG e-Working Week 2021
Smart Surveyors for Land and Water Management - Challenges in a New Reality
Virtually in the Netherlands, 21–25 June 2021
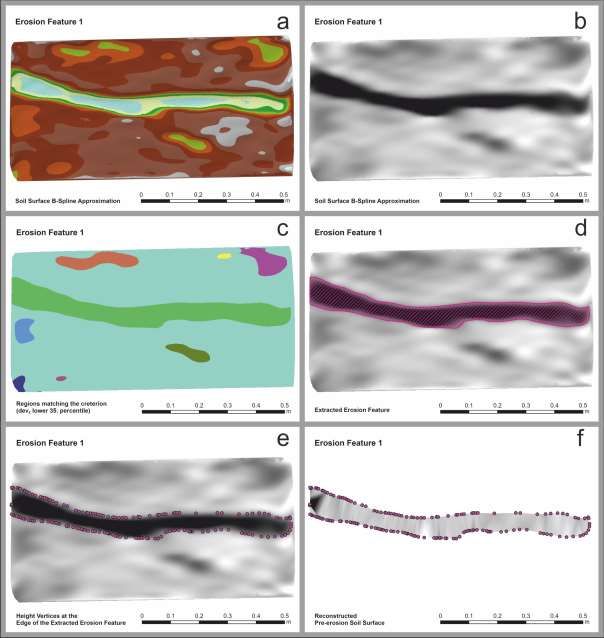
 ̂( , ) = ∑ ∑ , ( ) ⋅ , ( ) ⋅
 =0 =0
 According to the previous equation, a surface point ̂( , ) is computed as the weighted average
 of the ( + 1) × ( + 1) control points (Piegl and Tiller, 1997, p. 100). The
 corresponding weights are defined by the functional values of the B-spline basis functions
 , ( ) and , ( ), which can be recursively computed (Cox, 1972; Boor, 1972). Two knot
 vectors, one in direction of the surface parameter ( = [ 0 , … , ]) and one in direction of
 the surface parameter ( = [ 0 , … , ]), split the B-spline's domain into knot spans.
 Usually, only the location of the control points is estimated in a linear Gauß-Markov model
 when estimating a best-fitting B-spline surface. The choice of the optimal number of control
 points ( + 1) and ( + 1) to be estimated is a model selection problem and can be solved
 by classical model selection criteria or by structural risk minimisation (Harmening and Neuner,
 2016; Harmening and Neuner, 2017). In order to obtain a linear relationship between the
 observations and the unknown control points , the B-spline's knots as well as its degrees are
 usually specified a priori. The use of cubic B-splines with = = 3 is a commonly accepted
 choice. The determination of the knots (known as knot adjustment problem) considerably
 affects the estimation of the B-spline surface. Therefore, in Bureick et al. (2016) and Bureick
 et al. (2019) different approaches based on Monte Carlo techniques and genetic algorithms are
 developed with regard to B-spline curves. Both approaches show an optimal selection of knots
 for curve approximation. Finally, convenient surface parameters and , locating the
 observations on the surface to be estimated, have to be a-priori allocated to the observations
 (Harmening and Neuner, 2016).
 Hence, the workflow for the B-spline approximation of a 3D point cloud can be briefly
 summarized as follows: (1) pre-processing of the 3D point cloud, (2) model selection and
 parametrization, (3) knot vector adjustment and (4) estimation of the B-spline surface in a linear
 Gauß-Markov model.

 GIS-based analysis of 3D point clouds with the aim of volume determination
 To calculate the volume of soil erosion features utilizing 3D point clouds without knowledge
 of the pre-erosion surface, the following workflow is implemented by adapting approaches
 proposed by d'Oleire-Oltmanns et al. (2012), Báčová et al. (2018) and Steinhoff-Knopp et al.
 (2019). Our workflow is split in three parts, see Figure 1 for an exemplary visualization of
 relevant steps in the workflow. Namely the three parts are: A. the pre-processing of the original
 3D point clouds, B. the semi-automated identification of the soil erosion feature and C. the
 volume calculation of the soil erosion feature. The parts B and C of the method are implemented
 in the software ArcGIS Pro 2.7.1 (ESRI 2020).

 Part A. Pre-Processing: Use of an initial B-spline approximation of the acquired point clouds
 for the whole area of investigation. This leads to a smoothing effect of the noisy, original 3D
 point cloud (Figure 1 a). Also, it is an efficient way to systematically reduce the number of
 points, i.e., the point density, with respect to computational time in the analysis and moreover
 to apply the approach on large scale, real world data.

3D Point Cloud Based Spatio-Temporal Monitoring of Natural Objects (11119)
Jens-André Paffenholz, Bastian Steinhoff-Knopp (Germany) and Corinna Harmening (Austria)
FIG e-Working Week 2021
Smart Surveyors for Land and Water Management - Challenges in a New Reality
Virtually in the Netherlands, 21–25 June 2021
Part B. Semi-automated identification of the soil erosion feature: The steps in this part are
 as follows:
 1. Conversion of B-spline approximated 3D point cloud to a raster representing the post-
 erosion soil surface. For this rasterization a regular grid resolution of 1 mm is chosen
 (Figure 1 b).
 2. Cell-by-cell based calculation of the local height deviation to the mean height of the

 area of interest = (∑ ) / , where zi denotes the height value of raster cell i, zk

 denotes the height value of raster cell k and n represents the number of raster cells in the
 area of interest.
 3. Selection of all raster cells with devz-values lower than the x. percentile, where x has to
 be defined at the moment by an analyst in a process of manual backward model
 selection. Calculations are conducted for each percentile (x = [1, 2, 3 … 100]) as a basis
 for backward model selection. The criterion for the model selection is the agreement of
 the calculated volume with an externally determined volume of the soil erosion feature.
 4. Extraction of all contiguous grid cells as regions of interest out of the selected raster
 cells (Figure 1 c).
 5. Automatic selection of the largest region as the area of interest covering the relevant
 soil erosion feature and its conversion into a polygon (Figure 1 d).
 Part C. Volume calculation of the soil erosion feature: The soil erosion feature volume
 calculation requires the following steps:
 1. Usage of the edge of the previously generated polygon to extract the height / z-value of
 the soil surface at the edge of the soil erosion feature (Figure 1 e).
 2. Creation of the reconstructed pre-erosion soil surface by triangulation of the z-values at
 the edge of the soil erosion feature (Figure 1 f).
 3. Rasterization of the pre-erosion surface with a regular grid resolution of 1 mm.
 4. Calculation of difference between post-erosion soil surface and reconstructed pre-
 erosion soil surface.

3D Point Cloud Based Spatio-Temporal Monitoring of Natural Objects (11119)
Jens-André Paffenholz, Bastian Steinhoff-Knopp (Germany) and Corinna Harmening (Austria)
FIG e-Working Week 2021
Smart Surveyors for Land and Water Management - Challenges in a New Reality
Virtually in the Netherlands, 21–25 June 2021
Figure 1: Visualisation of the workflow to identify the soil erosion feature and reconstruct the
 pre-erosion soil surface. Example for the erosion feature 1 (see Section 4).

3D Point Cloud Based Spatio-Temporal Monitoring of Natural Objects (11119)
Jens-André Paffenholz, Bastian Steinhoff-Knopp (Germany) and Corinna Harmening (Austria)
FIG e-Working Week 2021
Smart Surveyors for Land and Water Management - Challenges in a New Reality
Virtually in the Netherlands, 21–25 June 2021
4. APPLICATION OF OUR PROPOSED METHOD TO THREE EROSION
 FEATURES
 An experimental setup is chosen to develop and test the quantification method introduced in
 the previous section. For this purpose, three differently shaped erosion features (artificial rills)
 are created in a box filled with soil (see Figure 2, bottom).

 The erosion features are captured with a terrestrial laser scanner of type Zoller+Fröhlich (Z+F)
 Imager 5010X with the acquisition parameters “resolution high” and “default noise”. To avoid
 shadowed areas, the 3D point clouds are captured from 8 fixed positions on each side and corner
 of the box (see Figure 2, top left). The individual 3D point clouds of each position are referenced
 via targets into a single 3D point cloud using the Z+F LaserControl software. This 3D point
 cloud serves as the basis for the subsequent determination of the erosion features’ volumes.
 Finally, the artificial erosion features are filled with quartz sand with a known density of 1.5
 g/ml. The volumes determined by backweighting the quartz sand serve as reference and
 criterion for backward model selection (see Section 3) of the determined volumes.

 Figure 2: Design of the experimental setup: Position of the box filled with soil, the scan
 positions and targets (top left), pictures of the three evaluated erosion features (1, 2, 3, bottom),
 exemplary filling of erosion feature 3 with quartz sand for external volume determination (top
 right.)

 Applying the method to determine the volume of the erosion features as described in Section 3,
 models are selected by backward model selection with the reference volume as selection

3D Point Cloud Based Spatio-Temporal Monitoring of Natural Objects (11119)
Jens-André Paffenholz, Bastian Steinhoff-Knopp (Germany) and Corinna Harmening (Austria)
FIG e-Working Week 2021
Smart Surveyors for Land and Water Management - Challenges in a New Reality
Virtually in the Netherlands, 21–25 June 2021
criterion. Table 1 summarises the results. It is possible to find satisfying fitting models for all
 three erosion features, with the applied percentile of devz varying from the 35. to the 56.
 percentile.

 Table 1: Determined volumina of the soil erosion features and deviation to the external
 determined reference value.
 Erosion Feature Method Volume [ml] Deviation [%]

 Erosion Feature 1 Filling with quartz sand (reference) 1927 -
 Semi-automatic GIS-based method 1880 -2.44
 (selected model: 43. percentile devz)

 Erosion Feature 2 Filling with quartz sand (reference) 960 -
 Semi-automatic GIS-based method 961 0.10
 (selected model: 35. percentile devz)

 Erosion Feature 3 Filling with quartz sand (reference) 1089 -
 Semi-automatic GIS-based method 1078 -1.01
 (selected model: 56. percentile devz )

 5. CONCLUSIONS AND OUTLOOK
 This contribution aims to provide an overview of 3D point cloud based spatio-temporal
 monitoring. The literature review states that this research field is manifold and still under
 development with solved questions and challenges to tackle.
 In particular, the huge amount of individual 3D points in the cloud, their proper approximation
 and finally the statistical testing of differences in the scope of a deformation analysis are current
 research topics. For statistical testing, the consideration of uncertainty information is
 mandatory. This can be seen as an independent research question and is approached, e.g., by
 (Wujanz et al., 2018).

 In our ongoing research, we evaluated the quantification of soil erosion features by means of a
 TLS. The key challenge in this research is the quantification of soil loss volumes without
 knowledge about pre-erosion conditions. The method to calculate the volume of soil erosion
 features described here is capable of producing correct results in a process of stepwise backward
 modelling when an external reference is provided. Our results presented here also show that we
 have not yet found a generally valid parameter (resp. a value of a parameter) with which the
 determination of the volume can be automated. This reflects that the general approach has a
 high potential, but a parameter to automatise the selection of the erosion feature and reconstruct
 the pre-erosion soil surface is needed. Ongoing analysis of the data shows that such a parameter
 should take into account the roughness of the soil surface and the depth of the erosion form. A
 promising alternative approach to remodel the pre-erosion soil surface is to extract the ridge
 edge of the erosion feature.

3D Point Cloud Based Spatio-Temporal Monitoring of Natural Objects (11119)
Jens-André Paffenholz, Bastian Steinhoff-Knopp (Germany) and Corinna Harmening (Austria)
FIG e-Working Week 2021
Smart Surveyors for Land and Water Management - Challenges in a New Reality
Virtually in the Netherlands, 21–25 June 2021
REFERENCES
 Báčová, M., Krása, J., Devátý, J., Kavka, P. (2019). A GIS method for volumetric assessments of erosion rills
 from digital surface models. European Journal of Remote Sensing 52 (sup1), 96–107.
 doi:10.1080/22797254.2018.1543556.
 Cox, M. G. (1972): The Numerical Evaluation of B -Splines. In: IMA J Appl Math 10 (2), S. 134–149. doi:
 10.1093/imamat/10.2.134.
 Boor, C. de (1972): On calculating with B-splines. In: Journal of Approximation Theory 6 (1), S. 50–62. doi:
 10.1016/0021-9045(72)90080-9.
 Bureick, J., Alkhatib, H., Neumann, I. (2019): Fast converging elitist genetic algorithm for knot adjustment in B-
 spline curve approximation. In: Journal of Applied Geodesy 13 (4), pp. 317–328. doi: 10.1515/jag-2018-0015.
 Bureick, J., Alkhatib, H., Neumann, I. (2016). Robust Spatial Approximation of Laser Scanner Point Clouds by
 Means of Free-form Curve Approaches in Deformation Analysis. In: Journal of Applied Geodesy, Vol. 10, No. 1,
 pp. 27–35, doi: 10.1515/jag-2015-0020.
 Butt, J.; Gojcic, Z.; Schmid, L.; Wieser, A. Terrestrische Radarinterferometrie und terrestrisches Laserscanning
 zur Überwachung alpinen Geländes: Praxiserfahrungen und Theorie. In: Tagungsband GeoMonitoring 2020.
 Braunschweig, S. 187-206. doi: 10.15488/9350.
 Di Stefano, C., Ferro, V., Palmeri, V., Pampalone, V. (2017). Measuring rill erosion using structure from motion:
 A plot experiment. CATENA 156, 383–392. doi:10.1016/j.catena.2017.04.023.
 d'Oleire-Oltmanns, S., Marzolff, I., Peter, K., Ries, J. (2012). Unmanned Aerial Vehicle (UAV) for Monitoring
 Soil Erosion in Morocco. Remote Sensing 4 (11), 3390–3416. doi:10.3390/rs4113390.
 Eling, D. (2009). Terrestrisches Laserscanning für die Bauwerksüberwachung. PhD thesis. Munich : DGK (Reihe
 C, 641).
 Eltner, A., Schneider, D., Maas, H.-G. (2016). Integrated Processing Of High Resolution Topographic Data For
 Soil Erosion Assessment Considering Data Acquisition Schemes And Surface Properties. Int. Arch. Photogramm.
 Remote Sens. Spatial Inf. Sci. XLI-B5, 813–819. doi:10.5194/isprs-archives-XLI-B5-813-2016.
 Eltner, A., Baumgart, P., Maas, H.-G., Faust, D. (2015). Multi-temporal UAV data for automatic measurement of
 rill and interrill erosion on loess soil. Earth Surf. Process. Landforms 40 (6), 741–755. doi:10.1002/esp.3673.
 ESRI Inc. (2020). ArcGIS Pro (Release 2.7.1). Software. Redlands, USA
 Gojcic, Z., Zhou, C., Wieser, A (2019): Robust pointwise correspondences for point cloud based deformation
 monitoring of natural scenes. In: Proceedings of the 4th Joint International Symposium on Deformation
 Monitoring (JISDM). Athens, Greece.
 Harmening, C., Neuner, H. (2020). A spatio-temporal deformation model for laser scanning point clouds. Journal
 of. Geodesy, Vol. 94, doi:10.1007/s00190-020-01352-0.
 Harmening, C., Neuner, H. (2017). Choosing the optimal number of B-spline control points. Part 2: Approximation
 of surfaces and applications. In: Journal of Applied Geodesy, Vol. 11, No. 1, pp. 43–52, doi: 10.1515/jag-2016-
 0036.
 Harmening, C., Neuner, H. (2016). Choosing the optimal number of B-spline control points. Part 1: Methodology
 and Approximation of Curves. In: Journal of Applied Geodesy, Vol. 10, No. 3, pp. 139–157, doi: 10.1515/jag-
 2016-0003.
 Harmening, C., Neuner, H. (2015). A constraint-based parameterization technique for B-spline surfaces. In:
 Journal of Applied Geodesy, Vol. 9, No. 3, pp. 143–161, doi: 10.1515/jag-2015-0003.
 Harmening, C., Paffenholz, J.-A. (2021). A Fully Automated Three-Stage Procedure for Spatio-Temporal Leaf
 Segmentation with Regard to the B-Spline-Based Phenotyping of Cucumber Plants. Remote Sens. 2021, 13, 74,
 doi:10.3390/rs13010074.
 Jiang, Y., Li, C., Takeda, F., Kramer, E.A., Ashrafi, H., Hunter, J. (2019). 3D point cloud data to quantitatively
 characterize size and shape of shrub crops. Hortic. Res., 6, 43, doi:10.1038/s41438-019-0123-9.

3D Point Cloud Based Spatio-Temporal Monitoring of Natural Objects (11119)
Jens-André Paffenholz, Bastian Steinhoff-Knopp (Germany) and Corinna Harmening (Austria)
FIG e-Working Week 2021
Smart Surveyors for Land and Water Management - Challenges in a New Reality
Virtually in the Netherlands, 21–25 June 2021
Holst, C., Janßen, J., Schmitz, B., Blome, M., Dercks, M., Schoch-Baumann, A., Blöthe, J., Schrott, L., Kuhlmann,
 H., Medic, T. (2021). Increasing Spatio-Temporal Resolution for Monitoring Alpine Solifluction Using Terrestrial
 Laser Scanners and 3D Vector Fields. Remote Sensing, 13, 1192, doi:10.3390/rs13061192.
 Holst, C., Nothnagel, A., Blome, M., Becker, P., Eichborn, M., Kuhlmann, H. (2015). Improved area-based
 deformation analysis of a radio telescope’s main reflector based on terrestrial laser scanning. In: Journal of Applied
 Geodesy, Vol. 9, No. 1, pp. 1–14, doi: 10.1515/jag-2014-0018 2015.
 Holst, C., Kuhlmann, H. (2016). Challenges and Present Fields of Action at Laser Scanner Based Deformation
 Analyses. In: Journal of Applied Geodesy, Vol. 10, No. 1, pp. 17–25, doi: 10.1515/jag-2015-0025.
 Holst, C., Neuner, H. (2021). Spatio-Temporal Models for Vibration Monitoring of Elongated Structures Using
 Profile Laser Scans. Remote Sensing, 13, 1369, doi:10.3390/rs13071369.
 Kerekes, G., Schwieger, V. (2020). Elementary Error Model Applied to Terrestrial Laser Scanning Measurements:
 Study Case Arch Dam Kops. Mathematics, Vol. 8, 593, doi:10.3390/math8040593.
 Kermarrec, G., Kargoll, B., Alkhatib, H. (2020). Deformation Analysis Using B-Spline Surface with Correlated
 Terrestrial Laser Scanner Observations—A Bridge Under Load. Remote Sensing, Vol. 12, 829,
 doi:10.3390/rs12050829.
 Koch, K. R. (2009).Fitting free-form surfaces to laserscan data by NURBS, In: allgemeine vermessungs-
 nachrichten (avn), Vol. 116, No. 4, pp. 134–140.
 Liebig, J., Grünberg, J., Paffenholz, J.-A., Vennegeerts, H. (2011). Taktile und laserbasierte Messverfahren für die
 messtechnische Überwachung einer Autobahnbrücke. In: Bautechnik, Vol. 88, No. 11, pp. 749–756. doi:
 10.1002/bate.201101514 2011.
 Medić, T., Kuhlmann, H., Holst, C. (2020). Designing and Evaluating a User-Oriented Calibration Field for the
 Target-Based Self-Calibration of Panoramic Terrestrial Laser Scanners. Remote Sensing, Vol. 12, 15,
 doi:10.3390/rs12010015.
 Mukupa, W., Roberts, G.W., Hancock, C.M., Al-Manasir, K. (2016). A review of the use of terrestrial laser
 scanning application for change detection and deformation monitoring of structures. Survey Review, 1–18,
 doi:10.1080/00396265.2015.1133039.
 Neuner, H., Holst, C., Kuhlmann, H. (2016). Overview on current modelling strategies of point clouds for
 deformation analysis. In: allgemeine vermessungs-nachrichten (avn), Vol. 123, No. 1-12, pp. 328–339.
 Osada, E., Sośnica, K., Borkowski, A., Owczarek-Wesołowska, M., Gromczak, A. (2017). A Direct
 Georeferencing Method for Terrestrial Laser Scanning Using GNSS Data and the Vertical Deflection from Global
 Earth Gravity Models. Sensors (Basel) , 17, doi:10.3390/s17071489.
 Paffenholz, J.-A. (2012). Direct geo-referencing of 3D point clouds with 3D positioning sensors. PhD thesis.
 Munich : DGK (Reihe C, 689), doi: 10.15488/4698.
 Paffenholz, J.-A., Wujanz, D. (2019). Spatio-temporal monitoring of a bridge based on 3d point clouds - a
 comparison among several deformation measurement approaches. In: Proceedings of the 4th Joint International
 Symposium on Deformation Monitoring (JISDM). Athens, Greece.
 Paulus, S. (2019). Measuring crops in 3D: using geometry for plant phenotyping. Plant Methods, 15, 103,
 doi:10.1186/s13007-019-0490-0.
 Peter, K.D., d'Oleire-Oltmanns, S., Ries, J.B., Marzolff, I., Ait Hssaine, A. (2014). Soil erosion in gully catchments
 affected by land-levelling measures in the Souss Basin, Morocco, analysed by rainfall simulation and UAV remote
 sensing data. CATENA 113, 24–40. doi:10.1016/j.catena.2013.09.004.
 Piegl, L., Tiller, W. (1997): The NURBS Book. Second Edition. Berlin, Heidelberg: Springer (Monographs in
 Visual Communication). doi: 10.1007/978-3-642-59223-2.
 Schill, F., Eichhorn, A. (2019). Deformation Monitoring of Railway Bridges with a Profile Laser Scanner. zfv
 (Zeitschrift für Geodäsie, Geoinformation und Landmanagement), Vol. 144, No. 2, pp. 109-118, doi:
 10.12902/zfv-0248-2018.

3D Point Cloud Based Spatio-Temporal Monitoring of Natural Objects (11119)
Jens-André Paffenholz, Bastian Steinhoff-Knopp (Germany) and Corinna Harmening (Austria)
FIG e-Working Week 2021
Smart Surveyors for Land and Water Management - Challenges in a New Reality
Virtually in the Netherlands, 21–25 June 2021
Schmitt, C., Neuner, H.., Kromoser, B. (2019). Geodetic surface based methods for structural analysis during
 construction phase. In: Proceedings of the 4th Joint International Symposium on Deformation Monitoring
 (JISDM). Athens, Greece.
 Steinhoff-Knopp, B., Eltner, A., Hake, F., Paffenholz, J.-A. (2019): Methoden zur skalenübergreifend
 hochaufgelösten Erfassung und Quantifizierung von Bodenerosion durch Wasser. In: Alkhatib, H. und Paffenholz,
 J.-A. (Hg.): Tagungsband GeoMonitoring 2019. Hannover, S. 75–89. doi: 10.15488/4514.
 Truong-Hong, L., Lindenbergh, R. (2019): Measuring deformation of bridge structures using laser scanning data.
 In: Proceedings of the 4th Joint International Symposium on Deformation Monitoring (JISDM). Athens, Greece.
 Uggla, G., Horemuz, M. (2021). Conceptualizing Georeferencing for Terrestrial Laser Scanning and Improving
 Point Cloud Metadata. Journal of Surveying Engineering, Vol. 147, 2520001, doi:10.1061/(ASCE)SU.1943-
 5428.0000344.
 Wujanz, D., Burger, M., Mettenleiter, M., Neitzel, F. (2017). An intensity-based stochastic model for terrestrial
 laser scanners. In: ISPRS Journal of Photogrammetry and Remote Sensing, Vol. 125, pp. 146-155, doi:
 10.1016/j.isprsjprs.2016.12.006.
 Wujanz, D., Burger, M., Tschirschwitz, F., Nietzschmann, T., Neitzel, F., Kersten, T. P. (2018). Determination of
 Intensity-Based Stochastic Models for Terrestrial Laser Scanners Utilising 3D-Point Clouds. In: Sensors (Basel)
 18 (7). DOI: 10.3390/s18072187.
 Wunderlich, T., Niemeier, W., Wujanz, D., Holst, C., Neitzel, F., Kuhlmann, H (2016). Areal deformation analysis
 from TLS point clouds – the challenge. In: allgemeine vermessungs-nachrichten (avn), Vol. 123, No. 11-12, pp.
 340–351.
 Ziamtsov, I., Navlakha, S. (2020). Plant 3D (P3D): a plant phenotyping toolkit for 3D point clouds. Bioinformatics,
 36, 3949–3950, doi:10.1093/bioinformatics/btaa220.

 BIOGRAPHICAL NOTES

 Prof. Dr.-Ing. Jens-André Paffenholz received his diploma (Dipl.-Ing.) and his Ph.D. in
 Geodesy and Geoinformatics at the Leibniz University Hannover in 2006 and 2012,
 respectively. From 02-2014 to 11-2019, he has been postdoctoral fellow and the leader of the
 working group Terrestrial Laser Scanner Based Multi-Sensor Systems | Engineering Geodesy
 at the Geodetic Institute of the Leibniz University Hannover. Since 11-2019 he is a full
 professor for Geomatics for underground systems at the Institute of Geo-Engineering of
 Clausthal University of Technology. His research profile is based on laser scanning and multi-
 sensor systems with the aim of an efficient three-dimensional data acquisition for monitoring
 and change detection of natural and anthropogenic structures. He is active in national (DVW
 e. V. WG 4: "Engineering Surveys") and international scientific associations (working group
 chair of IAG WG 4.1.3: "3D Point Cloud based Spatio-temporal Monitoring").

 Dr. Corinna Harmening received her Master degree in Geodesy and Geoinformatics at
 Leibniz University Hanover in 2013. She received her Ph.D. from TU Wien in 2020. Currently,
 she is a postdoctoral fellow at the department for geodesy and geoinformation at TU Wien. She
 is active in international scientific associations (working group co-chair of IAG WG 4.1.3: “3D
 Point Cloud based Spatio-temporal Monitoring” and commission co-chair of FIG Commission
 6: “Engineering Surveys”).

 Dr. Bastian Steinhoff-Knopp studied geography, geology, geoinformatics and cartography at
 the Leibniz Universität Hannover and obtained his PhD in natural sciences in 2016. He has been

3D Point Cloud Based Spatio-Temporal Monitoring of Natural Objects (11119)
Jens-André Paffenholz, Bastian Steinhoff-Knopp (Germany) and Corinna Harmening (Austria)
FIG e-Working Week 2021
Smart Surveyors for Land and Water Management - Challenges in a New Reality
Virtually in the Netherlands, 21–25 June 2021
working since 2011 at the Institute for Physical Geography and Landscape Ecology at the
 Leibniz Universität Hannover, Germany. His main research interests are the understanding of
 spatial and temporal patterns of soil erosion under different management practices, the
 development of field methods to estimate soil loss and the assessment and mapping of
 regulating ecosystem services.

 CONTACTS

 Prof. Dr.-Ing. Jens-André Paffenholz
 Clausthal University of Technology
 Institute of Geo-Engineering
 Chair of Geomatics for Underground Systems
 Erzstraße 18, 38678 Clausthal-Zellerfeld, GERMANY
 jens-andre.paffenholz@tu-clausthal.de
 www.ige.tu-clausthal.de

 Dr. Corinna Harmening
 TU Wien
 Department of Geodesy and Geoinformation
 Wiedner Hauptstr. 8/E120, 1040 Vienna, AUSTRIA
 corinna.harmening@geo.tuwien.ac.at
 www.geo.tuwien.ac.at

 Dr. Bastian Steinhoff-Knopp
 Leibniz University Hannover
 Institute of Physical Geography & Landscape Ecology
 Schneiderberg 50, 30167 Hannover, Germany
 steinhoff-knopp@phygeo.uni-hannover.de
 www.phygeo.uni-hannover.de

3D Point Cloud Based Spatio-Temporal Monitoring of Natural Objects (11119)
Jens-André Paffenholz, Bastian Steinhoff-Knopp (Germany) and Corinna Harmening (Austria)
FIG e-Working Week 2021
Smart Surveyors for Land and Water Management - Challenges in a New Reality
Virtually in the Netherlands, 21–25 June 2021
You can also read