An Improved CNN Architecture to Diagnose Skin Cancer in Dermoscopic Images Based on Wildebeest Herd Optimization Algorithm - Hindawi.com
←
→
Page content transcription
If your browser does not render page correctly, please read the page content below
Hindawi
Computational Intelligence and Neuroscience
Volume 2021, Article ID 7567870, 9 pages
https://doi.org/10.1155/2021/7567870

Research Article
An Improved CNN Architecture to Diagnose Skin Cancer in
Dermoscopic Images Based on Wildebeest Herd
Optimization Algorithm

 Biying Zhou1 and Behdad Arandian 2

 1
 School of Computer, Weinan Normal University, Weinan 714099, Shaanxi, China
 2
 Department of Electrical Engineering, Dolatabad Branch, Islamic Azad University, Isfahan, Iran

 Correspondence should be addressed to Behdad Arandian; b.arandian@iauda.ac.ir

 Received 14 July 2021; Revised 7 August 2021; Accepted 16 August 2021; Published 29 August 2021

 Academic Editor: V. Rajinikanth

 Copyright © 2021 Biying Zhou and Behdad Arandian. This is an open access article distributed under the Creative Commons
 Attribution License, which permits unrestricted use, distribution, and reproduction in any medium, provided the original work is
 properly cited.
 Skin cancer is one of the most common types of cancers that is sometimes difficult for doctors and experts to diagnose. The
 noninvasive dermatoscopic method is a popular method for observing and diagnosing skin cancer. Because this method is based
 on ocular inference, the skin cancer diagnosis by the dermatologists is difficult, especially in the early stages of the disease.
 Artificial intelligence is a proper complementary tool that can be used alongside the experts to increase the accuracy of the
 diagnosis. In the present study, a new computer-aided method has been introduced for the diagnosis of the skin cancer. The
 method is designed based on combination of deep learning and a newly introduced metaheuristic algorithm, namely, Wildebeest
 Herd Optimization (WHO) Algorithm. The method uses an Inception convolutional neural network for the initial features’
 extraction. Afterward, the WHO algorithm has been employed for selecting the useful features to decrease the analysis time
 complexity. The method is then performed to an ISIC-2008 skin cancer dataset. Final results of the feature selection based on the
 proposed WHO are compared with three other algorithms, and the results have indicated good results for the system. Finally, the
 total diagnosis system has been compared with five other methods to indicate its effectiveness against the studied methods. Final
 results showed that the proposed method has the best results than the comparative methods.

1. Introduction are the important points in early diagnosis. There is usually
 no symmetry in the skin lesion, and one half of the lesion is
Skin cancer is the most common malignant cancer of the different from the other. The margin of the lesion is not clear
body [1]. This cancer is caused by the uncontrolled and and is not well diagnosable from the surrounding healthy
abnormal growth of skin cells. Ultraviolet rays from sunlight skin. The lesion may be seen in several different colors.
and tanning lamps cause genetic changes in the nucleus of Brown and black are more common, and red, white, and
skin cells [2]. If the body’s immune system fails to repair the blue are less common [5]. The diameter of the lesions is
damage, skin cells begin to grow rapidly and unrestrained, usually more than six millimeters. The last important
initially appearing as fast-growing moles with bleeding, symptom is the difference between a fleshy spot or a brown
tumors, or wounds that do not heal such that if not treated, it spot and other spots on the body, which usually begin to
spread to other areas (metastasis) [3]. change shape and color or cause itching and bleeding [6].
 One of the most dangerous types of skin cancer is Melanoma, as one of the skin cancers, is responsible for
melanoma. Melanoma is the deadliest type of skin cancer. 50% of deaths associated with skin cancers. The source of this
Melanoma commonly begins with changes in an old or disease is in the epidermal and dermal layers of the skin [7].
normal mole or suddenly appears as a black or dark brown This disease is formed by the accumulation of melanin
area on the skin. Early detection is very important [4]. Here granules, and it is spread to the outermost layer of the skin.
2 Computational Intelligence and Neuroscience

Since determining the extent of the lesion and somehow advantages and shortages. Moreover, using deep learning
extracting the exact boundary between the lesion and the for this purpose is also too useful. However, using the
background is one of the most influential parameters in combination of these works is not provided or may be too
clinical methods of diagnosing cancerous lesion, therefore, rare. Therefore, in this paper, a new diagnosis method was
providing lesion diagnosis methods is of great importance [8]. proposed for melanoma detection. The method extracted
 Goldman first invented the dermatoscope, which eval- features of the images by the help of a CNN that is done
uates changes in skin pigmentation under disease condi- from the melanoma dermoscopic images. Afterward, the
tions. Dermatologists then used this device as a suitable and Water Strider Algorithm (WSA) is for optimal selection of
noninvasive tool to observe skin lesions. With the devel- the only relevant features. Here, we utilized WSA as a
opment of science in recent years, the digital dermatoscope feature selector from deep features which are generated by
has been replaced by conventional dermatoscopes with the the CNN with large redundancy. The results showed that
ability to capture and store skin images. Therefore, it is this process can develop the diagnosis accuracy of the
possible to provide commercial software packages to help melanoma. The next sections of this paper are organized as
diagnose some skin lesions, create databases, and create a follows. In Section 2, the main materials and methods are
medical resume for each patient [9]. explained. This section contains the structure of the CNN
 Melanoma diagnosis by modern smart devices, in the and how the CNN can be used for the features extraction.
early stages of its formation, is a very important issue that has Section 3 describes about the definition of the Wildebeest
involved many researchers [10]. Meanwhile, melanoma due Herd Optimization Algorithm. In Section 4, the utilized
to its high prevalence has attracted a large amount of research. dataset has been described. Section 5 includes the simu-
For example, Razmjooy et al. presented a new well-organized lation results and the discussions about the results. The
technique to diagnose the melanoma from dermoscopy paper has been concluded in Section 6.
images. Firstly, the additional scales were removed using edge
detection and smoothing. Then, the data were segmented, and 2. The Convolutional Neural Network
mathematical morphology was used as postprocessing sec-
tion. They also used an optimized multilayer perceptron 2.1. CNN-Based Features Extraction. The present paper uses
(MLP) for the final classification. The optimization was based a convolutional neural network (CNN) for establishing the
on the World Cup Optimization (WCO) Algorithm. Simu- feature extraction of the melanoma dermoscopic images. A
lation results indicated the high accuracy of the system based pretrained model of CNN has been trained on the dataset
on the authors explanations [11]. that includes several of images on different classes. So, the
 Pathan et al. proposed an automatic system for the di- transfer learning has been implemented by transferring
agnosis of the melanoma. The method contained a set of weights which were already trained and reserved into the
sequential stages. 2D Gabor filters were used for detection of structure of the pretrained model, like Inception, in this
the pigment network masks. A machine learning based on paper. Three main parameters are considered for the CNN:
the rules was then produced from the pigment network Filter size, Stride, and Max pooling. The present study uses
masks to detection of the typical and atypical pigment size 2 filters, and also size 2 stride parameter and 2 × 2 Max
network patterns. The method was implemented on PH2 pooling filter are employed. The main target of convolutional
dataset. The method was also compared with some state-of- layers here is to provide a proper features extraction from the
the-art techniques from the literature to show the method input images. Here, we used different convolutional layers
effectiveness [12]. that have been implemented to extract various features like
 Xu et al. presented another automatic CAD-based texture, edges, high-lighted patterns, and colors from the
technique for early diagnosis of melanoma. In the method, images.
the noise of the input images was first reduced by a median Three fully connected layers are then used for clas-
filter. Then, a new optimized method for segmentation of the sification. We also used Softmax as activation function to
region of interest was proposed based on the convolutional provide a binary output (positive melanoma and negative
neural network (CNN). To improve the CNN efficiency, it is melanoma). The last concatenation layer that includes the
optimized based on the satin bowerbird optimization (SBO) extracted features has been kept, and the top layers such as
algorithm. Afterward, the main features of the region of the Flatten, Drop out, and the Dense layers which the later
interest were extracted for the next step. Because of the large performs classification have been removed. The weights
volume of the features, an optimized feature selection based have been updated by RMSprop optimizer, and cross
on the SBO algorithm was also utilized. At last, the images entropy loss function and learning rate are set as 1e − 4.
were classified based on a support vector machine (SVM). The input shape for the feature extractor (Inception) is
Final results were implemented on the American Cancer [225, 225, 3]. Figure 1 shows an overview of Inception
Society database, and the results were compared with network [14].
some state-of-the-art methods to show the method domi- A significant disadvantage of the pretrained models like
nance [13]. Inception is that their construction needs a big memory as
 As can be observed from the literature, several and well as storage capacity, that makes a high time complexity
different techniques were proposed for skin cancer diag- for the system. Therefore, some statistical operations are
nosis. However, providing an optimal technique for the added to ignore immaterial features. In the following, these
diagnosis system is not too simple, and each of them has its features have been briefly given [14].
Computational Intelligence and Neuroscience 3

 3×3 Max pooling
 strides

 Input Dataset 3×3 convolution 3×3 convolution 3×3 convolution concatenation
 (33 strides) (33 strides) (64 strides) Filter

 3×3 convolution
 (96 strides)

 3×3 convolution 1×7 convolution 7×1 convolution 1×1 convolution
 3×3 convolution (64 strides) (64 strides)
 (96 strides) (64 strides)
 (195 strides)

 concatenation
 SOftmax Filter

 3×3 convolution
 1×1 convolution
 (96 strides)
 (64 strides)
 3×3 Max pooling
 strides
 Figure 1: An overview of Inception network [14].

2.1.1. Tree-Based Classifier. This feature is one of the most Finally, the sum of the importance value in the features
popular methods to advance the classification ratio. In for the trees is evaluated and then divided by the total
addition to high accuracy, they are simple and robust. For all number of trees, i.e.,
decision trees, node importance has been evaluated by Gini
importance, and this is given in the following formula: k∈all trees fi (4)
 Rfi � ,
 T
 right right
 nk � wk Ck − wleft
 k Ck
 left
 − wk Ck , (1)
 where Rfi describes the importance of the ith feature that are
where wk signifies the weighted number of samples that evaluated from all trees, where fi describes the normalized
reaches the node k, nk describes the importance of node l, Ck feature importance for the ith feature in the jth tree and T
defines the contamination value of the kth node, and left and defines the total number of trees.
right represent the child nodes from the left and the right
splits on the kth node, respectively. The importance of the
features is then evaluated. 2.1.2. Chi-Square. This feature has been implanted to
 eliminate the features with high correlation values by
 j:node k splits on feature i nk evaluating their dependency. This is evaluated on all classes
 fi � , (2)
 j∈all nodes nj between each feature:
 n 2
where nk describes the importance of the kth node and fi Yj − Ej
 ψ2 � , (5)
describes the importance of feature i. j�1 Ej
 Normalize the values in the range [0, 1] by dividing the
sum of all feature importance values, i.e., where Yj and Ej represent the real and the expected feature
 values, respectively.
 fi
 fi � . (3) Here, after establishing Chi-square, the feature vector
 k∈all nodes fk has been minimized for the dataset.
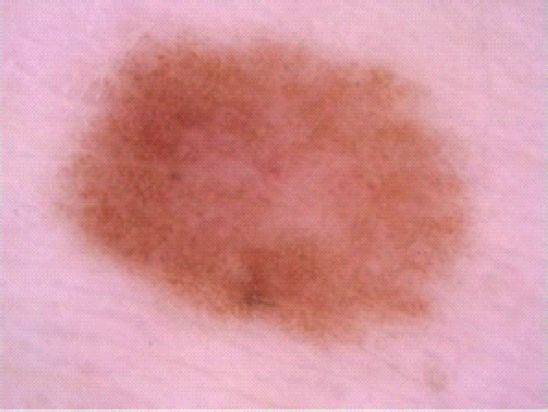
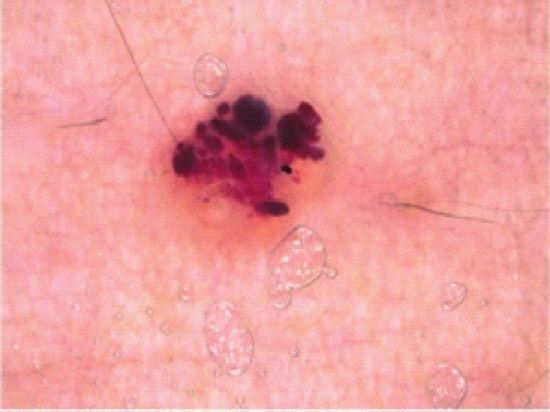
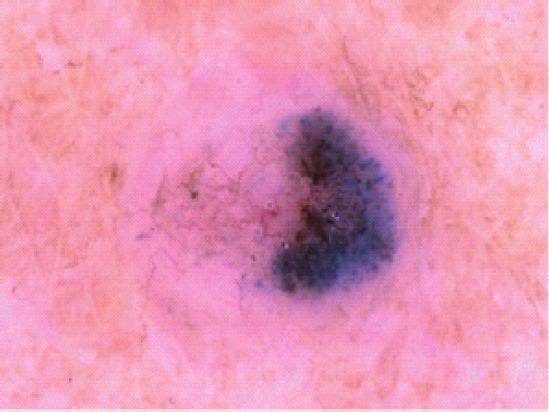
4 Computational Intelligence and Neuroscience

3. Wildebeest Herd Optimization Algorithm Then, a constant number (n) of minor random candi-
 dates is evaluated, and the wildebeest updates its position to
The main target of optimization is to provide the most get an optimal random location, i.e.,
desirable solution to the problem by considering its
limitations and other features. Numerous solutions have Xi � α1 × Z∗n + β1 × Xi − Z∗n , (8)
been introduced for solving an optimization problem.
 where α1 and β1 describe the leader variables to lead the local
Formerly, classical methods like Pontryagin maximum
 movement of the candidates.
principle [15] and distributed newton method [16] were
 The last phase is to model the swarm instinct of the
used for this purpose. However, by increasing the com-
 wildebeests. This is simulated once the other candidates are
plexity of the problems, the classical methods have been
 positioned in a location with proper food source, i.e.,
weakened such that they failed in solving some kinds of
NP-hard problems. This made the researchers to move Xi � α2 × Xi + β2 × Xh , (9)
toward and offer newer methods to resolve the classical
optimization methods’ issues. Metaheuristic algorithms where Xh defines a random candidate and α2 and β2 represent
are some kinds of new optimization algorithms that re- the leader variables to lead the local movement of the crew.
cently are used extensively for this purpose. In recent In the Wildebeest Herd optimization algorithm, there is
years, lots of different versions for metaheuristic algo- another term to avoid the candidates from moving to spaces
rithms have been introduced, for example, Manta-Ray with insufficient food source. This term is mathematically
Foraging Optimization (MRFO) [17], World Cup Opti- modeled as follows:
mization (WCO) Algorithm [18], Locust Swarm Opti- Xi ≔ Xi + θ × Xmax − Xmin × v, (10)
mization (LSO) Algorithm [19], and Wildebeest Herd
Optimization (WHO) Algorithm [20]. where v describes a random unit vector.
 In this study, the Wildebeest Herd Optimization Another term in the algorithm is to simulate the crowded
(WHO) Algorithm [20] has been utilized for optimizing of spaces. The crowd happens when there is a wide fertility for
our deep network. The main reason for selecting this the grass. This term is named “individual pressure.” Based on
algorithm is that it is too recent among different types of this term, a challenge is accomplished and the strongest
the metaheuristic algorithms. Also, its results on the candidate demolishes the others using the following equation:
benchmark functions based on the paper provide too �� �� �� ��
better results. This makes us to use this metaheuristic if ��X∗ − Xi �� < η, ��X∗ − Xi �� > 1
 (11)
technique to improve the efficiency of the proposed CNN. then: Xi � X∗ + ε × n ,
The WHO algorithm has been inspired from the behavior
of food searching by the Wildebeests. Wildebeests are where η signifies a threshold to avoid crowding in the spaces
social mammal animals which travel to find food sources. and n describes exploitable parts number close to the op-
The male sex challenges with other competitors to get timum solution point.
females for mating. And the final phase is to simulate the swarm social
 The Wildebeest Herd Optimization (WHO) Algorithm memory to offer better positions that is called swarm social
starts by random initializing a number of population (wil- memory and is obtained by the following equation:
debeests) as candidates. The population is limited between
 X � X∗ + 0.1 × ]. (12)
the lower (Xmin ), and the higher (Xmax ) boundaries, i.e.,
 By combination of the concept of the Wildebeest Herd
 Xi ∈ Xmin , Xmax , (6) Optimization Algorithm with the Inception network, the
 total method of the proposed system has been determined as
where i � 1, 2, . . . , N.
 follows:
 The milling action is then used for local movement of the
wildebeest individuals. The phase is modeled by considering (1) Extracting deep features from Inception.
a consistent number (n) as the minor random movement (2) Initializing solutions for the Wildebeest Herd. The
based on the solution spaces and continuing to find the Herd follows the leader during searching the fertile
optimal position. A random phase Zn has been employed by grass source (solution space).
the candidates in position X that should frequently search
 (3) Attempting the wildebeest to catch the best fertile
for the small random phase positions. A tunable length is
 food source based on exploration and exploitation
accomplished by a random step size to the candidates.
 terms in the algorithm.
Consequently, the local experimental phase Zn is obtained in
the following formula: (4) All stages are repeated until the termination criteria
 have been reached.
 Zn � Xi + ε × θ × ], (7)
 4. The Database
where ε signifies the learning rate variable, Xi describes the
candidate number i, θ represents a randomly uniform value The present study uses International Skin Imaging Collab-
ranged between 0 and 1, and ] defines a random unit vector. oration (ISIC-2008) for validation. This archive defines an
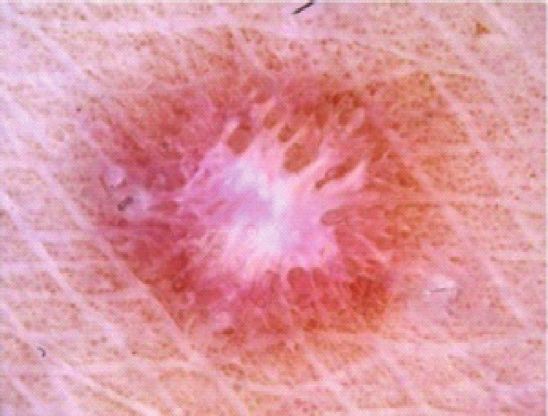
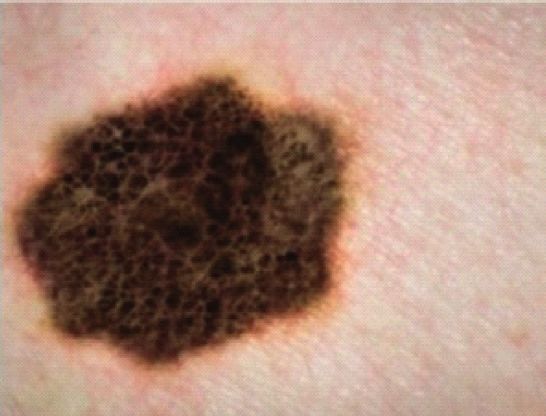
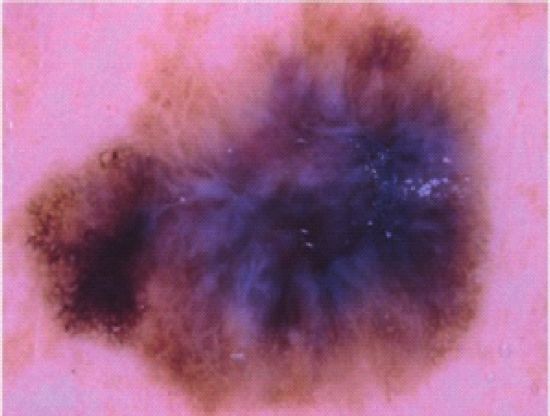
Computational Intelligence and Neuroscience 5

international attempt to progress the research studies for the 1 N
melanoma diagnosis which is supported by the International fitavg � Fit ,
 m i�1 i
Society for Digital Imaging of the Skin (ISDIS). This dataset ���������������������
includes the largest widely available collection of dermo-
 m
scopic images for skin lesions. The dataset includes over 1 2
 Std � × Fiti − fitavg ,
13,000 dermoscopic images that have been gathered from m − 1 i�1
international clinical centers and collected from different
devices within the centers. This international collaboration is i � 1, 2, . . . , m,
to guarantee to collect a proper dataset. Also, a subset of the (14)
images has been labeled by the experts. Figure 2 shows some
 where m describes the number of evaluations and Fiti sig-
examples of the ISIC-2008 dataset [21].
 nifies the fitness function value.
 Once Inception trains the skin cancer images continu-
5. Simulation Results ously in the epochs, these rapid ups and downs are gradually
 minimized in the future training part.
Because the WHO algorithm is a metaheuristic and has After feature extraction based on Inception, the WHO
stochastic nature, the achieved results of this algorithm may algorithm has been performed to optimal selection of the
change during different executions. Consequently, in this features and to eliminate the useless features. Here, the
study, the training method by the WHO algorithm has been results of the proposed WHO-Inception have been com-
repeated for 30 times and the best network has been used for pared with some state-of-the-art optimization algorithms
the analysis. The WHO algorithms and the Inception net- including Chimp optimization algorithm (ChOA) [22],
work have been programmed in MATLAB 2019b 64 bit Biogeography-Based Optimizer (BBO) [23], and Locust
version and executed on computation environment of Intel Swarm Optimization (LS) [24] for feature selection. The
Core i7Intel processor CPU 2.00 GHz, 2.5 GHz, and 32 GB parameter setting of the utilized optimization algorithms is
RAM with and two SLI GeForce Titan GPUs and 64 bit reported in Table 1.
operating system. The convolutional neural networks were Here, the feature selection methods have been employed
under Google lab network. for optimal selection of the generated feature vector from
 The section confirms and discusses about the results of Inception to provide just the useful relevant features. Some
the proposed skin cancer diagnosis system. The method is of the parameters are selected similar to fair comparison. All
performed to the ISIC-2008 dataset. For the dataset, the of the algorithms have 15 iterations and 30 number of
segmented cancer has been assessed by a comparative study candidates. All of the algorithms are run for 35 independent
with the expert’s ground truth image. runs to offer consistent results. Table 2 reports the results of
 To assess the efficiency of the suggested method, the four measurement indicators applied by the before men-
average value of both best values and the worst values (Max) tioned optimization algorithms of the feature selection for
along with standard deviation (Std) and computational time the dataset.
has been evaluated. The mathematical definitions of all As can be observed from Table 2, the proposed WHO
indicators are given as follows: algorithm has the higher efficiency toward the other com-
 (TP + TN) parative algorithms in all four metrics followed by LS,
 ACC � , ChOA, and BBO, respectively. The best results of fitworst
 (FP + TP + TP + FN)
 indicated that the proposed WHO algorithm provides the
 TN best value of the fitness function against the others. Also, LS
 SPC � , is placed on the second rank. Figure 3 shows the running
 FP + TN
 (13) time of the analyzed algorithms.
 TP As can be observed from Figure 3, the proposed WHO
 SNS � ,
 TP + FN algorithm considers the fastest results among all of the
 compared algorithms followed by ChOA and BBO, re-
 SPC × SNS spectively, while LS has the slowest results. Figure 4 shows
 Fscore � 2 × ,
 SPC + SNS the simulation results for number of selected features based
where TP is the true positive, TN is the true negative, FP is on the studied comparative algorithms.
the false positive, and FN is the false negative, and ACC, As can be observed from Figure 4, the proposed WHO
SPC, and SNS represent the accuracy, specificity, and sen- algorithm with 210 features provided less features than other
sitivity, respectively. algorithms. BBO and LS are placed in the second and the
 And the optimization is based on the following equation: third ranks with 314 and 352 selected features, respectively.
 The largest features have been selected by ChOA.
 BestACC � Max ACC, In the following part, the image similarity and statistical
 measures like dice coefficient (DC), accuracy (ACC),
 fitBest � Min Fiti , specificity (SPC), PPV, NPV, and sensitivity (SNS) are
 evaluated. The mathematical model of the parameters is
 fitworst � Max Fiti , given as follows:
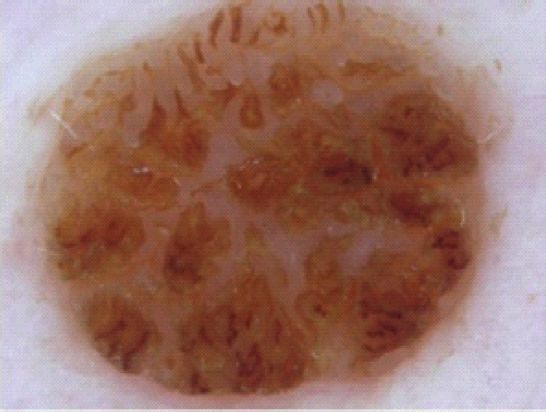
6 Computational Intelligence and Neuroscience

 Figure 2: Some samples of the ISIC-2008 dataset [21].

 Table 1: The parameter setting of the utilized optimization algorithms.
Algorithm Parameter Value
 r1 and r2 Random
ChOA [22]
 m Chaotic
 Habitat modification probability 1
 Immigration probability bounds per gene [0, 1]
BBO [23] Step size for numerical integration of probabilities 1
 Max immigration (I) and Max emigration (E) 1
 Mutation probability 0.005
 F 0.6
LS [24] L 1
 g 20
 Inertia 0.2
 PCross 0.7
WHO [20]
 PMut 0.15
 Toursize 0.7

 Table 2: Results of feature selection by the optimization algorithms.
 Measurement indicator
Algorithm
 fitavg Std fitBest fitworst
ChOA [22] 0.215 0.009 0.194 0.308
BBO [23] 0.597 0.034 0.351 0.640
LS [24] 0.085 0.009 0.041 0.062
WHO 0.037 0.005 0.039 0.051
 Running Time

 60
 40
 (S)

 20
 0
 ChOA BBO LS WHO
 Algorithm

 Figure 3: The running time of the analyzed algorithms.

 800
 Features number

 600
 400
 200
 0
 ChOA BBO LS WHO
 Algorithm

 Figure 4: The simulation results for number of selected features based on the studied comparative algorithms.
Computational Intelligence and Neuroscience 7

 Table 3: The simulation results of the suggested method compared with other state-of-the-art methods.
 Performance metric
Method
 DS ACC SNS SPC NPV PPV
Dorj’s [25] 0.91 0.90 0.93 0.91 0.95 0.85
Linsangan’s [26] 0.89 0.84 0.19 0.64 0.87 0.69
Thanh’s [6] 0.87 0.85 0.87 0.88 0.88 0.81
Khan’s [2] 0.88 0.73 0.86 0.63 0.85 0.62
Angurana’s [27] 0.91 0.76 0.84 0.79 0.88 0.78
Proposed method 0.94 0.96 0.96 0.95 0.97 0.89

 1.2

 1
 PERFORMANCE METRIC

 0.8

 0.6

 0.4

 0.2

 0
 Dorj’s [15] Linsangan’s Thanh’s [17] Khan’s [18] Angurana’s [19] Proposed
 [16] Method

 DS SPC
 ACC NPV
 SNS PPV
 Figure 5: The simulation results of the suggested method compared with other state-of-the-art methods.

 2 × TP second rank in the comparison. Likewise, Linsangan’s,
 Ds � , Khan’s, and Thanh’s methods with 89%, 88%, and 87%,
 ((FP + TP) +(TP + FN))
 respectively, are in the next ranks. Also, the suggested
 TP method with 96% sensitivity as the highest value against the
 PPV � , (15)
 TP + FP others indicates the method’s higher consistency than the
 others. Furthermore, higher value of PPV and NPV for the
 TN suggested method against the others designates its higher
 NPV � ,
 TN + FN condition occurrence for handling the likelihood of a test
 identifying the cancer. In addition, higher results for the
where TP is the true positive, TN is the true negative, FP is
 specificity of the suggested technique indicate its sophisti-
the false positive, and FN is the false negative.
 cated occurrence-independent achievement.
 The final results are compared with 5 state-of-the-art
methods from the literature including Dorj’s [25], Linsan-
gan’s [26], Thanh’s [6], Khan’s [2], and Angurana’s [27]. 6. Conclusions
Table 3 reports the simulation results of the suggested
method compared with other state-of-the-art methods. Skin cancers are one of the most common types of cancer. At
 Figure 5 shows the bar plot of the classification rate. It least 40% of all cancers worldwide are skin cancers. This
can be observed from the results that the presented meth- cancer is on the rise with a terrible trend. Twenty percent of
odology offers the highest accuracy compared with the other Americans have the disease, of which more than 36,000 are
methods from the literature. women and have been diagnosed with melanoma. Therefore,
 As can be observed from Table 1, the suggested tech- early detection of this cancer can play a significant role
nique with 96% accuracy offers the uppermost efficiency incurring this cancer and survive from its dangers. Recently,
among the other comparative methodologies. Similarly, for reducing the experts’ errors, image processing techniques
Dorj’s method and Angurana’s method with 91% have the have been employed for these purposes. These techniques
8 Computational Intelligence and Neuroscience

can play a complementary role alongside of the experts. [5] Q. U. Ain, H. Al-Sahaf, B. Xue, and M. Zhang, “A genetic
Therefore, in the present study, an optimal computer-aided programming approach to feature construction for ensemble
diagnosis system based on deep learning was proposed for learning in skin cancer detection,” in Proceedings of the 2020
early detection of the skin cancer. The idea was to propose an Genetic and Evolutionary Computation Conference,
optimized version of Inception convolutional neural net- pp. 1186–1194, Cancún, Mexico, July 2020.
 [6] D. N. Thanh, V. S. Prasath, and N. N. Hien, “Melanoma skin
work for features extraction from the skin cancer images.
 cancer detection method based on adaptive principal cur-
The results features were then pruned by the Wildebeest vature, colour normalisation and feature extraction with the
Herd Optimization (WHO) Algorithm as a feature selection ABCD rule,” Journal of Digital Imaging, vol. 33, no. 3,
technique. Using the WHO algorithm is to select just the pp. 574–585, 2019.
useful features and to neglect the irrelevant ones. After [7] K. Manasa and D. G. V. Murthy, “Skin cancer detection using
designing the method, it was applied to a standard dataset, VGG-16,” European Journal of Molecular and Clinical
namely, International Skin Imaging Collaboration (ISIC- Medicine, vol. 8, no. 1, pp. 1419–1426, 2021.
2008) dataset with over 13,000 dermoscopic images. The [8] S. Jain, V. Jagtap, and N. Pise, “Computer aided melanoma
simulation results of the proposed method were compared skin cancer detection using image processing,” Procedia
with Chimp optimization algorithm (ChOA), Biogeogra- Computer Science, vol. 48, pp. 735–740, 2015.
phy-Based Optimizer (BBO), and Locust Swarm Optimi- [9] A. Hekler, J. S. Utikal, A. H. Enk et al., “Superior skin cancer
zation (LS) for defining the feature selection efficiency. The classification by the combination of human and artificial
 intelligence,” European Journal of Cancer, vol. 120, pp. 114–
results indicated that the proposed method provides better
 121, 2019.
effectiveness in terms of accuracy, minimizing the number of [10] M. Anas, K. Gupta, and S. Ahmad, “Skin cancer classification
extracted features and the speed. The final diagnosis system using K-means clustering,” International Journal of Technical
were also compared with some well-known methods in- Research and Applications, vol. 5, no. 1, pp. 62–65, 2017.
cluding Dorj’s, Linsangan’s, Thanh’s, Khan’s, and Angur- [11] N. Razmjooy, F. R. Sheykhahmad, and N. Ghadimi, “A hybrid
ana’s methods to show its dominance toward the studied neural network-world cup optimization algorithm for mel-
methods. According to the results, the suggested method anoma detection,” Open Medicine, vol. 13, pp. 9–16, 2018.
based on the EHO algorithm and Inception CNN provides [12] S. Pathan, K. G. Prabhu, and P. C. Siddalingaswamy, “A
the best results among all studied methods. However, the methodological approach to classify typical and atypical
results showed the best results for the proposed WHO al- pigment network patterns for melanoma diagnosis,” Bio-
gorithm, and some other new metaheuristics can be testified medical Signal Processing and Control, vol. 44, pp. 25–37,
 2018.
to solve the problems like monarch butterfly optimization
 [13] Z. Xu, F. R. Sheykhahmad, N. Ghadimi, and N. Razmjooy,
(MBO), earthworm optimization algorithm (EWA), ele-
 “Computer-aided diagnosis of skin cancer based on soft
phant herding optimization (EHO), moth search (MS) al- computing techniques,” Open Medicine, vol. 15, no. 1,
gorithm, Slime mould algorithm (SMA), and Harris hawks pp. 860–871, 2020.
optimization (HHO) which are a good motivation for the [14] A. T. Sahlol, D. Yousri, A. A. Ewees, M. A. A. Al-Qaness,
future work. R. Damasevicius, and M. A. Elaziz, “COVID-19 image clas-
 sification using deep features and fractional-order marine
Data Availability predators algorithm,” Scientific Reports, vol. 10, no. 1,
 pp. 15364–15415, 2020.
The data for the dataset can be obtained in https://www.isic- [15] R. E. Kopp, “Pontryagin maximum principle,” Mathematics in
archive.com/. Science and Engineering, vol. 5, pp. 255–279, 1962.
 [16] A. Jadbabaie, A. Ozdaglar, and M. Zargham, “A distributed
Conflicts of Interest Newton method for network optimization,” in Proceedings of
 the 48th IEEE Conference on Decision and Control (CDC) Held
The authors declare that there are no conflicts of interest. Jointly with 2009 28th Chinese Control Conference,
 pp. 2736–2741, IEEE, Shanghai, China, 2009.
References [17] W. Zhao, Z. Zhang, and L. Wang, “Manta ray foraging op-
 timization: an effective bio-inspired optimizer for engineering
 [1] S. Sugiarti, Y. Yuhandri, J. Na’am, D. Indra, and J. Santony, applications,” Engineering Applications of Artificial Intelli-
 “An artificial neural network approach for detecting skin gence, vol. 87, Article ID 103300, 2020.
 cancer,” TELKOMNIKA Telecommunication Computing [18] R. Navid, “A new meta-heuristic optimization algorithm
 Electronics and Control, vol. 17, no. 2, pp. 788–793, 2019. inspired by FIFA world cup competitions: theory and its
 [2] M. Q. Khan, A. Hussain, S. U. Rehman et al., “Classification of application in PID designing for AVR system,” Journal of
 melanoma and nevus in digital images for diagnosis of skin Control, Automation and Electrical Systems, vol. 27, no. 4,
 cancer,” IEEE Access, vol. 7, pp. 90132–90144, 2019. pp. 419–440, 2016.
 [3] M. Kumar, M. Alshehri, R. AlGhamdi, P. Sharma, and [19] I. Benmessahel, K. Xie, M. Chellal, and T. Semong, “A new
 V. Deep, “A DE-ANN inspired skin cancer detection ap- evolutionary neural networks based on intrusion detection
 proach using fuzzy c-means clustering,” Mobile Networks and systems using locust swarm optimization,” Evolutionary In-
 Applications, vol. 25, no. 4, pp. 1319–1329, 2020. telligence, vol. 12, no. 2, pp. 131–146, 2019.
 [4] A. Arshaghi, M. Ashourian, and L. Ghabeli, “Detection of skin [20] D. Amali and M. Dinakaran, “Wildebeest herd optimization: a
 cancer image by feature selection methods using new Buzzard new global optimization algorithm inspired by wildebeest
 optimization (BUZO) algorithm,” Traitement du Signal, herding behaviour,” Journal of Intelligent and Fuzzy Systems,
 vol. 37, no. 2, pp. 181–194, 2020. vol. 37, no. 6, pp. 8063–8076, 2019.
Computational Intelligence and Neuroscience 9

[21] ISIC 2018: Skin Lesion Analysis Towards Melanoma Detec-
 tion, 2008, https://challenge2018.isic-archive.com.
[22] M. Khishe and M. R. Mosavi, “Chimp optimization algo-
 rithm,” Expert Systems with Applications, vol. 149, Article ID
 113338, 2020.
[23] D. Simon, “Biogeography-based optimization,” IEEE Trans-
 actions on Evolutionary Computation, vol. 12, no. 6,
 pp. 702–713, 2008.
[24] E. Cuevas, F. Fausto, and A. González, “The locust swarm
 optimization algorithm,” in New Advancements in Swarm
 Algorithms: Operators and Applications, Springer, Cham,
 Switzerland, 2020.
[25] U.-O. Dorj, K.-K. Lee, J.-Y. Choi, and M. Lee, “The skin cancer
 classification using deep convolutional neural network,”
 Multimedia Tools and Applications, vol. 77, no. 8, pp. 9909–
 9924, 2018.
[26] N. B. Linsangan, J. J. Adtoon, and J. L. Torres, “Geometric
 analysis of skin lesion for skin cancer using image processing,”
 in Proceedings of the 2018 IEEE 10th International Conference
 on Humanoid, Nanotechnology, Information Technology,
 Communication and Control, Environment and Management
 (HNICEM), pp. 1–5, Baguio City, Philippines, 2018.
[27] N. Angurana, A. P. Rajan, and I. Srivastava, “Skin cancer
 detection and classification,” International Journal of Engi-
 neering and Management Research, vol. 9, 2019.
You can also read