Image and Vision Computing
←
→
Page content transcription
If your browser does not render page correctly, please read the page content below
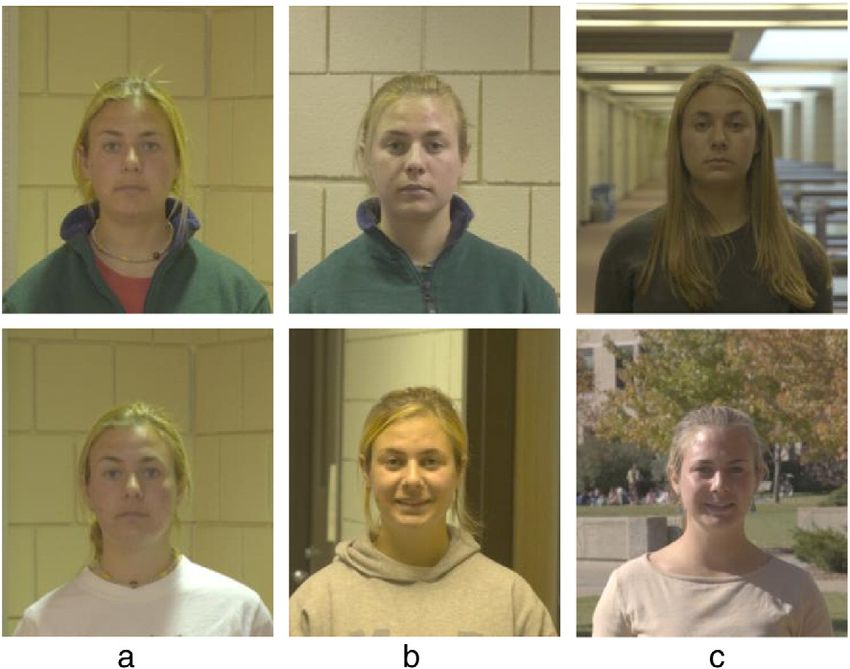
Image and Vision Computing 30 (2012) 177–185

                                                            Contents lists available at SciVerse ScienceDirect

                                                           Image and Vision Computing
                                                   journal homepage: www.elsevier.com/locate/imavis

The Good, the Bad, and the Ugly Face Challenge Problem☆
P. Jonathon Phillips a,⁎, J. Ross Beveridge b, Bruce A. Draper b, Geof Givens b, Alice J. O'Toole c, David Bolme b,
Joseph Dunlop c, Yui Man Lui b, Hassan Sahibzada a, Samuel Weimer c
a
    National Institute of Standards and Technology, Gaithersburg, MD 20899, USA
b
    Colorado State University, Fort Collins, CO 46556, USA
c
    The University of Texas at Dallas, Richardson, TX 75083-0688, USA

a r t i c l e           i n f o                           a b s t r a c t

Article history:                                          The Good, the Bad, and the Ugly Face Challenge Problem was created to encourage the development of algo-
Received 13 August 2011                                   rithms that are robust to recognition across changes that occur in still frontal faces. The Good, the Bad, and
Received in revised form 4 January 2012                   the Ugly consists of three partitions. The Good partition contains pairs of images that are considered easy
Accepted 5 January 2012
                                                          to recognize. The base verification rate (VR) is 0.98 at a false accept rate (FAR) of 0.001. The Bad partition con-
                                                          tains pairs of images of average difficulty to recognize. For the Bad partition, the VR is 0.80 at a FAR of 0.001.
Keywords:
Face recognition
                                                          The Ugly partition contains pairs of images considered difficult to recognize, with a VR of 0.15 at a FAR of
Challenge problem                                         0.001. The base performance is from fusing the output of three of the top performers in the FRVT 2006.
                                                          The design of the Good, the Bad, and the Ugly controls for posevariation, subject aging, and subject “recogniz-
                                                          ability.” Subject recognizability is controlled by having the same number of images of each subject in every
                                                          partition. This implies that the differences in performance among the partitions are a result of how a face
                                                          is presented in each image.
                                                                                                                                                  Published by Elsevier B.V.

1. Introduction                                                                                Traditionally, a challenge problem is specified by the two sets of
                                                                                           images that are to be compared. The difficulty of the problem is
    Face recognition from still frontal images has made great strides                      then characterized by the performance of a set of algorithms tasked
over the last twenty years. Over this period, error rates have de-                         with matching the two sets of face images. To create a problem
creased by three orders of magnitude when recognizing frontal                              with the desired level of difficulty, the performance of a set of algo-
faces in still images taken with consistent controlled illumination in                     rithms can be one component in the design process. Others factors
an environment similar to a studio [1–6]. Under these conditions,                          in the selection process include limiting the number of images per
error rates below 1% at a false accept rate of 1 in 1000 were reported                     person and requiring pairs of images of a person to be collected on
in the Face Recognition Vendor Test (FRVT) 2006 and the Multiple                           different days.
Biometric Evaluation (MBE) 2010 [4,6].                                                         The Good, the Bad, and the Ugly (GBU) challenge problem consists
    With this success, the focus of research is shifting to recognizing                    of three partitions called the Good, the Bad, and the Ugly. The difficul-
faces taken under less constrained conditions, which include greater                       ty of each partition is based on the performance of three top per-
variability in pose, ambient lighting, expression, size of the face, and                   formers in the FRVT 2006. The Good partition consists of pairs of
distance from the camera. The trick in designing a face recognition                        face images of the same person that are easy to match; the Bad parti-
challenge problem is selecting the degree to which the constraints                         tion contains pairs of face images of a person that have average
should be relaxed so that the resulting problem has the appropriate                        matching difficulty; and the Ugly partition concentrates on difficult
difficulty. The complexity of this task is compounded by the fact                           to match face pairs. Nominal performance on the GBU is based on fus-
that it is not well understood how the above factors affect perfor-                        ing the results from three top performers in the FRVT 2006. The Good
mance. The problem cannot be too easy so that it is merely an exer-                        partition has a verification rate (VR) of 0.98 at a false accept rate
cise in tuning existing algorithms, nor so difficult that progress                          (FAR) of 0.001. The Bad and Ugly partitions have VRs of 0.80 and
cannot be made—the three bears problems [2].                                               0.15 at FAR of 0.001, respectively. The performance range over the
                                                                                           three partitions is roughly an order of magnitude. 1

 ☆ This paper has been recommended for acceptance by special issue Guest Editors
                                                                                             1
Rainer Stiefelhagen, Marian Stewart Bartlett and Kevin Bowyer.                                 Instructions for obtaining the complete GBU distribution can be found at http://
 ⁎ Corresponding author. Tel.: + 1 301 975 5348; fax: + 1 301 9755348.                     face.nist.gov. Instructions for obtaining the LRPCA algorithm can be found at http://
    E-mail address: jonathon@nist.gov (P.J. Phillips).                                     www.cs.colostate.edu/facerec.

0262-8856/$ – see front matter. Published by Elsevier B.V.
doi:10.1016/j.imavis.2012.01.004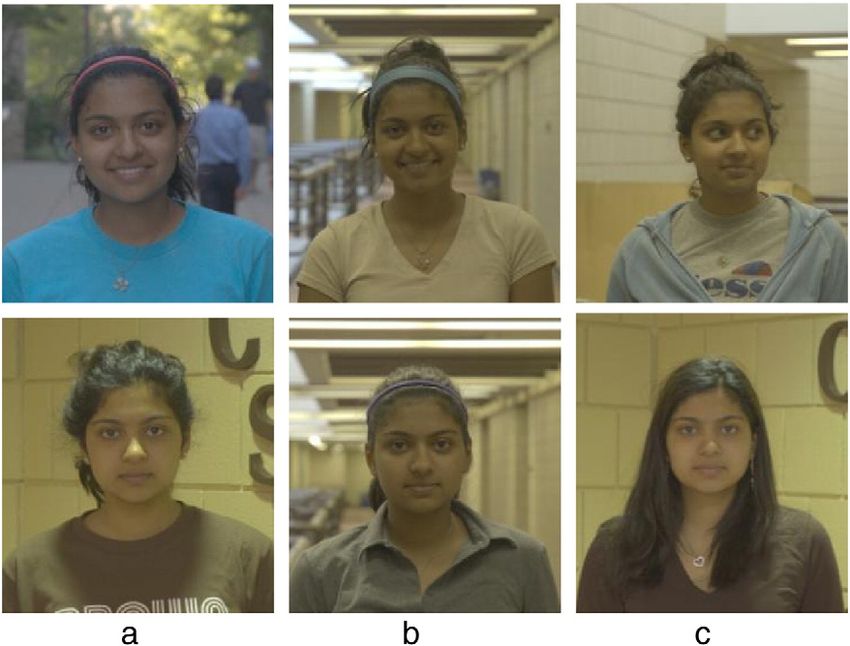
178                                              P.J. Phillips et al. / Image and Vision Computing 30 (2012) 177–185

    There are numerous sources of variation, known and unknown, in                       Distinct Images: An image can only be in one target or query set.
face images that can affect performance. Four of these factors were                      Balanced subject counts: The number of images per person is the
explicitly controlled for in the design of the GBU challenge problem:                    same in all target and query sets.
subject aging, pose, change in camera, and variations among faces.
                                                                                         Different days: The images in all match pairs were taken on differ-
The data collection protocol eliminated or significantly reduced the
                                                                                         ent days.
impact of three of these factors. Changes in the appearance of a face
due to aging is not a factor because all images were collected in the                    After applying these constraints, and given the total number of im-
same academic year (9 month time span). However, the data set con-                   ages available, the number of images per person in the target and
tains the natural variations in a person's appearance that would occur               query sets was selected to fall between 1 and 4. This number
over an academic year. Because all the images were collected by the                  depended upon the total availability of images for each person.
same model of camera, difference in performance cannot be attribut-                      The selection criteria for the partition results in the following
able to changes in the camera. Changes in pose are not a factor be-                  properties. An image is only in one partition. There are the same num-
cause the data set consists of frontal face images.                                  ber of match face pairs for each subject in each partition. There are the
    One potential source of variability in performance is that people                same number of non-match pairs between any two subjects in each
vary in their “recognizability.” To control for this source of variability,          partition. This implies that any difference in performance between
there are face images of each person in all three partitions. In addi-               the partitions is not a result of different people. The difference in per-
tion, each partition has the same number of images of each person.                   formance is a result of the different conditions under which the im-
Because the partition design controls for variation in the recognizabil-             ages were acquired. Figs. 1, 2, and 3, show examples of matching
ity of faces, differences in performance among the three partitions are              face pairs (mated vertically) from each of the partitions.
a result of how the faces are presented.                                                 The images included in the GBU target and query sets were decided
    The primary goal of the GBU face challenge problem is to focus at-               independently for each person. For each subject i, a subject-specific sim-
tention on the fundamental problem of comparing single frontal face                  ilarity matrix Si is extracted from a larger matrix containing similarity
images across changes in appearance. There are numerous applications                 scores from the FRVT2006 fusion algorithm. Each subject-specific ma-
that require matching single frontal images. Examples include recogni-               trix contained all similarity scores between pairs of images of subject
tion from face images on mug shots, passports, driver's licenses, and US             i. For the Good partition, a greedy selection algorithm iteratively
Government PIV Identity cards. Additionally, there are numerous com-                 added match face pairs for subject i that maximized the average similar-
mercial and academic organizations that have developing algorithms                   ity score for subject i; for the Ugly partition, match face pairs were se-
specifically for this application area. The structure of the GBU encour-              lected to minimize the average similarity score for subject i; and for
ages algorithm development in these application areas as well as sup-                the Bad partition, face pairs for subject i were selected to maintain an
ports both the development of new recognition algorithms and                         approximately average similarity score. The selection process for each
experiments to identify factors that affect performance.                             subject was repeated until the desired number of images were selected
                                                                                     for that subject. Since the images for each subject are selected indepen-
                                                                                     dently, the similarity score associated with a good face pair can vary
2. Generation of the Good, the Bad, and the Ugly partitions                          from subject to subject (similarly for the Bad and Ugly partitions).
                                                                                         Each of the GBU target and query sets contains 1085 images for 437
    The GBU partitions were constructed from the Notre Dame multi-                   distinct people. The distribution of image counts per person in the tar-
biometric data set used in the FRVT 2006 [4]. The images for the parti-              get and query sets are 117 subjects with 1 image, 122 subjects with 2
tions were selected from a superset of 9307 images of 570 subjects.                  images, 68 subjects with 3 images, and 130 subjects with 4 images. In
All the images in the superset are frontal still face images collected ei-           each partition there is 3297 match face pairs and 1,173,928 non-
ther outside or with ambient lighting in hallways. The images were ac-               match face pairs. In the GBU image set 58% of the subjects are male
quired with a 6 Mega-pixel Nikon D70 camera. All photos were taken in                and 42% female; 69% of the subjects are Caucasian, 22% east Asian, 4%
the 2004–2005 academic year (Aug 2004 through May 2005).                             Hispanic, and the remaining 5% other groups; and 94% of the subjects
    Each partition in the GBU is specified by two sets of images: a target            are between 18 and 30 years old with the remaining 6% over 30 years
set and a query set. For each partition, an algorithm computes a similar-            old. For the images in the GBU, the average distance between the cen-
ity score between all pairs of images in that partition's target and query           ters of the eyes is 175 pixels with a standard deviation of 36 pixels.
sets. A similarity score is a measure of the similarity between two faces.
Higher similarity scores imply greater likelihood that the face images
are of the same person. If an algorithm reports a distance measure,                  3. The FRVT 2006 fusion performance
then a smaller distance measure implies greater likelihood that the
face images are of the same person. Distances are converted to similar-                  Performance results for the GBU Challenge Problem are reported for
ity scores by multiplying by negative one. The set of all similarity scores          the GBU FRVT 2006 fusion algorithm, which is a fusion of three of the
between a target and a query set is called a similarity matrix. A pair of            top performers in the FRVT 2006. The algorithms were fused in a two-
face images of the same person is called a match pair, and a pair of                 step process. First, for each algorithm the median and the median abso-
face images of different people is called a non-match pair. From the sim-            lute deviation (MAD) were estimated from every 1 in 1023 similarity
ilarity matrix, receiver operating characteristics (ROC) and other mea-              scores (mediank and MADk are the median and MAD for algorithm k).
sures of performance can be computed.                                                The median and MAD were estimated from 1 in 1023 similarity scores
    To construct the GBU Challenge Problem we sought to specify target               to avoid over tuning the estimates to the data. The similarity scores
and query sets for each of the three partitions such that recognition dif-           were selected to evenly sample the images in the experiment.2 Second,
ficulty would vary markedly while at the same time factors such as the                the fused similarity scores are the sum of the individual algorithm sim-
individual people involved or number of images per person remained                   ilarity scores after the median has been subtracted and then divided by
the same. To gauge the relative difficulty associated with recognizing
                                                                                       2
a pair of images, similarity scores were created by fusing scores from                    The parameters for the fusion formula were computed from a subset of the similar-
three of the top performing algorithms in the FRVT 2006; this fusion                 ity scores rather than on the complete set of similarity scores. This was done with the
                                                                                     goal of generating a fusion formula that would generalize to additional faces or algo-
process is described more fully in the next section.                                 rithm data, rather than being overly tuned to this particular dataset. In the algorithm
    The following constraints were imposed when selecting the GBU                    evaluations carried out by NIST, the commonly applied procedure is to combine data
partitions:                                                                          with a method that has the ability to generalize.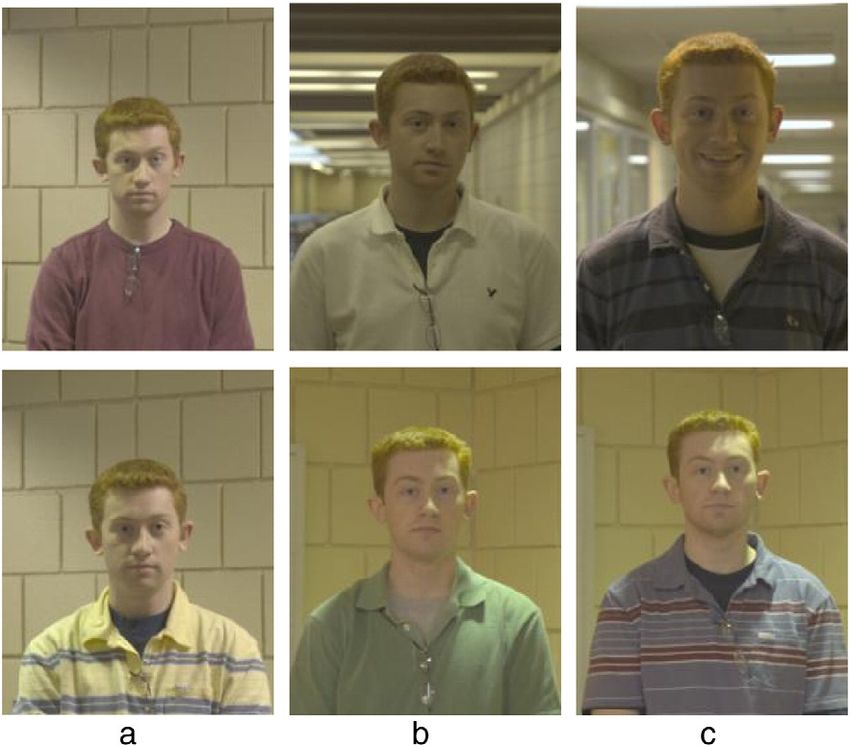
P.J. Phillips et al. / Image and Vision Computing 30 (2012) 177–185                                    179

                     Fig. 1. Examples of face pairs of the same person from each of the partitions: (a) good, (b) challenging, and (c) very challenging.

the MAD. If sk is a similarity score for algorithm k and sf is a fusion sim-             4. Protocol
ilarity score, then sf = ∑ k(sk − mediank)/MADk.
    Fig. 4 reports performance of the fusion algorithm on each of the                       The protocol for the GBU Challenge Problem is one-to-one matching
partitions. Fig. 5 shows the distribution of the match and non-                          with training, model selection, and tuning completed prior to comput-
matches for the fusion algorithm on all three partitions. The non-                       ing performance on the partitions. Consequently, under this protocol,
match distribution is stable across all three partitions. The match dis-                 the similarity score s(t, q) between a target image t and a query image
tribution shifts for each partition. The Good partition shows the great-                 q does not in any way depend on the other images in the target and
est difference between the median of the match and non-match                             query sets. Avoiding hidden interactions between images other than
distributions and the Ugly partition shows least difference.                             the two being compared at the moment provides the clearest picture

                     Fig. 2. Examples of face pairs of the same person from each of the partitions: (a) good, (b) challenging, and (c) very challenging.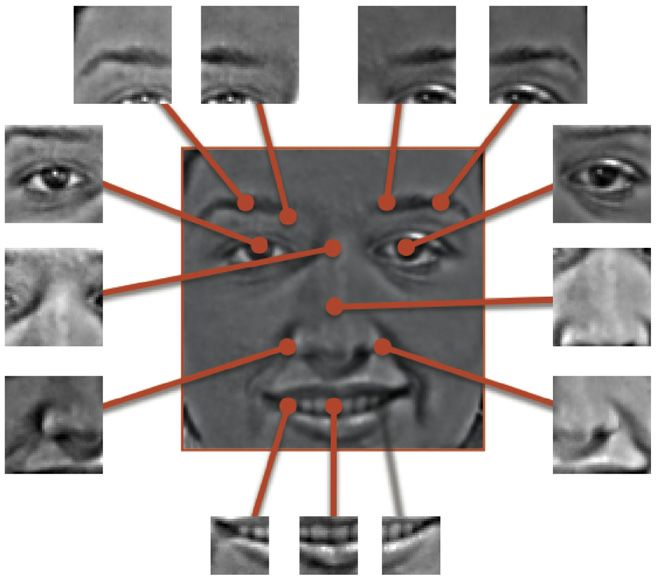
180                                                                         P.J. Phillips et al. / Image and Vision Computing 30 (2012) 177–185

                                           Fig. 3. Examples of face pairs of the same person from each of the partitions: (a) good, (b) challenging, and (c) very challenging.

of how algorithms perform. More formally, any approach that redefines                                            decomposition that produces a set of Eigenfaces. The benchmark al-
similarity s(t, q; T ) such that it depends upon the target (or query)                                          gorithm in Section 5 includes a training set that satisfies the training
image set T is NOT allowed in the GBU Challenge Problem.                                                        protocol.
    To maintain separation of training and test sets, an algorithm can-                                             A second example is taken from a common training procedure for
not be trained on images of any of the subjects in the GBU Challenge                                            linear discriminant analysis (LDA) in which the algorithm is trained
Problem. It is important to note that there are images of the subjects                                          on the images in a target set. Generally, it is well known that the per-
in the GBU problem that are in the FRGC and the MBGC data sets.                                                 formance of algorithms can improve with such training, but the
These images must be excluded from model selection, training, or                                                resulting levels of performance typically do not generalize. For exam-
tuning of an algorithm.                                                                                         ple, we've conducted experiments with an LDA algorithm trained on
    We illustrate acceptable and unacceptable training protocols with                                           the GBU target images and performance improved over the baseline
three examples. The first example is the training of a principal com-                                            algorithm presented, see Section fsec:Benchmark Algorithm. Howev-
ponents analysis (PCA) based face-recognition algorithm. In the algo-                                           er, when we trained our LDA algorithm following the GBU protocol,
rithm, PCA is performed on a training set to produce a set of                                                   performance did not match the LDA algorithm trained on a GBU tar-
Eigenfaces. A face is represented by projecting a face image on the                                             get set.
set of Eigenfaces. To meet the training requirements of the protocol,                                               The GBU protocol does permit image specific representations as
images of subjects in the GBU must be excluded from the PCA                                                     long as the representation does not depend on other images of
                                                                                                                other subjects in the GBU Challenge Problem. An example is an algo-
                                                                                                                rithm based on person-specific PCA representations. In this example,
                             1.0

                                      0.98                                                                      during the geometric normalization process, 20 slightly different nor-
                                                                                                                malized versions of the original face would be created. A person-
                                                                                                                specific PCA representation is generated from the set of 20 normal-
                             0.8

                                      0.80                                                                      ized face images. This method conforms with the GBU training proto-
                                                                                                                col because the 20 face images and the person specific PCA
                                                                                                                representation are functions of the original single face image. When
         Verification rate
                             0.6

                                                                                                                there are multiple images of a person in a target or query set, this ap-
                                                                                                                proach will generate multiple image-specific representations. This
                                                                                                                training procedure does not introduce any dependence upon other
                             0.4

                                                                                                                images in the target set and consequently is permitted by the GBU
                                                                                                                protocol.
                             0.2

                                      0.15                                                                      5. Baseline algorithm
                                                                                         Good
                                                                                         Bad
                                                                                         Ugly                      The GBU Challenge Problem includes a baseline face recognition
                             0.0

                                                                                                                algorithm as an entry point for researchers. The baseline serves two
                                   0.001              0.01               0.1                 1.0
                                                                                                                purposes. First, it provides a working example of how to carry out
                                                        False accept rate
                                                                                                                the GBU experiments following the protocol. This includes training,
Fig. 4. ROC for the Fusion algorithm on the Good, the Bad, and the Ugly partitions. The
                                                                                                                testing and evaluation using ROC analysis. Second, it provides a per-
verification rate for each partition at a FAR of 0.001 is highlighted by the vertical line at                    formance standard for algorithms applied to the GBU Challenge
FAR = 0.001.                                                                                                    Problem.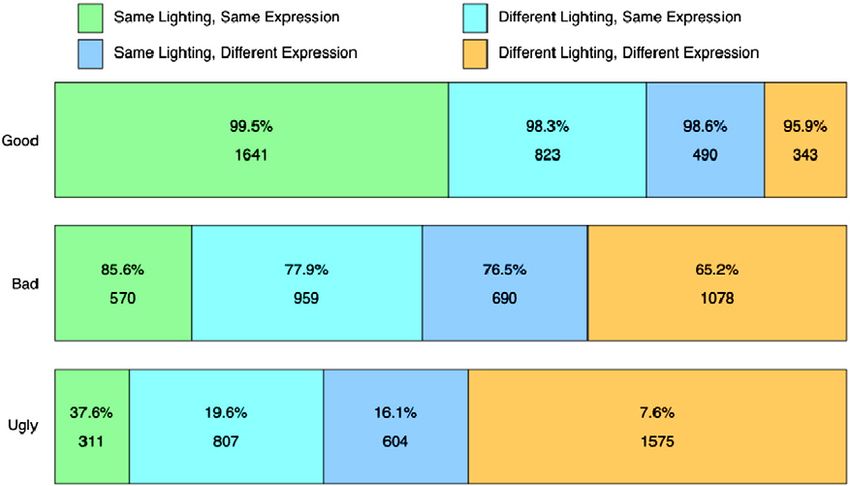
P.J. Phillips et al. / Image and Vision Computing 30 (2012) 177–185                                                    181

                                      Good                                               Bad                                                   Ugly

                    Less
       Similarity
                    More

                            Match            Nonmatch                     Match                   Nonmatch                      Match                 Nonmatch

                      0.1       0.0     0.1         0.2      0.3   0.1         0.0          0.1          0.2        0.3   0.1           0.0      0.1         0.2         0.3

Fig. 5. Histogram of the match and non-match distributions for the Good, the Bad, and the Ugly partitions. The green bars represent the match distribution and the yellow bars
represent the non-match distribution. The horizontal axes indicate relative frequency of similarity scores.

    The architecture of the baseline algorithm is a refined implemen-                           pixel values in each region are further adjusted to have a sample
tation of the standard PCA-based face recognition algorithm, also                              mean of zero and a sample standard deviation of one.
known as Eigenfaces [7,8]. These refinements considerably improve                                   During training, 14 distinct PCA subspaces are constructed, one for
performance over a standard PCA-based implementation. The refine-                               each of the face regions. From each PCA decomposition, the 3rd
ments include representing a face by local regions, a self quotient nor-                       through 252th eigenvectors are retained to represent the face. The
malization step, and weighting eigenfeatures based on Fischer's                                decision to use these eigenvectors was based upon experiments on
criterion. We refer to the GBU baseline algorithm as local region                              images similar to the images in the GBU Challenge Problem. A region
PCA (LRPCA).                                                                                   in a face is encoded by the 250 coefficients computed by projecting
    It may come as a surprise to many in the face recognition commu-                           the region onto the region's 250 eigenvectors. A face is encoded by
nity that a PCA-based algorithm was selected for the GBU benchmark                             concatenating the 250 coefficients for each of the 14 regions into a
algorithm. However, when developing the LRPCA baseline algorithm,                              new vector of length 3500.
we explored numerous standard alternatives, including LDA-based                                    Each dimension in the PCA subspace is further scaled. First, the
algorithms and algorithms combining Gabor based features with ker-                             representation is whitened by scaling each dimension to have a sam-
nel methods and support vector machines. For performance across                                ple standard deviation of one on the training set. Next, the weight on
the full range of the GBU Challenge Problem, our experiments with al-                          each dimension is further adjusted based on Fisher's criterion, which
ternative architectures have not resulted in overall performance bet-                          is the ratio of the between class variance and the within class variance
ter than the LRPCA baseline algorithm. 3                                                       (σb2/σw2
                                                                                                        ). This weight is computed based on the images in the training
                                                                                               set emphasizes the dimensions along which images of different peo-
5.1. A step-by-step algorithm description                                                      ple are spread apart and attenuates the dimensions along which the
                                                                                               average distance between images of the same person and images of
    The algorithm's first step is to extract a cropped and                                      different people are roughly the same.
geometrically-normalized face region from an original face image.                                  During the recognition process, images are first processed as de-
The original image was assumed to be a still image and the pose of                             scribed above and then projected into the 14 distinct PCA subspaces
the face is close to frontal. The face region in the original is scaled, ro-                   associated with each of the 14 regions. The coordinates of images
tated, and cropped to a specified size and the centers of the eyes are
horizontally aligned and placed on standard pixel locations. Scaling,
rotating, and cropping of the face is based on the centers of the eyes
which were manually located. 4 In the baseline algorithm, the face
chip is 128 by 128 pixels with the centers of the eyes spaced 64 pixels
apart. The baseline algorithm runs in two modes: partially and fully
automatic. In the partially automatic mode the coordinates of the cen-
ters of the eyes are provided; in the fully automatic mode, the centers
of the eyes are located by the baseline algorithm.
    In the LRPCA algorithm, the PCA representation is based on 14
local regions. The 14 regions include the complete face chip. The 14
local regions are cropped out of a normalized face image. Some of
the local regions overlap, see Fig. 6. The local regions are centered rel-
ative to the average location of the eyes, eyebrows, nose and mouth.
    The next step normalizes the 14 face regions to attenuate variation
in illumination. First, self quotient normalization is independently ap-
plied to each of the 14 regions [9]. The self quotient normalization
procedure first smoothes each region by convolving it with a two-
dimensional Gaussian kernel and then divides the original region by
the smoothed region, see Fig. 7. In the final normalization step, the

  3
    This statement was accurate for the original submission to the IEEE Ninth Interna-
tional Conference on Automatic Face and Gesture Recognition 2011.                              Fig. 6. This figure shows the 14 local regions in the LRPCA algorithm. The fourteen re-
  4
    The coordinates of the manually located centers of the eyes are made available to          gions include the cropped face. The crop face has been geometrically normalized and
researchers.                                                                                   the self quotient procedure performed.
182 P.J. Phillips et al. / Image and Vision Computing 30 (2012) 177–185
Table 1
Performance of the Fusion, the LRPCA-face baseline, and the LRPCA-ocular baseline al-
gorithms. For the ocular baseline, performance is given for both the left and the right
ocular regions. The verification rates at a FAR = 0.001 are given.
Partition Fusion LRPCA- LRPCA-ocular
face
Left Right
Fig. 7. This figure illustrates the computation of a self-quotient face image. The face Good 0.98 0.64 0.47 0.46
image to the left is a cropped and geometrically normalized image. The image in the Bad 0.80 0.24 0.16 0.17
middle is the geometrically normalized image blurred by a Gaussian kernel. The Ugly 0.15 0.07 0.05 0.05
image on the left is a self-quotient image. This image is obtained by pixel-wise division
of the normalized image by the blurred image.
6.1. Limits of expression and lighting effects
projected into these spaces, 250 for each of the 14 regions, are then
concatenated into a single feature vector representing the appearance A common assumption in the face recognition community is that the
of that face. This produces one vector per face image; each vector con- primary factors affecting performance are aging, pose, illumination and
tains 3500 values. The baseline algorithm measures similarity be- expression (A-PIE). Here we show that this assumption does not apply
tween pairs of faces by computing the Pearson's correlation to the GBU. Aging, which refers to the elapsed time between two face
coefficient between pairs of these vectors. The performance of the images of a person, is not a factor because all the images in the GBU
baseline algorithm on the GBU Challenge Problem is summarized in were collected with a nine month time span. Additionally, all images
Fig. 8. A comparison of performance of the Fusion and the LRPCA- in the GBU nominally have a frontal pose and therefore it is assumed
baseline algorithm is given in Table 1. pose is not a factor. There are a few images in the GBU that are clearly
A recent area of interest in face recognition and biometrics is rec- not frontal, but the number is sufficiently small that it does not account
ognition from the ocular region of the face. There is interest in recog- for the difference in performance among the three partitions.
nition from both near infrared and visible imagery. The region-based Of the four A-PIE factors, the GBU contains significant variations in
design of the LRPCA algorithm allows for baselining ocular perfor- illumination and expression. Both these factors can have a significant
mance on the GBU partitions. Baseline performance for the left ocular impact on performance.
is computed from three of the 14 regions. The regions are the left eye In a meta-analysis on the effect of covariates on face recognition
and two left eye brow regions. For the right ocular region, perfor- performance, changes in expressions were identified as a factor that
mance is computed from the right eye and two right eye brow re- consistently impacted performance [10]. For expression, the data col-
gions. Here left and right are defined in respect to the subject where lection protocol requested that subjects present neutral and smiling
the left ocular region corresponds to a subject left eye. Performance expressions. Face image pairs are categorized as having the same ex-
for the LRPCA-ocular baseline for the left and right ocular regions is pression when the two images are labeled smiling or two images are
given in Fig. 9. labeled neutral. Similarly, pairs labeled as different expressions when
A summary of performance of the Fusion, the LRPCA-face baseline one image is labeled smiling and the other is labeled neutral.
and the LRPCA-ocular baseline algorithms are given in Table 1. Lighting is one factor affecting face recognition performance and has
been extensively studied [11]. According to the spherical harmonic theory
[12], 99% of the reflected energy can be captured by the first nine spher-
6. Analysis ical harmonics. An image can therefore be relighted based on a set of
lighting images. Sim and Kanade [13] applied a Bayesian model and a ker-
The goals of the GBU includes understanding the properties of face nel regression technique to synthesize new images for different illumina-
recognition algorithms. One aspect is understanding and characteriz- tions. This work was extended to estimate the illumination directions in
ing the factors that affect performance. facial imagery [14]. The output of this analysis was the dominant lighting
direction. For this study, lighting direction was estimate by the method of
Beveridge et al. [14]. The lighting direction was quantized to frontal, right,
left or from behind. For the analysis in this section, a pair of face images
1.0
has the same lighting if both images had the same lighting direction; oth-
erwise, the face pair had different lighting.
To assess the impact of change in expression and lighting direc-
0.8
tion, all match face pairs are given one of labels: 1) same lighting,
same expression; 2) same lighting, different expression; 3) different
lighting, same expression; and 4) different lighting, different expres-
Verification rate
0.64
0.6
sion. Fig. 10 summarizes the results of this analysis. In Fig. 10 there is
a bar for each partition, and each bar consists of four color coded rect-
angles. Each of the rectangles corresponds to one of the four labels re-
0.4
garding the status of change in expression and lighting direction. The
length of the rectangles is proportional to the number match face
pairs with the corresponding label. For the Good partition, there are
0.24
0.2
1641 face pairs with the same lighting and same expression, 343
Good face pairs with different lighting and different expression. Also
0.07 Bad reported for each change in expression and lighting condition, is the
Ugly
0.0
verification rate at aFAR of 1/1000. The easiest case is the same light-
0.001 0.01 0.1 1.0 ing and same expression for the Good partition with a verification
rate of 99.5%. The most difficult case is different lighting and different
False accept rate
expression for the Ugly partition with a verification rate of 7.6%.
Fig. 8. ROC for the LRPCA baseline algorithm on the GBU partitions. The verification rate The Good partition contained the most number of same lighting,
for each partition at a FAR of 0.001 is highlighted by the vertical line at FAR = 0.001. same expression match face pairs, followed by the Bad and then theP.J. Phillips et al. / Image and Vision Computing 30 (2012) 177–185 183
a b
1.0
1.0
0.8
0.8
Verification rate
Verification rate
0.6
0.6
0.47 0.46
0.4
0.4
0.2
0.2
0.16 0.17
Good Good
Bad Bad
0.05 0.05
Ugly Ugly
0.0
0.0
0.001 0.01 0.1 1.0 0.001 0.01 0.1 1.0
False accept rate False accept rate
Fig. 9. ROC for the LRPCA-ocular baseline algorithm on the Good, the Bad, and the Ugly partitions. In (a) performance is for the left ocular region that consists of the left eye and two left
eye-brow regions; performance in (b) is for corresponding right ocular regions. The verification rate for each partition at a FAR of 0.001 is highlighted by the vertical lines at FAR= 0.001.
Ugly partitions. Similarly, the Ugly partition contained the most num- Characterizing the ease or difficulty of recognizing a person from their
ber of different lighting, different expression match pairs, followed by face, or more generally from any biometric, is referred to as the biometric
the Bad and then the Good partitions. zoo problem. Zoo analysis falls into two basic classes. The first looks at the
For the Good partition, the verification rate at a FAR of 1/1000 for all “most” and “least” difficult to recognize faces–the extremes of the distri-
four cases is better than all cases in the Bad partition. Similarly, perfor- bution [15–17]. The second looks at the relative ranks of all the faces in
mance on all cases for the Bad partition is better than all cases on the a data set [18,19]. We chose to follow the second method.
Ugly partition. If changes in lighting or expression were the source of a Our analysis is based on two measures of face difficulty. The first is the
large percentage of the difference in performance among the three parti- median match score of a subject. The second is the median non-match
tions, then there would not be the observed stratification of performance. scores of a subject. The degree of consistency in recognizability of the
The results in this section suggest that there exist other factors faces in the GBU among the partitions is measured by Spearman's corre-
that significantly affect performance. Currently these factors have lation coefficient.
not been identified and the GBU challenge problem provides a basis For a partition, the median match score for subject k is the median
for identifying these factors. of all the match similarity scores where both the target and query are
images of subject k. Likewise, the median non-match score for subject
6.2. Zoo analysis k is median of all non-match similarity scores where either the target
or query image is an image of subject k.
One of the open questions in face recognition is “are some faces harder Fig. 11 plots the correlation between the median subject match and
or easier to recognize than other faces?” This question implicitly implies non-match scores among the three partitions. Table 2 reports Spear-
that faces are ordered from hardest to easiest to recognize. If there is an man's correlation coefficient corresponding to the scatterplots in Fig. 11.
ordering to the recognizability of faces, then the order should be stable For the median match scores, correlation varies from 0.32 to 0.46.
over imaging conditions. Because there are the same number of images This shows some degree of similarity in the relative ranking among
of each person in each the GBU partitions, the GBU is amenable to exam- the partitions for the median match scores. For the median non-
ining the relative difficulty of faces across imaging conditions. match scores, correlation varies from 0.03 to 0.38. The 0.03 coefficient
Fig. 10. Effect of expression and lighting over the GBU partitions. Each bin shows the verification rate at 1/1000 FAR and the total number of match pairs.184 P.J. Phillips et al. / Image and Vision Computing 30 (2012) 177–185
a Match scores NonMatch scores development of robust algorithms for recognizing frontal faces
taken outside of studio style image collections. The three partitions
in the GBU Challenge Problem emphasize the range of performance
0
Bad subject median
Bad subject median
that is possible when comparing faces photographed under these
1.0
−10
conditions. This structure allows for researchers to concentrate on
the “hard” aspects of the problem while not compromising perfor-
mance on the “easier” aspects.
0.5
−30
Partitioning the challenge by levels of difficulty is the most prom-
inent feature of the GBU Challenge Problem design. Another is con-
0.0
trolling for the “recognizability” of people by selecting images of the
−50
same 437 people for inclusion in each of the GBU partitions. The
−50 −40 −30 −20 −10 0 0.0 0.5 1.0 data in the three partitions is further balanced so as to ensure that
Good subject median Good subject median for each person the number of target and query images in each parti-
tion is the same. The design of the GBU Challenge Problem means that
b Match scores NonMatch scores
any difference in performance observed between partitions cannot be
attributed to differences between people or numbers of images for in-
0
Ugly subject median
Ugly subject median
dividual people.
1.0
−10
The unique design of the GBU Challenge Problem allows re-
searchers to investigate factors that influence the performance of al-
gorithms. O'Toole et al. [20,21] looked at the demographic effects on
0.5
−30
the nonmatch distribution. Beveridge et al. [22] showed that the qual-
ity of face images comes in pairs. Quality comes in pairs was shown by
0.0
the existence of contrary face image: images that have a contrary na-
−50
ture because they simultaneously have high and low quality. Addi-
−50 −40 −30 −20 −10 0 0.0 0.5 1.0 tional possible lines of investigation include understanding the
Bad subject median Bad subject median factors that characterize the difference in match face pairs across
Match scores NonMatch scores the partitions. Our results show that changes in expression and light-
c ing direction do not characterize the majority of the variation across
the partitions. A second line of research is characterizing the recog-
0
Ugly subject median
Ugly subject median
nizability of a face; e.g., the biometric zoo. Our zoo experiments sug-
1.0
−10
gest that recognizability is not stable across the partitions. A third line
of research is developing methods for predicting performance of face
recognition algorithms. The design of the GBU Challenge Problem en-
0.5
−30
courages both the development of algorithms and the investigation of
methods for understanding algorithm performance.
0.0
−50
−50 −40 −30 −20 −10 0 0.0 0.5 1.0 Acknowledgments
Good subject median Good subject median
The authors wish to thank the Federal Bureau of Investigation (FBI)
Fig. 11. Scatterplots of median subject match scores and median subject non-match and the Technical Support Working Group (TSWG) for their support of
scores. Each dot corresponds to a subject. The blue vertical line marks the median subject this work. The identification of any commercial product or trade name
match (non-match) scores for the horizontal axis. The red horizontal line marks the me- does not imply endorsement or recommendation by the Colorado
dian subject match (non-match) scores for the vertical axis. (a) Compares median subject
State University, the National Institute of Standards and Technology or
match and non-match between the Good and Bad partitions; (b) compares median sub-
ject match and non-match between the Bad and Ugly partitions; and (c) compares median the University of Texas at Dallas. The authors thank Jay Scallan for his
subject match and non-match between the Good and Ugly partitions. assistance in preparing the GBU challenge problem.
is between the Good and Ugly partitions, which is essentially random.
References
The median non-match scores affects the ability of a person to be con-
sistently impersonated. This result suggests that the ease with which [1] P.J. Phillips, H. Wechsler, J. Huang, P. Rauss, The FERET database and evaluation pro-
a person can be impersonated varies with image acquisition condi- cedure for face-recognition algorithms, Image Vision Comput. J. 16 (1998) 295–306.
[2] P.J. Phillips, H. Moon, S. Rizvi, P. Rauss, The FERET evaluation methodology for face-
tions. In addition, the result suggests that for non-matches a zoo recognition algorithms, IEEE Trans. Pattern Anal. Mach. Intell. 22 (2000) 1090–1104.
structure does not exist across changes in imaging conditions. [3] P.J. Phillips, P.J. Flynn, T. Scruggs, K.W. Bowyer, J. Chang, K. Hoffman, J. Marques, J.
Min, W. Worek, Overview of the face recognition grand challenge, IEEE Computer
Society Conference on Computer Vision and Pattern Recognition, 2005, pp. 947–954.
7. Discussion and conclusion [4] P.J. Phillips, W.T. Scruggs, A.J. O'Toole, P.J. Flynn, K.W. Bowyer, C.L. Schott, M.
Sharpe, FRVT 2006 and ICE 2006 large-scale results, IEEE Trans. Pattern Anal.
Mach. Intell. 32 (2010) 831–846.
This paper introduces the Good, the Bad, and the Ugly Challenge [5] P.J. Phillips, P.J. Flynn, J.R. Beveridge, W.T. Scruggs, A.J. O'Toole, D. Bolme, K.W.
Problem. The main goal of the challenge is to encourage the Bowyer, B.A. Draper, G.H. Givens, Y.M. Lui, H. Sahibzada, J.A. Scallan III, S.
Weimer, Overview of the Multiple Biometrics Grand Challenge, Proceedings
Third IAPR International Conference on Biometrics, 2009.
Table 2 [6] P.J. Grother, G.W. Quinn, P.J. Phillips, MBE 2010: Report on the evaluation of 2D
Spearman's correlation coefficients for zoo analysis. still-image face recognition algorithms, NISTIR 7709, National Institute of Stan-
dards and Technology, 2010.
Median match scores Median non-match scores [7] M. Turk, A. Pentland, Eigenfaces for recognition, J. Cogn. Neurosci. 3 (1991) 71–86.
Good–Bad 0.39 0.38 [8] M. Kirby, L. Sirovich, Application of the Karhunen–Loeve procedure for the charac-
Bad–Ugly 0.46 0.11 terization of human faces, IEEE Trans. Pattern Anal. Mach. Intell. 12 (1990) 103–108.
[9] H. Wang, S. Li, Y. Wang, J. Zhang, Self quotient image for face recognition, Proceed-
Good–Ugly 0.32 0.03
ings, International Conference on Image Processing, volume 2, 2004, pp. 1397–1400.P.J. Phillips et al. / Image and Vision Computing 30 (2012) 177–185 185
[10] Y.M. Lui, D. Bolme, B.A. Draper, J.R. Beveridge, G. Givens, P.J. Phillips, A meta- [17] M.N. Teli, J.R. Beveridge, P.J. Phillips, G.H. Givens, D.S. Bolme, B.A. Draper, Biomet-
analysis of face recognition covariates, IEEE 3rd International Conference on Bio- ric zoos: theory and experimental evidence, International Joint Conference on
metrics: Theory, Applications, and Systems, Washington, DC, 2009. Biometrics, 2011.
[11] X. Zou, J. Kittler, K. Messer, Illumination invariant face recognition: A survey, IEEE [18] N. Poh, S. Bengio, A. Ross, Revisiting Doddington's zoo: a systematic method to as-
International Conference on Biometrics: Theory, Applications, and Systems, 2007. sess user-dependent variabilities, Proc. of Second Workshop on Multimodal User
[12] R. Basri, D. Jacobs, Lambertian reflectance and linear subspaces, IEEE Trans. Pat- Authentication (MMUA), 2006.
tern Anal. Mach. Intell. 25 (2003) 218–233. [19] A. Ross, A. Rattani, M. Tistarelli, Exploiting the “Doddington zoo” effect in biomet-
[13] T. Sim, T. Kanade, Combining models and exemplars for face recognition: an illu- ric fusion, IEEE 3rd International Conference on Biometrics: Theory, Applications,
minating example, CVPR Workshop on Models versus Exemplars in Computer Vi- and Systems, 2009.
sion, 2001. [20] A.J. O'Toole, P.J. Phillips, X. An, J. Dunlop, Demographic effects on estimates of au-
[14] J.R. Beveridge, D.S. Bolme, B.A. Draper, G.H. Givens, Y.M. Lui, P.J. Phillips, Quantifying tomatic face recognition performance, Proceedings, Ninth International Confer-
how lighting and focus affect face recognition performance, Proceedings IEEE Com- ence on Automatic Face and Gesture Recognition, 2011.
puter Society and IEEE Biometrics Council Workshop on Biometrics, 2010. [21] A.J. O'Toole, P.J. Phillips, X. An, J. Dunlop, Demographic effects on estimates of au-
[15] G. Doddington, W. Ligget, A. Martin, M. Przybocki, D. Reynolds, Sheeps, goats, tomatic face recognition performance, Image and Vision Computing Journal (this
lambs, and wolves: a statistical analysis of speaker performance in the NIST issue).
1998 recognition evaluation, Proceedings ICSLP '98, 1998. [22] J.R. Beveridge, P.J. Phillips, G.H. Givens, B.A. Draper, M.N. Teli, D.S. Bolme, When
[16] N. Yager, T. Dunstone, The biometric menagerie, IEEE Trans. Pattern Anal. Mach. high-quality face images match poorly, Proceedings, Ninth International Confer-
Intell. 32 (2010) 220–230. ence on Automatic Face and Gesture Recognition, 2011.You can also read