TV Performance Report - H1 2019 - TVision Insights

Page created by Jaime Lloyd
 
CONTINUE READING
TV Performance Report - H1 2019 - TVision Insights
TV Performance Report
H1 2019
TV Performance Report - H1 2019 - TVision Insights
Table of Contents

Foreword............................................................................................................................................................................   01
TV Performance Metrics................................................................................................................................................. 02
The Variance of TV Viewability...................................................................................................................................... 03
Demographic Breakouts................................................................................................................................................ 04
Second-by-Second Spotlight: McDonald’s & Uber Eats........................................................................................ 05
Late-Night Ad Performance........................................................................................................................................... 07
Awards Ad Performance................................................................................................................................................ 09
Triple Crown Ad Performance....................................................................................................................................... 10
Sports Ad Performance..................................................................................................................................................                11
Second-by-Second Spotlight: 2019 Democratic Debates......................................................................................                                              13
Best Primetime Broadcast & Cable Programs, Ranked by Ad Viewability & Ad Attention........................... 15
Most Efficient Brand Performance, Ranked by Ad Viewability & Ad Attention................................................                                                              17
Most Breakthrough Ad Performance, Ranked by Creative Attention Score..................................................... 19
Second-by-Second Spotlight: Volvo............................................................................................................................. 21
Vertical Leaders, by TV Viewability.............................................................................................................................. 23
TVision Innovation in H2 2019...................................................................................................................................... 27
Methodology & Metrics................................................................................................................................................... 30
TV Performance Report - H1 2019 - TVision Insights
FOREWARD: DAVID COHEN

All Impressions Are Not Created Equal.

It is an awfully exciting time to be in the media business. Never        a similar way to digital video. It allows us to plan better, optimize
before have we had more data, tools and technology to extract            better and extract the greatest value from our investment. It will
the greatest value from our marketing and media investments.             also provide a solid foundation for the duration-weighted currency
Never before have we been able to gain deep insights into why            that the industry is moving towards.
our plans are performing the way that they do. As they say in the
movies, “with great power comes great responsibility.” And with          In this report you will get a taste of what is possible with TVision
that context I am excited to introduce the latest TV Performance         data. From specific case studies, to insights by vertical category
Report from TVision.                                                     and understanding what it takes for creative to breakthrough,
                                                                         hopefully it will pique your curiosity. Think about how this data
Media planning is ultimately about understanding trade-offs. “If         could be put to use on your campaigns – from planning to buying
I do more of this, and less of that” what is the predicted impact        to in-market optimization.
on the business? Understanding trade-offs requires a similar
foundation upon which our plans are developed. We need to think          Finally, at the end of the report you will be introduced to two new
about television, digital, radio, OOH and print in a similar way. That   products that I have been able to preview. TVision Streaming
foundation or building block has been impressions, or GRPs for           Analytics will provide a person-level view into OTT Viewability
decades.                                                                 and Attention across devices and applications which has been
                                                                         nearly impossible to measure to date. As OTT continues to scale,
As we know, all impressions are not created equal. All                   understanding consumption in this area will be an imperative for
impressions are not necessarily viewed by human beings that              modern marketers. Additionally, TVision Audiences is a first-of-its
are attentive, receptive and ready to buy your product or service.       kind dataset that empowers brands to digitally reach consumers
In fact, one could argue in today’s complex media environment,           based on their engagement with TV content. The use cases are
genuine human attention is our most precious commodity.                  endless, and will undoubtedly illuminate new opportunities for
                                                                         your brands.
This is why I am so excited about the value that TVision is bringing
to the market. Understanding TV Viewability and Attention allows         As I said upfront, it is an exciting time to be in the media business.
us to move beyond the “opportunity to see” and understand
who is actually seeing our ads in market. It gives us a second-by-       Enjoy!
second view and allows us to look at our television investments in                                                            - DAVID COHEN

David Cohen led MAGNA’s North America business from 2016 to 2019 - driving investment,
intelligence and innovation in his role as President. David also led Global Partnerships for MAGNA and
has helped set the overall vision and remit for the organization.

David is innately driven to push boundaries and challenge the status quo, having served as the Chair of
the 4A’s (American Association of Advertising Agencies) Digital Marketing Committee from 2009-2012,
as well as on advisory boards for the IAB, Google, Facebook, and Snapchat. He currently provides his
industry expertise as an advisor to TVision.

                                                                                                          TV Performance Report H1 2019      01
TV Performance Report - H1 2019 - TVision Insights
METHODOLOGY

TV Performance Metrics

              Ad Viewability (%):
              This metric measures how effectively viewers are kept in the room while ads are on-screen. It is measured as the
              percentage of all ad impressions in which a viewer was in the room for two or more seconds.

              Ad Attention (%):
              This metric measures how effectively an ad or ads held viewers’ attention while they aired. It is measured as the
              percentage of all ad impressions in which the viewer was looking at the TV screen for two or more seconds.

              Creative Attention Score (CAS):
              This metric measures an ad’s ability to grab the audience’s attention, as compared to surrounding ad content.
              CAS measures the percentage of an ad’s aggregate run time that viewers spent with their eyes on the screen, as
              indexed against the other ads that ran in the same ad pod.

Understanding the Differences Between
TV & Digital Viewability

                TV Viewability:                                            Digital Viewability:
     Is the PERSON in front of the screen?                             Is the AD on the screen?

                                                                                               TV Performance Report H1 2019      02
TV Performance Report - H1 2019 - TVision Insights
PERFORMANCE METRICS

The Variance of TV Viewability
While it’s true that, on average, 29% of all TV ads air without anyone in the room, TV Viewability varies a great deal for each advertiser
based on a number of factors, including the brand’s channel, daypart, and program mix, as well as the brand’s industry. By analyzing five
specific brands — from the Auto, CPG, Finance, Insurance, and Healthcare industries — we can get a better sense of how many brand
advertisers perform in different environments.

There is a wide variance in TV Viewability when it comes to media planning components. For example, there is a wide range among
channels, with TV Viewability as low as 57.0% and as high as 81.0%. The range was even wider when it came to programs and
dayparts. At the brand level, specific brands analyzed in the Healthcare and Insurance categories had the highest TV Viewability rates -
at 78.6% and 75.0%, respectively - topping the cross-industry average of 71.0%.

To go deeper into the many factors that impact TV Viewability, see the full multi-brand report at T.Vision/variance.

TV Viewability Varies by Many Factors

Channel                                                       57%                               81%

Daypart                                                     56%                                                    93%

Program                                   46%                                                                          95%

           30%                40%             50%              60%              70%              80%               90%             100%

Brand Variance of TV Viewability

  100%
                                                                                                    78.6%                75.0%
   75%               71.0%               67.0%              66.4%
                                                                                58.7%
   50%

   25%

                   Industry             Auto                 CPG              Finance            Healthcare            Insurance
                   Average              Brand               Brand              Brand               Brand                 Brand

                                                                                                        TV Performance Report H1 2019     03
TV Performance Report - H1 2019 - TVision Insights
DEMOGRAPHIC BREAKOUTS

TV Ad Performance by Gender & Age
TV watching varies across gender and age demographics. And while Viewability and Attention gaps between men and women are
negligible, the first half of 2019 saw more pronounced differences in engagement across age groups.

TV Viewability rates were highest among viewers aged 65 and older, with each younger age group being successively less likely to
be in the room during an ad break. There was also a general trend of older viewers paying more attention than younger viewers, but
viewers 55-65 wound up being a more attentive audience than their more senior counterparts. Viewers 18 and under were the least
attentive group, paying Attention to just 33.0% of the TV ads they were served.

                                          Ad Viewability                                                 Ad Attention

Men                                             72.1%                                          40.8%

Women                                         70.6%                                            39.5%

Under 18                                60.7%                                                33.0%

A18-24                                      66.7%                                             36.7%

A25-34                                      67.8%                                              38.6%

A35-45                                       68.0%                                             37.3%

A45-55                                          71.7%                                          40.0%

A55-65                                          73.9%                                            43.6%

A65+                                             75.8%                                          42.2%

                                                                                                   TV Performance Report H1 2019     04
TV Performance Report - H1 2019 - TVision Insights
BRAND SPOTLIGHT

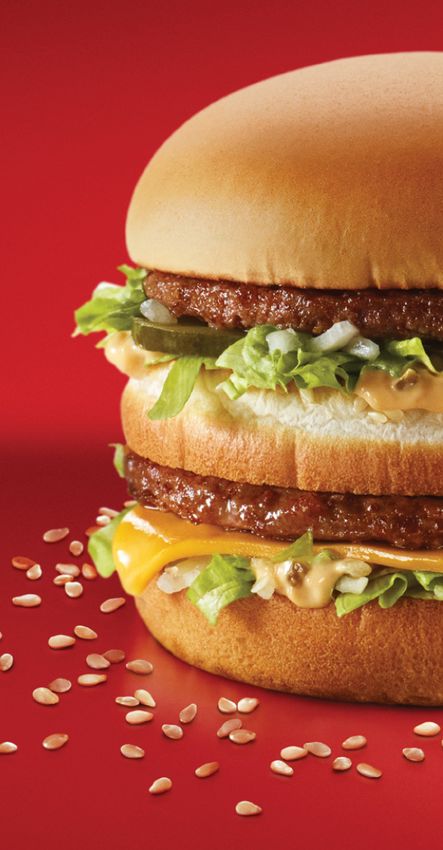
How McDonald’s & Uber Eats
Delivered Engaging Advertising
TVision’s person-level, second-by-second Attention measurement allows advertisers to understand how viewers are engaging with any
TV ad and which creative elements are driving that engagement.

A recent McDonald’s ad featuring Uber Eats saw viewers under 18 and over 55 pay high levels of Attention throughout. This success
may be attributable to the fast-food chain’s enduring appeal with teens and seniors, or to the fact that these demographics are less likely
to drive and thus more likely to order delivery.

During the ad, there was a noticeable Attention spike among all age groups around the 7-second mark, during a montage of excited
customers opening the door to receive their delivery. Another spike at the 12-second mark occurs during a close-up of two delivery
bags bearing both the McDonald’s and Uber Eats logos. Given the importance of brand recall for TV advertising, it’s crucial for marketers
to monitor how attentive their audiences are when their branding is featured on-screen.

                                                                                                                                              0:10
                                  0:02                                                          0:07
                                                                                                                                              Grocery bags with McDonald’s
                                  Doorbell sound causes younger viewers                         Doors opening increases Attention
                                                                                                                                              and Uber Eats logos
                                  to start looking up at the screen

      Ad Attention

        55+
Under 18
     18-34
    35-54

            0:00          0:01         0:02        0:03       0:04        0:05          0:06          0:07          0:08             0:09         0:10       0:11     0:12   0:13   0:14   0:15

                                                                                                                                                                                                  TV Performance Report H1 2019   06
TV Performance Report - H1 2019 - TVision Insights
LATE-NIGHT AD PERFORMANCE

Late-Night Comedy Drives High Ad Viewability,
but Ad Attention Varies
Late-night television is a crowded arena, and brands need to invest wisely if they hope to stand out. During the first half of 2019, all of   Unfortunately, it’s not enough for viewers to just be in the room when ads air — they need to be paying attention. Despite sharing the
the major late-night programs posted strong TV Viewability numbers, ranging from 87.1% for both The Tonight Show Starring Jimmy               same high Viewability, Late Night with Seth Meyers was 22% less efficient at generating attentive ad impressions than The Tonight
Fallon & Late Night with Seth Meyers’s, to 80.4% Viewability for both SNL and Jimmy Kimmel Live!                                              Show Starring Jimmy Fallon. Though it fell on the lower end of the TV Viewability rankings, Saturday Night Live had the highest
                                                                                                                                              Attention at 45.7%, followed closely by The Late Show with Stephen Colbert and The Late Late Show with James Corden. Liberty
                                                                                                                                              Mutual, Universal Orlando, and Progressive were some of the best performers in these late-night programs, as measured by Creative
     Ad Viewability              Ad Attention
                                                                                                                                              Attention Score (CAS).

                           The Tonight Show Starring Jimmy Fallon                                                                                                        Late Night With Seth Meyers
                                                                                                               87.1%                                                                                                                                           87.1%

                                                         40.2%                                      Top Brand: FedEx CAS 142.0                                                                 31.3%                                           Top Brand: Hanes CAS 105.1

                           The Late Show With Stephen Colbert                                                                                                            The Daily Show With Trevor Noah
                                                                                                       81.7%                                                                                                                                         82.4%

                                                                 44.9%                Top Brand: Universal Orlando CAS 128.0                                                                           39.3%                               Top Brand: Samsung CAS 120.0

                           Jimmy Kimmel Live!                                                                                                                            The Late Late Show with James Corden
                                                                                                     80.4%                                                                                                                                                   86.9%

                                                        40.0%                                      Top Brand: Humira CAS 176.0                                                                             44.9%                        Top Brand: Progressive CAS 120.0

                                                                                                                                                                         Saturday Night Live!
                                                                                                                                                                                                                                                   80.4%

                                                                                                                                                                                                               45.7%                 Top Brand: Liberty Mutual CAS 135.0

                                                                                                                                                                                                                                                    TV Performance Report H1 2019      08
TV Performance Report - H1 2019 - TVision Insights
AWARDS AD PERFORMANCE                                                                                                                      SPORTS AD PERFORMANCE

Not All Award Shows                                                                                                                        Brands Jockeying for
are Created Equally                                                                                                                        Ad Success in the Triple Crown
Live events are the lifeblood of broadcast and cable television, and H1 2019 had its fair share of major award shows and sports events     Each year, horse racing’s Triple Crown - the Kentucky Derby, Preakness Stakes,
(also see pages 11 and 12). Award shows are popular among brand advertisers looking to make a big splash on the red carpet. Some           and Belmont Stakes - make up three of the most anticipated events of the
of the big winners were movie promo ads from Paramount Pictures and Walt Disney Pictures, in addition to Lexus and QSR brands              summer sporting season. Typically, interest in the races rises and falls with the
Dunkin’ and Popeye’s.                                                                                                                      possibility that one of the horses will win all three competitions for a historic
                                                                                                                                           Triple Crown.
June’s Country Music Awards - while a smaller audience than marquee events like the Grammys and Oscars - kept viewers glued
to their screen during commercial breaks. The CMAs drove high TV engagement with both higher Viewability (76.0%) and Attention             Following Country House’s dramatic win at the Kentucky Derby in May, the
(45.7%). The Golden Globes also performed well with a Viewability percentage of 72.1% and an Attention percentage of 45.5%.                horse was pulled from the Preakness Stakes due to an illness. Despite the fact
                                                                                                                                           that a Triple Crown was out of the picture before the race began, Viewability
                                                                                                                                           and Attention nonetheless peaked, at 74.9% and 40.1%, respectively, during
     Ad Viewability             Ad Attention
                                                                                                                                           the Preakness Stakes.

                      76th Annual Golden Globe Awards                                                                                    2019 Triple Crown                                                             Top Brand
                                                                                             72.1%
                                                              45.5%                                  Top Brand: Dunkin’ CAS 128.1                                                                         64.7%

                                                                                                                                                                                      39.7%               Canada Dry CAS 121.3
                      61st Annual Grammy Awards
                                                                                   61.9%
                                                            41.4%                                  Top Brand: Popeye’s CAS 136.2
                                                                                                                                                                                                                     74.9%
                      91st Academy Awards                                                                                                                                               40.1%       General Electric CAS 128.8
                                                                                           68.2%
                                                               45.1%                                  Top Brand: Lexus CAS 120.0

                        2019 Billboard Music Awards                                                                                                                                                       65.6%
                                                                                           68.2%
                                                                                                                                                                                      34.9%                    Gillette CAS 110.8
                                                      38.0%                           Top Brand: Paramount Pictures CAS 136.0

                        54th Annual Academy of Country Music Awards
                                                                                                         76.0%
                                                               45.7%                  Top Brand: Walt Disney Pictures CAS 163.1

                                                                                                                                                                                                                                    TV Performance Report H1 2019   10
TV Performance Report - H1 2019 - TVision Insights
SPORTS AD PERFORMANCE                                                                                                                       SPORTS AD PERFORMANCE

Which Brands are Winning                                                                                                                    Advertising Performs Consistently
the Championships?                                                                                                                          Across The Big Dance
Whether your favorite sport is football, basketball, hockey or golf, the first half of 2019 featured major events that kept viewers tuned   Even if you aren’t a big college basketball fan, chances are you fill out your March
in and engaged. Though not all engagement is the same, Viewability and Attention across championship games can yield tremendous             Madness bracket like the rest of us! Without even knowing all the teams, fans are
value for advertisers looking for highly-engaged viewers.                                                                                   guaranteed nail-biters, upsets, and someone winning The Big Dance.

Surprisingly, the Super Bowl had lower TV Viewability than other major events, given many watching in a party setting. But the Big          Unlike a single game such as the Super Bowl, March Madness covers multiple
Game had strong performance, with viewers paying Attention to 43.3% of its ads. With such a large audience, the Super Bowl certainly        games airing across several channels. We decided to take a look at aggregate
generates lots of TV ad engagement. And the brand with the highest level of breakthrough across all these major sporting finals?            ad performance across each network airing games during the tournament. Cable
Reese’s took home the big trophy with a Creative Attention Score of 132.0 during the NBA Finals.                                            networks yielded slightly higher Viewability, and games airing on TNT generated
                                                                                                                                            the highest Ad Attention at 41.4%. Across the entire tournament, Walt Disney
     Ad Viewability              Ad Attention                                                                                               Pictures, Arm & Hammer, and Neftlix were best able to break through the clutter.

                       College Football Championship                                                                                                           NCAA Basketball Tournament
                                                                                   67.1%                                                                                                    66.0%
                                                          45.4%                                  Top Brand: Dr Pepper CAS 117.0                                             38.6%                 Top Brand: Netflix CAS 132.2

                       Super Bowl LIII
                                                                                62.1%
                                                     43.6%                                            Top Brand: ADT CAS 113.0
                                                                                                                                                               NCAA Basketball Tournament
                       NCAA March Madness Championship                                                                                                                                         67.4%
                                                                                         68.6%                                                                                 40.1%     Top Brand: Arm & Hammer CAS 128.3
                                                  41.6%                                             Top Brand: Buick CAS 128.0

                       2019 Masters - Final Round                                                                                                                                                                                   Top Brand: Lexus CAS 120
                                                                                    67.9%
                                                                                                                                                               NCAA Basketball Tournament
                                               40.5%                                       Top Brand: Mercedes-Benz CAS 103.0
                                                                                                                                                                                              67.0%
                       NHL Stanley Cup - Final Game                                                                                                                              41.4%       Top Brand: Walt Disney CAS 140.0

                                                                                         68.4%
                                           38.2%                                                 Top Brand: Wendy’s CAS 125.0

                       NBA Championship - Final Game                                                                                                           NCAA Basketball Tournament
                                                                                 64.8%                                                                                                         67.2%
                                          37.8%                                                   Top Brand: Reese’s CAS 132.0
                                                                                                                                                                             39.0%           Top Brand: Walt Disney CAS 155.2

                                                                                                                                                                                                                                   TV Performance Report H1 2019   12
2019 DEMOCRATIC DEBATES

Analyzing the Politics of Attention
The road to 2020 began in earnest earlier this year with the Democratic presidential primary debates kicking off this past June. During
both of the first debates, Democrat-leaning viewers tended to pay closer attention than Undeclared viewers. And with fewer ad pods than
most live events, brands like Quickbooks, Rakuten, The New York Times, Progressive, and WeatherTech generated the highest viewer
engagement. With several more debates remaining in 2019, it will be interesting to see how the many candidates - and brands - perform
when it comes to viewer engagement.                                                                                                                                                                              Top Brand Advertisers

Debate Night #1: June 26                                                                                                                                                                                         Night #1
                                                                                                                                  Ad
                              Warren & Booker                                                                                   Pods
                              “We want an economy                            Castro & Beto
                                                                                                                                                                            War in             Castro             1
                              that works for everybody.”                     Debatamos inmigración                                                                                             “Adios”
                                                                                                                                                Heats up on Guns,        Afghanistan
Democratic                                                                                                                                Civil Rights, Climate Change
  Viewers
                                                                                                                                                                                                                  2
Undeclared
  Viewers

                                                                                                                                                                                                                  3
              9:00                      9:15                      9:30                      9:45                     10:00                  10:15              10:15            10:45                    11:00

Debate Night #2: June 27                                                                                                                                                                                         Night #2

                                                                          China, Russia,
                                                                         and kids at the
                                                                                                                                                                                                                  1
                                                                                 border
Undeclared
  Viewers

                                                                                                                                                                          “What is the first                      2
                                                                                                                                                      Women’s Rights,
                                                                                                                                                      Climate Change       thing you would
                                                                                                                                                                          do as President?”
Democratic
                     “Will you raise          Biden: “I’m still                                                              Harris: “I would
  Viewers
                     taxes, Bernie?”          holding that torch.”                                                           like to speak on                                                                     3
                                                                                                                             the issue of race.”
              9:00                      9:15                      9:30                      9:45                     10:00                  10:15              10:15            10:45                    11:00

                                                                                                                                                                                                                            TV Performance Report H1 2019   14
PROGRAM AD PERFORMANCE

  Top Primetime Broadcast & Cable Programs
  BROADCAST                                                                                                                                             CABLE
  Appearing on our top 10 lists for both Ad Viewability and Ad Attention, FOX’s Lethal Weapon and The CW’s Arrow stood out as two of                    On Cable, content that is often more niche — including history, science, and reality TV programs — engaged viewers with shows like My
  the best Broadcast TV advertising opportunities of the year. Additionally, NCIS: The Cases They Can’t Forget was a top-rated Broadcast                Big Fat Fabulous Life and Ancient Aliens drawing spots in the top 10.
  show for TV Viewability, keeping viewers in the room more than other programs.
                                                                                                                                                        The science fiction drama The Magicians and the reality show Zombie House Flipping were the big winners of this period, placing in the
  The CW placed five shows in the top 10 for Ad Viewability, suggesting its audience is less likely than others to leave the room during                top 10 for both Ad Viewability and Ad Attention.
  commercial breaks. Overall, dramas seemed to make up a larger share of the Ad Viewability rankings while sitcoms like Speechless
  and Fresh Off the Boat overperformed in Ad Attention.                                                                                                        Ad Viewability                Ad Attention

  Broadcast - Ad Viewability                                                                                                                            Cable - Ad Viewability

    89.3%                                                                                                                                                91.8%
                      88.2%       88.2%         87.9%                                                                                                                    89.9%           89.4%          88.5%
                                                               87.8%         86.8%                                                                                                                                       88.3%             88.2%
                                                                                            86.7%          86.6%                                                                                                                                           87.8%            87.6%
                                                                                                                           86.4%           86.3%                                                                                                                                            87.5%         86.7%

      CBS               CW          FOX           CW            CW             CBS            CW            ABC              ABC             CW            SYFY             AMC          History        History       Science Channel       A&E             A&E           Investigation        FX        BBC America
NCIS: The Cases       Legacies     Lethal     In The Dark      Arrow      Life in Pieces   Crazy Ex-     The Rookie    Marvel’s Agents     Supergirl   The Magicians    Killing Eve      Channel        Channel          How the        Zombie House      Live PD           Discovery     Fosse/Verdon     Luther
They Can’t Forget                 Weapon                                                   Girlfriend                   of S.H.I.E.L.D.                                                   Alone      Ancient Aliens   Universe Works      Flipping   Presents: PD Cam       The Face
                                                                                                                                                                                                                                                                              of Evil

  Broadcast - Ad Attention                                                                                                                              Cable - Ad Attention

    65.9%
                     59.5%       58.8%         58.4%          57.9%        57.8%                                                                         58.6%
                                                                                           57.7%          57.0%                                                          57.1%           55.7%
                                                                                                                         56.6%                                                                         54.9%             54.3%             54.3%            53.4%          52.6%            52.4%         52.3%
                                                                                                                                          56.5%

      FOX              ABC         ABC           NBC            FOX          CW             CBS             CBS            FOX               CW            TLC             SYFY        USA Network       A&E             BRAVO          Science Channel       A&E           BRAVO             TLC         Paramount
 Lethal Weapon      Speechless   Fresh Off   Will & Grace   The Passage     Arrow           Mom         God Friended     Last Man         Burden of     My Big Fat     The Magicians      Suits      Zombie House       Best Room           What on         Live PD:        Summer         I Am Jazz       Network
                                 the Boat                                                                   Me           Standing           Truth      Fabulous Life                                   Flipping           Wins               Earth?       Police Patrol      House                          Cops

                                                                                                                                                                                                                                                                           TV Performance Report H1 2019      16
ADVERTISER PERFORMANCE

For Brand Advertisers, it is Important to Optimize
for both Viewability & Attention
In order to really make their mark on TV, brands need to keep viewers in the room and capture their attention while their ads air. From this   Measuring at the person-level, we also analyzed top performing brand advertisers for men and women. Naväge’s TV ads for sinus
perspective, Cologuard, Levi’s, T-Mobile, and Subaru all began the year on the right foot, with each placing in the top for both categories.   relief kept men in the room, while Xfinity kept their eyes on-screen — beating out brands in many other categories. For women, ads by
                                                                                                                                               e-cigarette leader JUUL kept them in the room while Cologuard’s ads kept their eyes on-screen.
E-cigarette brand JUUL and healthcare brand Naväge topped our Ad Viewability rankings, but they failed to grab viewer Attention at a
rate comparable to other leading brands on TV.

     Ad Viewability              Ad Attention

                                                                                                                                               Top Brands, Male Viewability                                             Top Brands, Male Attention
Top Brands, Overall Viewability                                                                                                                  79.1%       78.0%           77.8%       77.4%          77.1%

   80.2%                                                                                                                                                                                                                   48.4%        47.5%          46.9%         46.8%        46.5%
                 80.1%         79.4%         79.4%             79.0%         78.6%          78.4%         78.3%
                                                                                                                   78.1%        78.1%

                                                                                                                                                               Vanda          Levi’s    T-Mobile        Bausch                        Cologuard        Visit Las   SanDiego.org   Charles
                                                                                                                                                           Pharmaceuticals                              & Lomb                                          Vegas                     Schwab

                Naväge         Levi’s       T-Mobile           Vanda         Cologuard   Guardian Legal   Humana   Dodge        Subaru
                                                           Pharmaceuticals                 Network

Top Brands, Overall Attention
                                                                                                                                               Top Brands, Female Viewability                                           Top Brands, Female Attention
                                                                                                                                                 81.3%       80.9%
   49.7%         49.2%         48.7%         48.2%            48.2%                                                                                                          80.6%       80.1%
                                                                              48.1%         47.4%                                                                                                       79.6%
                                                                                                          47.3%    47.1%        47.1%                                                                                      51.3%        50.5%          49.7%         49.6%        49.1%

                 Levi’s        Mazda     California Milk      T-Mobile        Xfinity       Subaru        Bausch   Apple         UPS
                                         Advisory Board                                                   & Lomb

                                                                                                                                                             Naväge          T-Mobile   Cologuard       Vanda                        California Milk     Silk         Levi’s      T-Mobile
                                                                                                                                                                                                    Pharmaceuticals                  Advisory Board

                                                                                                                                                                                                                                                       TV Performance Report H1 2019         18
ADVERTISER PERFORMANCE

Top Ads Breaking Through the Clutter                                                                                                       Top Men CAS

                                                                                                                                                         Volvo - Follow No One :30
Every brand marketer wants to make great TV advertising that engages their target consumers. Our Creative Attention Score (CAS)
measures a TV commercial’s ability to win viewer Attention as compared to the other content that runs during the same ad pod. This                       CAS                                                                  113.1
allows marketers to better understand the quality of the creative itself, isolated from contextual factors like when the ad airs and the
show it runs inside.
                                                                                                                                                         Volkswagen - Moving :30

Using these unique, person-level, second-by-second metrics, Volvo was shown to have the most engaging TV ad of 2019’s first half,                        CAS                                                          110.7
with a CAS of 114.0 in a spot for its S60 sedan. The auto manufacturer was followed by ads for Bounty, Frito-Lay, Dawn, and
Home Depot.                                                                                                                                              Wells Fargo - LuLu & Lobo Need a Space Just for Them :30

                                                                                                                                                         CAS                                                        110.2
To watch this year’s winning TV ads, alongside a second-by-second analysis, visit T.Vision/TopAds.

                                                                                                                                                         Walmart - Famous Cars :30
Top Overall CAS
                                                                                                                                                         CAS                                                        108.6
                       Volvo - Follow No One :30

                       CAS                                                                                   114.0                         Top Women CAS

                       Bounty - Chopsticks :30                                                                                                           Dawn - More Than Just Dishes :30

                       CAS                                                                           112.0                                               CAS                                                                        117.4

                       Frito-Lay - Hero :30                                                                                                              Volvo - Follow No One :30

                       CAS                                                                         111.4                                                 CAS                                                                114.6

                                                                                                                                                         Marriott Bonvoy - Bonvoy! :30
                       Dawn - More Than Just Dishes :30
                                                                                                                                                         CAS                                                                113.8
                       CAS                                                                        109.4

                                                                                                                                                         Tide Pods - A Foolproof Clean :30
                       Home Depot - Latest Innovations :15

                       CAS                                                                        109.4                                                  CAS                                                            112.0

                                                                                                                                                                                                                      TV Performance Report H1 2019   20
BRAND SPOTLIGHT

How Volvo Scored H1’s Most Engaging Ad
For the first half of 2019, Volvo had the top performing ad with the highest Creative Attention Score (CAS), as seen on the preceding
page. Using our second-by-second measurement technology, we’re able to break down how and why Volvo was able to produce the
most attention-grabbing ad.

Throughout the commercial, Volvo paired a narrated reading of an E.E. Cummings quote on individuality with images of the open road,
successfully capturing the feelings of escape and adventure its luxury sedan is meant to inspire.

The ad saw an initial spike in Attention as its protagonist arrived at his vehicle after pushing through a crowd of people in suits.
The introduction of a mysterious, upbeat musical cue caused viewers to look up at the screen at the 18-second mark, and Attention
peaked again when Volvo’s branding appeared on-screen at 26 seconds. To watch the full ad with our second-by-second analysis, visit
T.Vision/TopAds.

                          :02                                                                                                     :18                                 :26
                          Shot of car causes                                                                                      Music causes viewers to look up     Peak in Attention during on-screen
                          initial Attention                                                                                       at the screen                       branding and tagline

      Ad Attention

Average

                   0:00                          0:05                              0:10                         0:15                         0:20                   0:25                    0:30

                                                                                                                                                                                                           TV Performance Report H1 2019   22
BRAND PERFORMANCE

From CPG Health to DTC —
Here’s Who Topped Their Competition
As shown on page 3, there is a wide variance in brand TV performance - driven by many factors, including industry. Across all major
industries, understanding who makes the top brands - and doesn’t - is key to understanding TV performance.

Over the next few pages, we’ve ranked the top five brand advertisers for each major industry by TV Viewability - the percentage of
impressions where viewers were in the room during their ads. For these top Viewability brands, we’ve also shown their respective Ad
Attention scores. While Viewability and Attention are important together, it’s equally important to understand Viewability first - as an ad
cannot capture Attention if a viewer is not in the room.

         Ad Viewability                     Ad Attention

Alcohol                                                                           Auto                                                                                      Consumer Tech                                                                    CPG Food & Beverage

                                                                                    78.1%             78.1%                                                                                                                                                   77.5%
 76.6%                                                                                                                  77.2%                                               76.6%            76.6%           76.0%                                                             75.8%
                                                                                                                                          76.6%                                                                              74.9%
                 74.6%                                                                                                                                      76.3%                                                                            74.6%                                               75.5%
                                 74.5%            74.1%                                                                                                                                                                                                                                                           74.9%            74.8%
                                                                  73.9%                                       47.4%                                                                  47.1%           46.1%
                                                                                                                                45.0%             46.1%             46.4%                                            44.1%           45.0%           44.3%
                                                          42.9%           43.6%             44.4%                                                                                                                                                                                       43.4%            44.3%            43.3%
                         42.2%           41.2%                                                                                                                                                                                                                        40.7%                                                                 41.6%
         40.3%

                  Michelob         Captain          Kim             Stella                             Subaru                 Audi              Kia               Jeep                       Microsoft       Facebook        Samsung          Amazon                            Sargento            CLIF            Daisy            Toffifay
                    Ultra          Morgan         Crawford          Artois

CPG Health                                                                        CPG Home                                                                                  CPG Personal Care                                                                DTC
 80.1%
                 75.4%
                                 75.2%           75.2%                            75.8%                                                                                      77.6%                                                                           75.6%
                                                                                                    74.7%                                                                                    77.3%           77.0%                                                            73.6%             73.4%
                                                                  74.3%                                               74.5%             74.3%             74.3%                                                              76.7%                                                                               73.3%
                                                                                                                                                                                                                                             75.3%                                                                                73.0%
                                         42.0%                            42.7%
         38.9%                                           40.5%
                         36.8%                                                                                                                                                       47.0%                                                                           45.3%
                                                                                          43.6%
                                                                                                            42.9%             42.1%                               42.6%                              46.7%           45.6%                                                            44.8%             42.5%                             42.5%
                                                                                                                                                41.8%                                                                                39.8%           42.1%                                                               39.8%

                   Rohto         Metamucil       Salonpas         Nasacort                           Downy             Arm &              Dixie            Bounce                            Lancome         Sensodyne         Dolce          Jergens                           Ring             Wayfair         ThirdLove        Ancestry
                                                                                                                      Hammer                                                                                                 & Gabbana

                                                                                                                                                                                                                                                                                                 TV Performance Report H1 2019                    24
BRAND PERFORMANCE

From Finance to Telecom —
Here’s Who Topped Their Competition
As shown on page 3, there is a wide variance in brand’s TV performance - driven by many factors, including industry. Across all major
industries, understanding who makes the top brands - and doesn’t - is key to understanding TV performance.

         Ad Viewability                     Ad Attention

Finance                                                                           Insurance                                                                                Pharma Rx                                                                         Restaurant
                                                                                                                                                                           79.0%
                                                                                    78.3%                                                                                                    77.4%
                                                                                                     76.0%                                                                                                   77.2%           76.3%                           75.9%
 75.8%           74.7%                                                                                                 75.1%             73.9%                                                                                               76.0%                           73.4%
                                 74.6%           74.0%                                                                                                     73.7%                                                                                                                             73.2%
                                                                 73.8%                                                                                                                                                                                                                                       72.6%
         46.6%                                                                                                                                                                                                                                                                                                               72.1%
                         45.8%                                                                                                                                                                       45.9%           45.7%           45.4%
                                         44.1%                                                                                                                                     45.0%                                                                             43.4%
                                                         44.6%                                                                                                                                                                                                                       39.3%           41.1%           41.1%           40.1%
                                                                         44.5%              46.5%            46.3%                               44.4%                                                                                               43.8%
                                                                                                                               44.1%                               42.3%

                   Voya           Bank of         Pacific           Fisher                              Aflac          SafeAuto         Progressive         Farmers                          Juvederm         REXULTI        HPV.com         TREMFYA                          Panera           Chili’s       McDonald’s        Little
                 Financial        America          Life          Investments                                                                               Insurance                                                                                                          Bread                                           Caesars

Retail                                                                           Telecom                                                                                   Travel
 79.4%
                 77.0%                                                            79.4%                                                                                     77.6%
                                 76.5%                                                              77.1%            76.8%
                                                 76.4%           76.2%                                                                 74.8%             74.8%                               76.4%
                                                                                                                                                                                                             75.5%
         49.2%                                                                                                                                                                                                               75.3%
                                                                                                                                                                                                                                             74.8%
                         44.7%                                           45.3%            48.2%
                                         44.3%                                                              48.1%
                                                         43.2%                                                                                                                      46.2%
                                                                                                                                                                                                     45.9%
                                                                                                                             45.8%                                                                                   45.2%
                                                                                                                                               44.5%                                                                                 44.4%
                                                                                                                                                                 42.8%                                                                               44.1%

                 T.J. Maxx       Overstock        Boll &         Walgreens                            Xfinity        Consumer            Metro           TracFone                           SanDiego.org        Hertz        Southwest        Universal
                                   .com           Branch                                                              Cellular                           Wireless                                                             Airlines        Orlando

                                                                                                                                                                                                                                                                                             TV Performance Report H1 2019               26
NEW INNOVATION: TVISION STREAMING ANALYTICS                                                                                                                     NEW INNOVATION: TVISION AUDIENCES

TV Intelligence for an OTT World                                                                                                                                Reach TV Audiences Like Never Before
The media industry trusts TVision to better measure their TV content performance. Now, TVision Streaming Analytics further enhances
TVision’s OTT measurement — providing performance metrics across leading streaming platforms at the device, application, and                                    Industry-leading brands use TVision’s performance metrics platform to better plan and measure their TV advertising performance.
content-level.                                                                                                                                                  With TVision Audiences, brands can now leverage true person-level TV engagement data — to drive digital video and advanced TV
                                                                                                                                                                targeting strategies.
KNOW WHERE TV AUDIENCES ARE GOING — AT THE PERSON-LEVEL
According to eMarketer, 56% of the US will be streaming TV - across 190 million OTT subscriptions - by 2020. As we increasingly
consume TV content via non-linear services, there are more questions than ever:

    Which streaming shows are most popular?                                     What demographics engage which content the most?
                                                                                                                                                                Engage TV Audiences across Digital & Advanced TV
    Which service do viewers use to watch their favorite shows?                 How are viewing audiences shifting across TV platforms?
                                                                                                                                                                 Person-level TV watching data                                       Always on, passive measurement
                                                                                                                                                                 Linear and OTT watching                                             100% opt-in and privacy-safe
                                                                                                                                                                 True engagement data — go beyond tuning                             On-demand custom audiences

UNIQUE DATA, UNPARALLELED OTT INTELLIGENCE
By delivering streaming behavior data, TVision is delivering highly                                                                                             Unique Syndicated & Many Custom Audience Segments
sought-after, market-level analytics of a changing TV landscape.

   Competitive Analytics: Top shows and services.                                                                                                               TV STREAMING                                                        TV VIEWABILITY
   Consumer Trends: Analyze viewing consumption shifts.                                                                                                          Streaming > High Streamers/Low Linear                                High Viewability > Automotive TV Ads
   Always-On Measurement: 100% opt-in and privacy safe.                                                                                                          Streaming > New/Increasing Streamers                                 High Viewability > CPG TV Ads
                                                                                                                                                                 Streaming > Binge Watchers                                           High Viewability > Entertainment TV Ads
                                                                                                                                                                 Devices > Cord Cutters                                               High Viewability > Financial Services TV Ad

Most Co-viewed Shows                                                          Most Rewatched Shows
Percentage of episodes viewed with more than one person in the room           Percentage of episodes viewed in the past 35 days that were not watched           TV ATTENTION                                                        TV TUNING
during the program.                                                           by the viewer for the first time.
                                                                                                                                                                 TV Attention > High Attention to Sports TV                           TV Tuning > Tentpoles > Watchers of Award Shows

Cupcake & Dino: General Services                                      61.7%   Tumble Leaf                                                               45.1%    TV Attention > High Attention to Insurance TV Ads                    TV Tuning > Sports Content > Heavy Baseball Watchers
                                                                                                                                                                 TV Attention > High Attention to Retail TV Ads                       TV Tuning > Networks > Heavy Watchers of The CW
The Dragon Prince                                                     59.3%   Cupcake & Dino General Services                                           36.0%
                                                                                                                                                                 TV Attention > High Attention to Travel TV Ads                       TV Tuning > Streaming > Watchers of Amazon TV
The Final Table                                                       52.8%   Dinotrux Supercharged                                                     33.9%

Brainchild                                                            50.5%   The Who Was? Show                                                         32.9%
Chef’s Table                                                          49.1%   Trolls: The Beat Goes On!                                                 30.6%

                                                                                                                                                                                                                                                                    TV Performance Report H1 2019   28
About TVision                                                                                                                               Methodology & Metrics
The Leader in TV Performance Metrics                                                                                                        Methodology

TVision measures what was once unmeasurable - how people really watch TV. Using cutting-edge computer vision technology, only TVision
                                                                                                                                            TVision measures Ad Viewability and Ad Attention for every second of programming and advertising on television. Every time a person
measures person-level, second-by-second TV engagement. Marketers and Media Sellers access TVision’s TV performance metrics via
                                                                                                                                            walks into the room, our technology detects who the viewer is, where they are in the room and what their eyes are looking at. We do all
its software as a service platform. TVision’s customers include some of the world’s largest brand advertisers and TV networks. TVision is
                                                                                                                                            this without personally identifying individual users, and without transmitting any images or videos.
headquartered in New York City, with offices in Boston and Japan.

                                                                                                                                            The data for this report was collected from January 1 to June 30, 2019, from 5,000 homes across the United States. All data is
Make your TV Work Harder                                                                                                                    weighted to represent the country. All demographic data was self-reported by the respondents.

                PLANNING                                                             OPTIMIZATION
                Use performance metrics like Viewability &                           Our always-on solution is updated daily.
                                                                                                                                            Additional Notes
                Attention to plan media – across your Upfront,                       Understand what’s going on in your campaign and
                scatter, or quarterly buybacks.                                      adjust channel allocations within Network groups.        All data is measured second-by-second, person-by-person.                    To qualify for rankings, top brands must have captured a
                                                                                                                                              All data includes Live Plus 3 Days.                                         minimum sample of 1,000.
                                                                                                                                              All data is for viewers P2+.                                                To qualify for rankings, all programs and ads must have a
                                                                                                                                              Top brands and ads do not include network promotional                       minimum sample size of 500.

Drive Greater TV Engagement                                                                                                                   ads or local ads, and are limited to :15 and :30-second ads.                Top programs and ads are limited to English-speaking
                                                                                                                                                                                                                          content only.

     TVision Client              Competitor                                  Source: TVision Performance Metrics, A25-54, 2018-2019
                                                                                                                                            Key Metrics / Definitions

                                                                   Upfront Investment
                                                             Informed by TVision Data
                                                                                                      +44%
                                                                                                                                                               Ad Viewability (%):
                                                                                                                    +17%                                       This metric measures how effectively viewers are kept in the room while ads are on-screen. It is measured as the
                                                                                                                                 +43%
                                                                                         +12%                                                                  percentage of all ad impressions in which a viewer was in the room for two or more seconds.
    ATTENTION

                                                                                                                                                               Ad Attention (%):
                                                                                                                                                               This metric measures how effectively an ad or ads held viewers’ attention while they aired. It is measured as the
                                                                                                                                                               percentage of all ad impressions in which the viewer was looking at the TV screen for two or more seconds.

                                                                                                                                                               Creative Attention Score (CAS):
                                                                                                                                                               This metric measures an ad’s ability to grab the audience’s attention, as compared to surrounding content. CAS
                MAY-18      JUN-18        JUL-18     AUG-18      SEP-18     OCT-18       NOV-18      DEC-18       JAN-19        FEB-19                         measures the percentage of an ad’s aggregate run time that viewers spent with their eyes on the screen, as indexed
                                                                                                                                                               against the other ads that ran in the same ad pod.

                                                                                                                                                                                                                                                   TV Performance Report H1 2019      30
tvisioninsights.com
You can also read