Technical Guide Updated October 26, 2020 - UL Benchmarks
←
→
Page content transcription
If your browser does not render page correctly, please read the page content below

Technical Guide
 Updated October 26, 2020

Page 1 of 71

3DMark – The Gamer's Benchmark .............................................................................. 4
 3DMark benchmarks at a glance .................................................................................... 5
 Test compatibility .............................................................................................................. 6
 Legacy benchmark tests .................................................................................................. 7
 Latest version numbers ................................................................................................... 8
 Good testing guide ........................................................................................................... 9
 Settings ............................................................................................................................. 10
Wild Life.......................................................................................................................... 12
 Wild Life ............................................................................................................................ 13
 Wild Life Stress test ........................................................................................................ 14
 Cross-platform benchmarking ...................................................................................... 15
 Device requirements ...................................................................................................... 16
 Default settings ............................................................................................................... 17
 Graphics test ................................................................................................................... 18
 Scoring .............................................................................................................................. 19
 Wild Life engine ............................................................................................................... 22
 Wild Life version history................................................................................................. 24
How to use the Wild life App ....................................................................................... 25
 My tests ............................................................................................................................ 26
 My results ........................................................................................................................ 27
 My device ......................................................................................................................... 31
 Settings ............................................................................................................................. 34
Sling Shot ....................................................................................................................... 36
 Sling Shot ......................................................................................................................... 37
 Sling Shot Extreme.......................................................................................................... 38
 Cross-platform benchmarking ...................................................................................... 39
 Device requirements ...................................................................................................... 40
 Default settings ............................................................................................................... 41
 Graphics test 1 ................................................................................................................ 42
 Graphics test 2 ................................................................................................................ 43
 Physics Test ..................................................................................................................... 44
 Scoring .............................................................................................................................. 45
 Sling Shot engine ............................................................................................................ 49
 Sling Shot version history .............................................................................................. 52
API Overhead feature test ........................................................................................... 54

Page 2 of 71

Correct use of the API Overhead feature test ............................................................. 56
 System requirements ..................................................................................................... 57
 Technical details.............................................................................................................. 58
 Metal path ........................................................................................................................ 60
 OpenGL ES 3.0 path ........................................................................................................ 61
 Scoring .............................................................................................................................. 62
 API Overhead version history........................................................................................ 63
How to report scores .................................................................................................... 64
Release notes ................................................................................................................ 66
 iOS edition - 3DMark Wild Life app .............................................................................. 66
 iOS edition - 3DMark Sling Shot app ............................................................................ 67
 iOS edition - 3DMark Ice Storm app ............................................................................. 68
 iOS edition - 3DMark API Overhead app ..................................................................... 70
About UL ........................................................................................................................ 71

Page 3 of 71

3DMARK – THE GAMER'S BENCHMARK 3DMark is a popular benchmarking app that helps you test and compare the performance of smartphones and tablets. 3DMark works by running intensive graphical and computational tests. The more powerful your hardware, the smoother the tests will run. Don't be surprised if frame rates are low. 3DMark benchmarks are very demanding. At the end of a test, you get a score, which you can use to compare models. Be sure to use the most appropriate test for the device’s capabilities and report your results using the full name of the benchmark, for example: " Smartphone scores 2,000 in the 3DMark Sling Shot Extreme benchmark." "The smartphone scores 2,800 in 3DMark." 3DMark is used by millions of gamers, hundreds of hardware review sites and many of the world's leading manufacturers. We are proud to say that 3DMark is the world's most popular and widely used benchmark. The right test every time We've made it easy to find the right test for your device. When you open the app, 3DMark will recommend the best benchmark for your model. Cross-platform benchmarking You can measure the performance of Android, and iOS devices and compare scores across platforms. Page 4 of 71
3DMARK BENCHMARKS AT A GLANCE
 3DMark includes many benchmarks, each designed for specific class of
 hardware capabilities. You will get the most useful and relevant results by
 choosing the most appropriate test for your model.

 RENDERING
 BENCHMARK TARGET HARDWARE ENGINE
 RESOLUTION1

 WILD LIFE STRESS High-end smartphones
 Metal 2560 × 1440
 TEST and tablets

 High-end smartphones
 WILD LIFE Metal 2560 × 1440
 and tablets

 SLING SHOT High-end smartphones OpenGL ES 3.1
 2560 × 1440
 EXTREME and tablets Metal

 Mainstream
 SLING SHOT smartphones OpenGL ES 3.0 1920 × 1080
 and tablets

1
 The resolution shown in the table is the resolution used to render the Graphics tests. In most cases, the
 Physics test or CPU test will use a lower rendering resolution to ensure that GPU performance is not a
 limiting factor.

 Page 5 of 71
TEST COMPATIBILITY

 WINDOWS ANDROID IOS

WILD LIFE STRESS TEST ● ● ●

WILD LIFE ● ● ●

SLING SHOT EXTREME ✕ ● ●

SLING SHOT ✕ ● ●

API OVERHEAD ● ● ●

Page 6 of 71
LEGACY BENCHMARK TESTS
Benchmarks have a natural lifespan that ends when they no longer provide
meaningful results on modern hardware.

When old benchmarks are used with new hardware, the results can be
skewed or limited in ways that reduce their accuracy and relevance.

3DMark Ice Storm
Support for 3DMark Ice Storm benchmarks ended on January 14, 2020.

Ice Storm and Ice Storm Extreme are OpenGL ES 2.0 benchmarks that were
released in 2013. They were originally designed for testing and comparing
mainstream tablets and mobile devices. We now recommend 3DMark Sling
Shot for benchmarking the latest iPhone and iPad models.

Page 7 of 71
LATEST VERSION NUMBERS

 WINDOWS ANDROID IOS

3DMARK APP 2.14.7042 2.1.4694 See table below

WILD LIFE 1.0 1.0 1.0

SLING SHOT ✕ 2.3 2.2

API OVERHEAD 1.5 1.0 1.0

On iOS, 3DMark benchmarks are separate apps due to platform limitations.

IOS APP VERSION

WILD LIFE 1.0.200

3DMARK SLING SHOT 1.0.1010

3DMARK API OVERHEAD 1.0.147

Page 8 of 71
GOOD TESTING GUIDE
To get accurate and consistent benchmark results you should test clean
systems without third party software installed. It is a good idea to close
other apps that may be running in the background and disable notifications
before running the benchmark.

Some high-powered mobile devices use thermal throttling to avoid
overheating the CPU, which can lead to lower scores on successive runs. To
reduce this effect, we recommended waiting 15 minutes before and after
3DMark runs to allow the device to cool down.

• Running other programs during the benchmark can affect the results.
• Don't touch the screen while running tests.
• You can cancel a test by pressing the Home Button.

Recommended process

1. Ensure your operating system is up to date.
2. Close other programs.
3. Run the benchmark.

Expert process

1. Ensure your operating system is up to date.
2. Restart the device.
3. Wait 2 minutes for startup to complete.
4. Close other apps, including those running in the background.
5. Wait for 15 minutes.
6. Run the benchmark.
7. Repeat from step 3 at least three times to verify your results.

Page 9 of 71
SETTINGS
The settings found on the Settings screen apply to all available 3DMark
benchmark tests.

Show demo
Select NO if you wish to skip the demo. This option is set to YES by default.

Language
Use this drop down to change the display language. The choices are:

• English
• Simplified Chinese
• Russian
• German (Wild Life only)
• Finnish (Wild Life only)

Page 10 of 71
Page 11 of 71
WILD LIFE
3DMark Wild Life is a cross-platform benchmark for modern mobile devices.
Use Wild Life to test and compare the latest Apple and Android devices as
well as lightweight notebooks on Windows.

Wild Life scores can be compared across iOS, Android and Windows.

Wild Life uses the Metal API on iOS devices. The test uses the Vulkan API on
Android devices and Windows PCs.

For iOS, download the standalone app from the Apple App Store. For
Android, download the 3DMark Android app from Google Play. On
Windows, Wild Life is only available in the 3DMark Advanced Edition and
Professional Edition.

On iOS, Wild Life compatibility starts with iPhone 6s and runs to the latest
models. You need iOS 13 or later to run the benchmark.

Android devices must have Android 10 or later and support Vulkan 1.1 to
run Wild Life.

Page 12 of 71
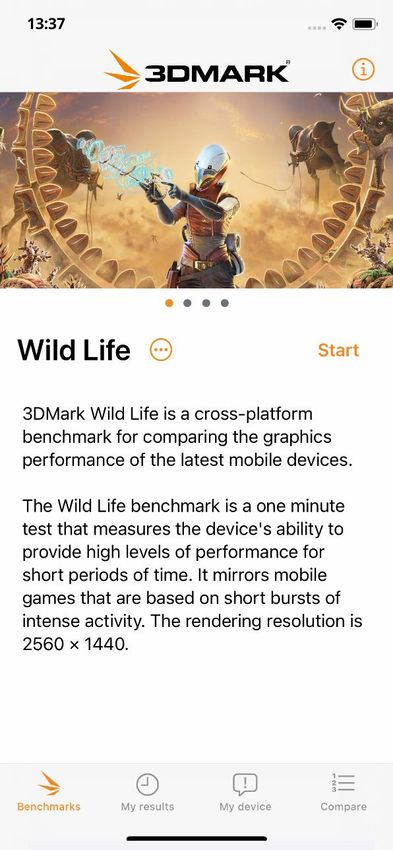
WILD LIFE
Use 3DMark Wild Life to test and compare the graphics performance of the
latest smartphones, tablets and notebooks.

Wild Life benchmark runs for one minute. It measures the device's ability to
provide high levels of performance for short periods of time. It mirrors
mobile games that are based on short bursts of intense activity. The
rendering resolution is 2560 × 1440.

Many mobile devices lock their display refresh rate to 60 Hz and force the
use of vertical sync. If your device is able to run this test at more than 60
frames per second you will be prompted to run a more demanding test
instead.

Use Wild Life Unlimited mode to make chip-to-chip comparisons. In
Unlimited mode, the test renders exactly the same frames in every run on
every device. The display is updated with frame thumbnails every 100
frames to show progress.

Use Unlimited mode to make chip-to-chip comparisons without vertical
sync, display resolution scaling and other operating system factors affecting
the result.

Page 13 of 71
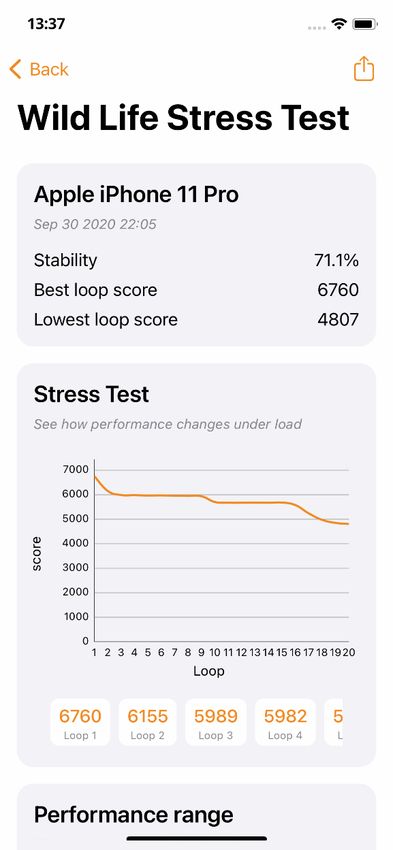
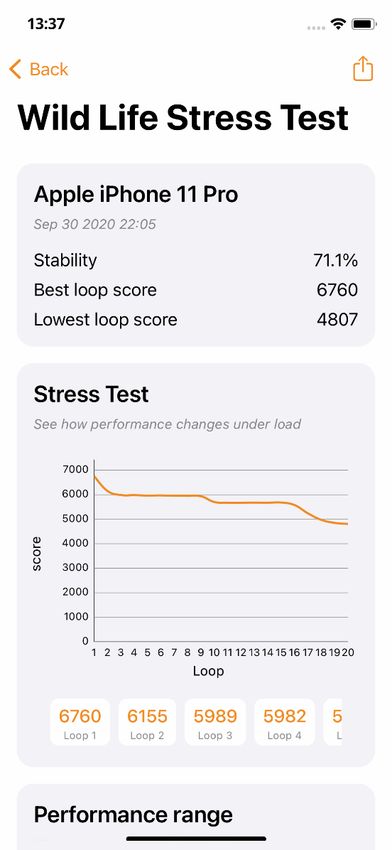
WILD LIFE STRESS TEST
The 3DMark Wild Life Stress Test is a longer test that shows how a device
performs under longer periods of heavy load. It mirrors mobile games in
which the gameplay loop is a longer, more immersive experience.

The Wild Life Stress Test uses the same scene as Wild Life benchmark, but it
loops it for twenty minutes. The test uses a 2560 × 1440 rendering
resolution before scaling the content to the display.

Instead of producing a single score, the main result from the stress test is a
chart that shows you how the device’s performance changed during the
test. This chart can help you understand how your device manages
performance and heat during heavy use.

Use Wild Life Stress Test Unlimited to make chip-to-chip comparisons
without vertical sync, display resolution scaling and other operating system
factors affecting the result. Sling Shot Extreme Unlimited uses the same
content and settings as Wild Life Stress Test but runs offscreen using a fixed
time step between frames. It renders exactly the same frames in every run
on every device. The display is updated with frame thumbnails every 100
frames to show progress.

Page 14 of 71
CROSS-PLATFORM BENCHMARKING
The rows in the table below show valid cross-platform comparisons, i.e. you
can compare Wild Life scores across platforms, and you can compare Wild
Life Stress Test scores across platforms. But you cannot compare Wild Life
scores with Wild Life Stress Test scores. The two tests are designed for
different purposes.

The test uses a 2560 × 1440 rendering resolution on all platforms.

Please note that mobile devices are more likely to thermal throttle and
produce lower scores for the Wild Life Stress Test.

BENCHMARK IOS API ANDROID API WINDOWS API

WILD LIFE Metal Vulkan Vulkan

WILD LIFE STRESS
 Metal Vulkan Vulkan
TEST

Page 15 of 71
DEVICE REQUIREMENTS
Apple iOS

 WILD LIFE WILD LIFE STRESS TEST

OS iOS 13 or later iOS 13 or later

MEMORY 2 GB 2 GB

GRAPHICS Metal Metal

STORAGE 170 MB 170 MB

Page 16 of 71
DEFAULT SETTINGS

 WILD LIFE WILD LIFE STRESS TEST

RESOLUTION 2560 × 1440 2560 × 1440

GPU MEMORY BUDGET 1024 MB 1024 MB

Page 17 of 71
GRAPHICS TEST
Wild Life is a GPU benchmark. On iOS, the benchmark shows the advanced
rendering techniques and post-processing effects that are possible on the
latest iPhone and iPad models when using the Metal graphics API. The test
uses a 2560 × 1440 rendering resolution before scaling the content to the
display.

The Wild Life graphics test consists of multiple scenes with variations in the
amount of geometry, lights and post-processing effects. The backbone of
the test is a deferred renderer with clustered light culling. The scenes utilize
transparent geometry in the form of clouds, dust and bright self-illuminated
particles. The main source of illumination is the shadowed directional light.
Unshadowed omni lights contribute to illumination as well, while a single
non-shadowed frustum light is used in a few scenes. The post-processing
effects include bloom, heat distortion, volume illumination and depth of
field.

Page 18 of 71
SCORING
Wild Life scoring
3DMark Wild Life produces an overall Graphics score and a Graphics test
score. The overall Graphics scores are rounded to the nearest integer.

Wild Life renders a demanding game-like scene in real time. The faster the
scene runs, the higher your benchmark score.

Overall Wild Life Graphics score

The overall 3DMark Wild Life score is based on the Graphics test score.

 3 = ℎ ∗

Where:

 ℎ = The average frame rate across the timeline
 = Scaling constant set to 167

Graphics test scoring

The Graphics Test score is a raw performance result in frames per second.

 ℎ =

Where:

 = The amount of rendered frames ignoring
frames from the first and last second in the timeline
 = The timeline runtime in seconds minus two
seconds for the ignored first and last second.

Page 19 of 71
Wild Life Stress Test scoring
The Stress Test reports the device stability and the scores for the best and
lowest loop.

 = 100 ∗ ( )

Where:

 = The lowest loop score

 = The highest loop score

Instead of producing a single score, the main result from the Wild Life Stress
Test is a chart that shows you how the device’s performance changed during
the test. This chart can help you understand how your device manages
performance and heat during heavy use.

Page 20 of 71
The FPS values are also recorded every second during the benchmark run.
Comparing the FPS data between loops gives additional insight into how
performance changes under longer periods of load.

Page 21 of 71
WILD LIFE ENGINE
3DMark Wild Life uses a cross-platform graphics engine optimized for
mobile devices and lightweight notebooks. The engine was developed in-
house with input from members of the UL Benchmark Development
Program.

The rendering, including scene update, visibility evaluation and command
recording is done with multiple CPU threads using one thread per available
logical CPU core. The purpose is to reduce CPU load by utilizing multiple
cores.

Graphics features
Clustered Light Culling

The scene lights are culled and stored in a three-dimensional screen space
grid. The light culling is done using the CPU before the rendering passes.

Geometry Rendering

Opaque objects are rendered using a deferred rendering method in the
graphics pipeline using temporary G-Buffer targets for PBR material
parameters. The shading is done using the clustered light information in
linear HDR color space utilizing temporary G-Buffer data. In addition to the
final lighting result, the deferred rendering pass outputs depth information
for other subsequent rendering effects.

Transparent objects are rendered in an order-independent way using two
passes. The first pass uses temporary targets to store accumulated color
contribution and transparency weighted based on linear depth and the total
transparency. The second pass calculates the final color from the
accumulated color and transparency. The result of the transparent objects
pass is blended on top of the final surface illumination.

Environment reflections are based on a single cube map. Geometry shaders
and tessellation are not supported.

Particles

Particles are simulated on the GPU using compute shaders. The particles
are self-illuminated. The particles are rendered at the same time with
transparent geometries using the same order-independent technique.

Page 22 of 71
Post-Processing
Heat Distortion

The heat distortion effect is generated with the use of particles. For particles
that generate the effect, a distortion field is rendered to a texture using a 3D
noise texture as input. This field is then used to distort the input image in
post processing phase.

Bloom

Bloom is based on a compute shader FFT that evaluates several effects with
one filter kernel. The effects are blur, streaks, anamorphic flare and
lenticular halo. Bloom is computed in reduced resolution to make it faster.

Volume illumination

Volume illumination is computed by approximating the light scattered
towards the viewer by the medium between eye and the visible surface on
each lit pixel. The approximation is based on volume ray casting and simple
scattering and attenuation model. One ray is cast on each lit pixel for each
light. The cast ray is sampled at several depth levels. The achieved result is
blurred before combining the volume illumination with the surface
illumination.

Depth of Field

The depth of field effect is computed by filtering rendered illumination in
half resolution with three separable skewed box filters that form hexagonal
bokeh pattern when combined. The filtering is performed in two passes that
exploit similarities in the three filters to avoid duplicate work.

The first pass renders to two render targets and the second pass the one
target combining results of the three filters. Before filtering, a circle of
confusion radius is evaluated for each pixel and the illumination is
premultiplied with the radius.

After filtering, illumination is reconstructed by dividing the result with the
radius. This makes the filter gather out of focus illumination and prevents it
from bleeding in focus illumination to neighbor pixels.

Page 23 of 71
WILD LIFE VERSION HISTORY

VERSION NOTES

1.0 ● ● ● Launch version

Page 24 of 71
HOW TO USE THE WILD LIFE APP
The 3DMark Wild Life app is built around data-driven stories that help you
learn more about your iPhone or iPad. These stories provide you with a
wealth of insights into the performance of your device, highlighting its
strengths and showing you how it compares with other models.

The new app has four main sections, which you can move between using
the navigation bar at the bottom of the screen.

• My tests
• My results
• My device
• Compare

Sharing your results
3DMark Wild Life makes it easy to save and share your results, comparisons,
charts, and many of the other screens in the app. Whenever you see the
share icon, tap it to share an image of the current card.

Page 25 of 71
MY TESTS
When you install the 3DMark Wild Life app, you get access to Wild Life
and Wild Life Stress Test. Swipe left to see other tests.

Wild Life and Wild Life Stress Test have two versions: the default run
and the Unlimited mode. Unlimited versions run off-screen.

You can enable the Unlimited mode by tapping the three-dot icon
next to the test name on the Benchmarks screen.

Page 26 of 71
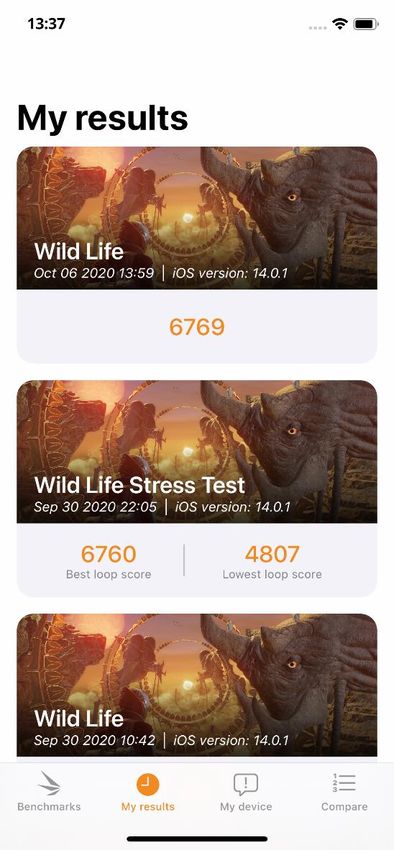
MY RESULTS
This screen lists all of your benchmark runs from your device. Tap on
a result card to open it and see the detailed result view.

The first card in the detailed results view shows your overall 3DMark
Wild Life score and the average frame rate. See earlier in this guide
for an explanation of how these scores are calculated.

3DMark also gives you much more. We use our extensive database of
results to show you exactly where your device stands in terms of
performance. Popular devices have tens of thousands of results from
the real world, where 3DMark is often run under less than ideal
conditions. These results provide a unique insight into your device’s
everyday performance outside of the test lab.

Page 27 of 71
Your score vs this model
This card shows you how your score compares with others from the
same model. It helps you answer the question, "Is my score a good
score for this device?" and "Is my device performing properly?"

The chart shows the range of scores for your device. The peaks show
the most common scores from other people with the same model.
The higher the peak, the more results there are around that score
value.

If the results tend to fall in the same narrow range, the device
performs consistently even when the benchmark is running under
less than ideal conditions.

Your score vs all devices
This card shows you how your score compares with the results from
all other devices. It helps you understand where your device sits in
the market from budget models to high-end models.

Page 28 of 71
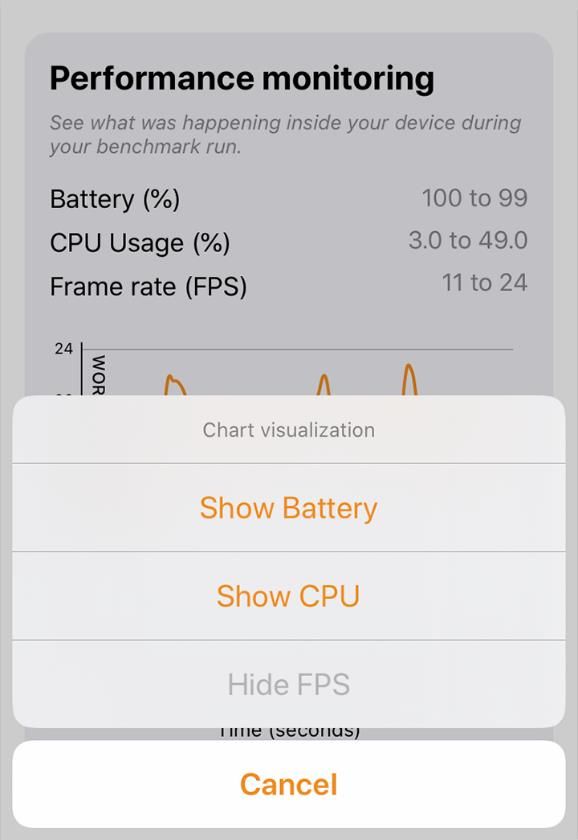
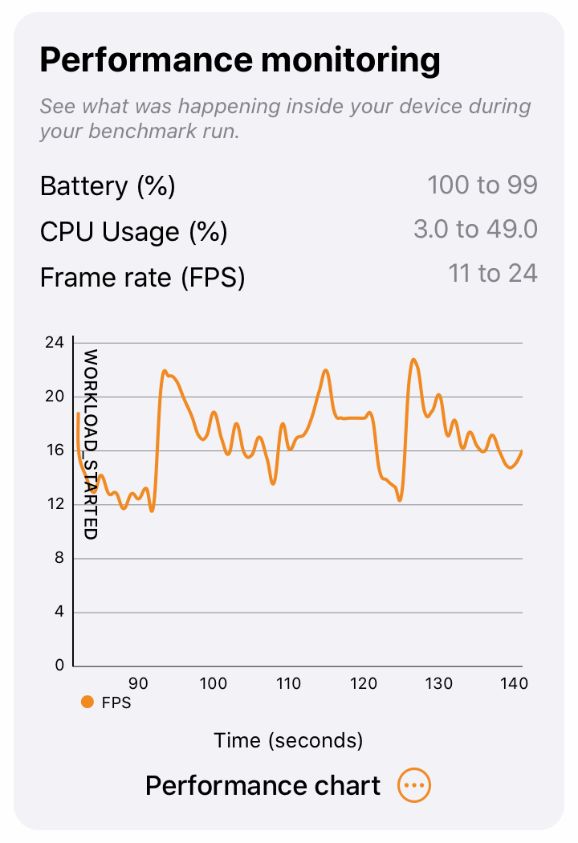
This card can be particularly helpful for seeing how older flagship
phones compare with the latest models.

Performance monitoring
This card shows you what was happening inside your device during
your benchmark run.

The data above the chart show the minimum and maximum values
from your run. The chart shows you how those values changed during
the run.

You can create your own custom chart view by showing or hiding FPS,
Battery and CPU usage data.

Page 29 of 71
Page 30 of 71
MY DEVICE
This part of the app helps you learn more about the performance of
your device. It helps you answer questions like, "How does my device
compare with the market?" and "Is my device sensitive to
overheating?" and "How has the performance of my device changed
with iOS updates?" This section also lists the main specifications for
your device.

Performance snapshot
This card tells you how your device ranks against other models and
how it compares with the average score for all devices tested in the
last quarter of the year.

The chart shows how your best result compares with the average
score for your model and with the average score from all devices
tested in the last quarter.

Performance range
The Performance Range chart shows the spread of scores for your
device. The peaks show the most common scores from other people
with the same model. You can also see how your best score for the
test compares.

Page 31 of 71
The shape of the chart tells you a lot about the performance of your
device. A narrow range means the device has consistent, stable
performance. A wide range of scores means that the device may slow
down when hot or multitasking. Lower scores may also come from
devices running an older iOS version.

Performance by OS version
iOS updates can breathe new life into older devices. New features
and interface design changes can give a device a fresh, modern feel.
Beneath the surface, driver optimizations and changes to the
operating system can improve performance, stability, and battery life.

This card shows how iOS updates have affected the performance of
your device. The chart shows the average benchmark score for each
iOS version available for your device.

Specification
This card shows the main technical specifications of the device, from
its hardware (SoC, CPU, GPU, RAM, storage) to screen (type, size,
resolution) to physical properties (dimensions, weight) and much
more, all on one screen.

Compare
This part of the app helps you compare the latest iPhone and iPad
models. You can search, filter, and sort our list of the best devices.
You can search for a device by name or by scrolling through the list.

Page 32 of 71
To find out more about a device, tap on its row to open a detailed
view that is similar to the My Device screen.

Compare list options
There is a separate list for each benchmark. Tap on Filters to select
the benchmark used for the list.

Tap on Filters to sort the list by score or alphabetically by device
name. Tap the sort icon to swap between ascending and descending
order. You can further filter the list for a specific iOS version.

How to compare two or more devices
It's easy to compare devices with 3DMark. Choose Select tap on
device images to select devices and then click Compare at the bottom
of the screen.

In the comparison view, you can select different tests by tapping on
the test name. The chart shows how the devices' average scores
compare.

You can also see the differences in hardware and specifications.
Comparing models has never been this easy.

Page 33 of 71
SETTINGS
Open the Settings screen from the info icon in the top-right corner of
the Benchmarks screen.

General
Shows the product name and the version number of the app.

You can change the language of 3DMark Wild Life by changing the
language of the device.

Support
You can access our User Guides or tap Report a problem to get help
from our support team.

Page 34 of 71
Page 35 of 71
SLING SHOT
Sling Shot is a cross-platform benchmark for mainstream mobile devices.
Use it to compare mainstream low-cost devices with older iPhone and iPad
models.

Use Sling Shot Extreme to compare the older Apple devices with
mainstream Android phones and tablets.

• Mobile-optimized rendering engine using OpenGL ES 3.x, Vulkan &
 Metal.
• Benchmark the GPU with Graphics tests and the CPU with the Physics
 test.

On iOS, Sling Shot and Sling Shot Extreme compatibility starts with iPhone
5s, iPad Air, iPad mini 2, and runs to the latest models.

Android devices must have Android 5.0 or later and support OpenGL ES 3.0
to run Sling Shot and Open GL ES 3.1 to run Sling Shot Extreme. An Android
device must have Android 7.0 or later and Vulkan compatible hardware to
run the Vulkan version of Sling Shot Extreme.

Page 36 of 71
SLING SHOT
Use 3DMark Sling Shot to compare low-cost Android smartphones and
tablets with older iPhone and iPad models.

Sling Shot is a demanding OpenGL ES 3.0 benchmark that tests the full
range of API features including multiple render targets, instanced rendering,
uniform buffers and transform feedback. It includes volumetric lighting and
particle illumination, as well as depth of field and bloom post-processing
effects.

The Graphics tests are rendered at 1920 × 1080 before being scaled to the
device's display resolution. The Physics test is rendered at 1280 × 720 to
ensure that GPU performance is not a limiting factor.

Use Sling Shot Unlimited to make chip-to-chip comparisons without
vertical sync, display resolution scaling and other operating system factors
affecting the result. Sling Shot Unlimited uses the same content and settings
as Sling Shot but runs offscreen using a fixed time step between frames. It
renders the same frames in every run on every device. The display is
updated with frame thumbnails every 100 frames to show progress.

Page 37 of 71
SLING SHOT EXTREME
Run Sling Shot Extreme to compare mainstream Android phones and
tablets with older Apple devices.

Sling Shot Extreme uses OpenGL ES 3.1 on Android and the Metal API on
Apple devices. It tests the full range of API features including multiple
render targets, instanced rendering, and uniform buffers. It also includes
volumetric lighting, depth of field and bloom post-processing effects using
Compute Shaders.

The Graphics tests are rendered at 2560 × 1440 then scaled to the device's
native display resolution. The Physics test is rendered at 1280 × 720 to
ensure that GPU performance is not a limiting factor.

Use Sling Shot Extreme Unlimited to make chip-to-chip comparisons
without vertical sync, display resolution scaling and other operating system
factors affecting the result. Sling Shot Extreme Unlimited uses the same
content and settings as Sling Shot Extreme but runs offscreen using a fixed
time step between frames. It renders the same frames in every run on every
device. The display is updated with frame thumbnails every 100 frames to
show progress.

Page 38 of 71
CROSS-PLATFORM BENCHMARKING
The rows in the table below show valid cross-platform comparisons, i.e. you
can compare Sling Slot scores across platforms, and you can compare Sling
Shot Extreme scores across platforms. But you cannot compare Sling Shot
scores with Sling Shot Extreme scores. Though they appear to be similar,
they use different rendering resolutions and post-processing techniques.

When comparing scores across platforms, note that the test results reflect
both hardware and software. APIs with low overhead, such as Metal and
Vulkan, can deliver more performance than OpenGL ES even on devices
with similar hardware.

 RENDERING
BENCHMARK ANDROID API IOS API
 RESOLUTION

SLING SHOT 1920 × 1080 Open GL ES 3.0 Open GL ES 3.0

SLING SHOT Open GL ES 3.1
 2560 × 1440 Metal
EXTREME Vulkan

Page 39 of 71
DEVICE REQUIREMENTS
Apple iOS

 SLING SHOT SLING SHOT EXTREME

OS iOS 9 iOS 9

MEMORY 1 GB 1.5 GB

GRAPHICS OpenGL ES 3.0 Metal

STORAGE 135 MB 135 MB

Page 40 of 71
DEFAULT SETTINGS

 SLING SHOT SLING SHOT EXTREME

RESOLUTION 1920 × 1080 2560 × 1440

GPU MEMORY BUDGET 1 GB 1.5 GB

BLOOM/FFT Using Pixel Shaders Using Compute Shaders

Page 41 of 71
GRAPHICS TEST 1
 Sling Shot Graphics test 1 has an emphasis on geometry processing while
 having simple shaders. Volumetric illumination is disabled, but the scene
 contains particle effects. FFT-based bloom effects and a depth of field effect
 are added as post processing steps. In Sling Shot Extreme, the bloom effects
 use Compute Shaders. In Sling Shot, they use Pixel shaders.

 • No volumetric illumination
 • Particle effects
 • Post-processing

 Processing performed in an average frame

 RESOLUTION2 VERTICES TRIANGLES PIXELS3

 SLING SHOT EXTREME 2560 × 1440 620,000 320,000 33.6 million

 SLING SHOT 1920 × 1080 620,000 320,000 20.4 million

2
 This is the resolution used to render the Graphics tests. The Physics test is rendered at 1280 x 720 to ensure
 that GPU performance is not a limiting factor.
3
 This figure is the average number of pixels processed per frame before the image is scaled to fit the native
 resolution of the device being tested. If the device’s display resolution is greater than the test’s rendering
 resolution, the actual number of pixels processed per frame will be even greater.

 Page 42 of 71
GRAPHICS TEST 2
 Sling Shot Graphics test 2 has shaders that are more mathematically
 complex than Graphics test 1, but has less geometry to process. Simple
 volumetric illumination is used, but the scene has no particle effects. Post
 processing steps are similar to Graphics test 1.

 • Volumetric illumination
 • No particle effects
 • Post-processing

 Processing performed in an average frame

 RESOLUTION4 VERTICES TRIANGLES PIXELS5

 SLING SHOT EXTREME 2560 × 1440 427,000 220,000 35.1 million

 SLING SHOT 1920 × 1080 427,000 220,000 20.8 million

4
 This is the resolution used to render the Graphics tests. The Physics test is rendered at 1280 x 720 to ensure
 that GPU performance is not a limiting factor.
5
 This figure is the average number of pixels processed per frame before the image is scaled to fit the native
 resolution of the device being tested. If the device’s display resolution is greater than the test’s rendering
 resolution, the actual number of pixels processed per frame will be even greater.

 Page 43 of 71
PHYSICS TEST
The test has three levels with different workloads. The first level is the
lightest and the last is the heaviest. The purpose of the three levels is to
extend the performance range for which the test is relevant.

The physics test is run with a fixed timestep at 30 FPS. The physics test
always begins with the first level and continues to the next level until either
the test is finished or 90 seconds have passed. If a level did not finish
completely, then it will contribute proportionally less to the final score. The
final score is a weighted sum of all levels.

The first level of the test has 8 simulation worlds running in separate
threads. Each world has one soft body with 107 vertices and 64 rigid bodies.
The rigid bodies are invisible and are there to cause the blast effect to soft
bodies. Additionally, there are 32 CPU simulated particle systems with about
500 particles in each.

The second level of the test adds 8 simulation worlds running in separate
threads. Each new world has one soft body with 499 vertices and
additionally 64 rigid bodies.

The third level of the test adds another 16 simulation worlds running in
separate threads. Each new world has one soft body with 499 vertices and
additionally 64 rigid bodies.

Each of the 32 worlds is simulated at 30 FPS and the whole test takes 16
seconds at 30 FPS. The first level starts at time 0, the second level starts at
time 5 and the third level at time 10.

All physics are computed on CPU. Soft body vertex data is updated to GPU
on each frame.

The Bullet Open Source Physics C++ Library version 2.83 alpha is used for
physics computation.

Page 44 of 71
SCORING
Sling Shot scores are rounded to the nearest integer. Higher is better.

Graphics Test scoring
Each of the Graphics Tests produces a raw performance result in frames per
second (FPS). A harmonic mean of the raw results is evaluated and
multiplied with a scaling constant to reach a Graphics score as follows:

 2
 ℎ = 230
 1 1
 1 + 2

Where:

 ℎ = Graphics score
 1 = Average frames per second in Graphics test 1
 2 = Average frames per second in Graphics test 2

The scaling constant is used to bring the score in line with traditional
3DMark score levels.

Physics Test scoring
The levels of the physics test produce a raw performance result in frames
per second (FPS). The score is defined as a sum of raw results from levels
that can be completed before a given time limit of 90 seconds. A scaling
constant is used to reach the final physics score.

The score is defined as follows:

 ℎ = 9 ( 1 1 + 2 2 + 3 3 )

Where:

 ℎ = Physics score
 ℎ = A scaling constant, set to 9
 = a frame rate normalization factor for level

The scaling constant is used to bring the score in line with traditional
3DMark score levels.

Page 45 of 71
 is defined as follows for the default version of the test:

 = max (0, min( ℎ ℎ, ))

Where:

 ℎ ℎ = A maximum frame rate limit set to 60
 = Average frames per second for the current level

And as follows for the Unlimited version of the test:

 = max (0, )

Where:

 = Average frames per second for the current level

The frame rate normalization factors 1 , 2 , and 3 are used to
normalize the frame rates of the different levels before using them in score
calculation. A set of reference CPUs is used to define the factors.

• 1 is always set to 1.
• 2 is the average relative frame rate difference of levels 1 and 2 on the
 reference CPUs.
• 3 is the average relative frame rate difference of levels 2 and 3 on the
 reference CPUs multiplied by 2 .

The following table lists the CPUs that are used as reference.

 LEVEL 1 LEVEL 2 RELATIVE
REFERENCE CPUS FOR NP2
 FRAME RATE FRAME RATE DIFFERENCE

Apple A7
 36.69 6.35 5.78
(iPhone 5s)

Qualcomm Snapdragon 800
 40.19 8.59 4.68
(LG Nexus 5)

Page 46 of 71
LEVEL 1 LEVEL 2 RELATIVE
REFERENCE CPUS FOR NP2
 FRAME RATE FRAME RATE DIFFERENCE

Qualcomm Snapdragon 805
 46.67 9.89 4.71
(Motorola Nexus 6)

Tegra K1
 59.05 20.59 2.87
(NVIDIA SHIELD)

AMD A4-5150M 112.36 13.57 8.28

 Level 2 Level 3 Relative
Reference CPUs for Np3
 frame rate frame rate difference

AMD A10-4600M 70.79 6.15 11.51

Intel Core i5-3317U 79.50 18.17 4.38

Intel Core i7 920 226.89 145.83 1.56

The following table defines values for the frame rate normalization factors.

 1 1.00

 2 3.26

 3 10.60

3DMark Sling Shot score
The 3DMark Sling Shot and Sling Shot Extreme score is formed from the
Graphics score and Physics score using a weighted harmonic mean as
follows:

 ℎ + ℎ
 3 =
 ℎ ℎ
 ℎ + ℎ

Page 47 of 71
Where:

 ℎ = the weight for the Graphics score, set to 7/9
 ℎ = the weight for the Physics score, set to 2/9

 ⚠ Even though the tests appear to be similar, Sling Shot scores
 should not be compared with scores from Sling Shot Extreme.
 The two tests use different rendering resolutions and post-
 processing techniques making their scores incomparable.

Page 48 of 71
SLING SHOT ENGINE
Rendering
Multithreading

The engine utilizes one thread per available CPU core. One of the threads is
considered as the main thread, which makes the graphics API calls. The
other threads are worker threads, which do not make API calls.

The rendering workload is distributed between the threads by distributing
items (e.g. geometries and lights) in the rendered scene to the threads. Each
thread is assigned roughly equal amount of scene items. When rendering a
frame, each thread does the work associated to items assigned to the
thread. That includes, for example, computation of transformation matrix
hierarchies and computation of shader parameters (constants buffer
contents and dynamic vertex data). When the main thread is finished with
the tasks associated to its own items, it executes API calls for items assigned
to the worker threads.

Lighting

Lighting is done in deferred style. Geometry attributes are first rendered to
a set of render targets. Finally illumination is rendered based on those
attributes.

Surface illumination

The g-buffer is composed from two 32 bits per pixel textures and a depth
texture. Surface illumination model the basic Blinn Phong reflectance
model.

Point, spot and directional lights are supported. Spot and directional lights
can be shadowed. For spot lights, shadow texture size is selected based on
size of the light volume in screen space. Shadow maps are sampled using
best candidate sample distribution. Sample pattern is dithered with 4x4
pixel pattern.

Volumetric illumination

The renderer supports volume illumination. It is computed by
approximating the light scattered towards the viewer by the medium
between eye and the visible surface on each lit pixel. The approximation is
based on volume ray casting and simple scattering and attenuation model.

One ray is cast on each lit pixel for each light. The cast ray is sampled at
several depth levels. Sampling quality is improved by dithering sampling
depths with a 4x4 pixel pattern. The achieved result is blurred to combine

Page 49 of 71
the different sampling depths on neighboring pixels before combining the
volume illumination with the surface illumination.

When rendering illumination, there are two high dynamic range render
targets. One is for surface illumination and the other for volume
illumination.

Particle illumination

Particle effects are rendered on top of opaque surface illumination with
additive or alpha blending. Particles are simulated on the GPU utilizing
transform feedback. Particles are simply self-illuminated.

Post-processing
Depth of field

The effect is computed by filtering rendered illumination in half resolution
with three separable skewed box filters that form hexagonal bokeh pattern
when combined.

The filtering is performed in two passes that exploit similarities in the three
filters to avoid duplicate work.

The first pass renders to two render targets and the second pass the one
target combining results of the three filters. Before filtering, a circle of
confusion radius is evaluated for each pixel and the illumination is
premultiplied with the radius.

After filtering, illumination is reconstructed by dividing the result with the
radius. This makes the filter gather out of focus illumination and prevents it
from bleeding in focus illumination to neighbor pixels.

Bloom

The effect is computed by transforming the computed illumination to
frequency domain using Fast Fourier Transform (FFT) and applying a bloom
filter to the input in that domain. An inverse FFT is then applied to the
filtered image.

The forward FFT, applying the bloom filter and inverse FFT are done using
the fragment shader. The FFT is performed with Cooley-Tukey algorithm as
a series of render passes.

The effect is computed in 256 × 256 resolution in both Sling Shot and Sling
Shot Extreme. In Sling Shot, the FFTs are computed using 16-bit floating
point textures. In Sling Shot Extreme, the FFTs are computed using 32-bit
floating point textures. A procedurally pre-computed texture is used as the

Page 50 of 71
bloom filter. The filter combines blur, streak, lenticular halo and anamorphic
flare effects.

With Sling Shot Extreme, Compute Shaders are used for the FFT and bloom.
A total of 256 invocations within a work group is required.

Page 51 of 71
SLING SHOT VERSION HISTORY

VERSION NOTES

2.3 ✕ ● ✕ Added Vulkan version of Sling Shot Extreme.

 Fixed a Physics test bug introduced in 3DMark
 Sling Shot iOS app version 1.0.745. Scores from
2.2 ✕ ✕ ●
 2.2 are again comparable across platforms and
 devices.

 Improved compatibility with ARM Mali GPUs.
2.0 ✕ ● ● Scores from v2.0 are not comparable with v1.0
 results.

1.0 ✕ ● ✕ Launch version

Page 52 of 71
Page 53 of 71
API OVERHEAD FEATURE TEST
Feature tests are special tests designed to highlight specific techniques,
functions or capabilities. A 3DMark feature test differs from a 3DMark
benchmark in that the nature of the test may be necessarily artificial rather
than based on real-world uses and applications.

Even so, feature tests are designed such that performance improvements in
the test should benefit other applications as well, i.e. any driver optimization
that results in improved performance in the API Overhead feature test will
also benefit other games and applications.

The 3DMark API Overhead feature test is an impartial test for measuring
and comparing the performance of the latest graphics APIs.

DIRECTX 12 ● ✕ ✕

DIRECTX 11 ● ✕ ✕

VULKAN ● ● ✕

OPENGL ES 3.0 ✕ ● ●

METAL ✕ ✕ ●

New low-overhead APIs like Vulkan, DirectX 12 and Metal make better use of
multi-core CPUs to streamline code execution and eliminate software
bottlenecks, particularly for draw calls.

A draw call happens when the CPU tells the GPU to draw an object on the
screen. Games typically make thousands of draw calls per frame, but each
one creates performance-limiting overhead for the CPU.

As the number of draw calls rises, graphics engines become limited by API
overhead. APIs like Vulkan, DirectX 12 and Metal reduce that overhead
allowing more draw calls. With more draw calls, the graphics engine can
draw more objects, textures and effects to the screen.

The 3DMark API Overhead feature test measures API performance by
making a steadily increasing number of draw calls. The result of the test is

Page 54 of 71
the number of draw calls per second achieved by each API before the frame
rate drops below 30 FPS.

Page 55 of 71
CORRECT USE OF THE API OVERHEAD
FEATURE TEST
The API Overhead feature test is not a general-purpose GPU benchmark,
and it should not be used to compare graphics cards or mobile devices from
different vendors.

The test is designed to make API overhead the performance bottleneck. It
does this by maximizing the number of draw calls in a scene, (by drawing a
huge number of individual ‘buildings’), while minimizing the GPU load, (by
using simple shaders and no lighting effects). This an artificial scenario that
is unlikely to be found in games, which typically aim to achieve high levels of
detail and exceptional visual quality.

The benefit of reducing API overhead is greatest when the CPU is the
limiting factor. With modern APIs and fast CPUs, the test can become GPU
bound, but not always in a way that is meaningful from a general GPU
performance perspective. The point at which the test moves from being
CPU-bound to GPU-bound changes from system to system. It is not easy to
tell from the test results whether the run was CPU or GPU limited. And
what's more, it is difficult to isolate the relative impact of GPU performance
and driver performance.

As a result, you should be careful making conclusions about GPU
performance when comparing API Overhead test results from different
systems. For instance, we would advise against comparing the Vulkan score
from an Android device with the Metal score from Apple device. Likewise, it
could be misleading to credit the GPU for any difference in OpenGL ES 3.0
performance between different vendors’ GPUs.

The proper use of the test is to compare the relative performance of each
API on a single system or device, rather than the absolute performance of
different systems and devices.

The focus on single-system testing is one reason why the API Overhead test
is called a feature test rather than a benchmark.

Page 56 of 71
SYSTEM REQUIREMENTS
Apple iOS
The 3DMark API Overhead app requires iOS 8.0 or later. Compatibility starts
with iPhone 5s, iPad Air, iPad mini 2, and runs to the latest models. The app
requires 33 MB of free storage space.

Page 57 of 71
TECHNICAL DETAILS
The test is designed to make API overhead the performance bottleneck. The
test scene contains a large number of geometries. Each geometry is a
unique, procedurally-generated, indexed mesh containing 112 -127
triangles.

The geometries are drawn with a simple shader, without post processing.
The draw call count is increased further by drawing a mirror image of the
geometry to the sky and using a shadow map for directional light.

The scene is drawn to an internal render target before being scaled to the
back buffer. There is no frustum or occlusion culling to ensure that the API
draw call overhead is always greater than the application side overhead
generated by the rendering engine.

Starting from a small number of draw calls per frame, the test increases the
number of draw calls in steps every 20 frames, following the figures in the
table below.

To reduce memory usage and loading time, the test is divided into two
parts. On iOS, the first part runs until 12,288 draw calls per frame. The
second part starts from the beginning on all platforms.

 DRAW CALLS PER FRAME ACCUMULATED DURATION
DRAW CALLS PER FRAME
 INCREMENT PER STEP IN FRAMES

192 – 384 12 320

384 – 768 24 640

768 – 1536 48 960

1536 – 3072 96 1280

3072 – 6144 192 1600

6144 – 12288 384 1920

12288 – 24576 768 2240

24576 – 49152 1536 2560

Page 58 of 71
DRAW CALLS PER FRAME ACCUMULATED DURATION
DRAW CALLS PER FRAME
 INCREMENT PER STEP IN FRAMES

49152 – 98304 3072 2880

98304 – 196608 6144 3200

196608 – 393216 12288 3520

Geometry batching
To improve content streaming performance, reduce API overhead and
shorten loading times, games often batch geometries together by storing
the vertex data for a group of geometries in a single, large buffer.

Allocating one large buffer is faster than allocating several small buffers.
And uploading the contents of one large buffer from the CPU to the GPU is
faster than uploading the contents of several small buffers.

In games and other real-world applications, the extent to which batching is
possible depends on many factors. API overhead is reduced if consecutive
draw calls can use the same buffer and there is no buffer changing
operation required between draw calls.

The 3DMark API Overhead feature test makes a vertex buffer change
operation on every tenth draw call. This represents neither the worst case
nor the optimal scenario and was chosen to best reflect the nature of real-
world workloads.

For fairness, we use the same batching and buffer management code on all
platforms. Some platforms restrict the minimum size of buffer allocations,
which in practice requires applications to store the data for smaller
geometries together in large buffers. Therefore, the test uses large buffers
to hold the data for several geometries.

Page 59 of 71
METAL PATH
All lighting draw calls use the same primitive topology, render pipeline state,
and other graphics rendering state. The following Metal API calls are made
for each lighting draw call:
 setVertexBuffer:
 setVertexTexture:
 setFragmentBuffer:
 setFragmentTexture:
 drawIndexedPrimitives:

All shadow map draw calls use the same primitive topology, render pipeline
state, and other graphics rendering state. On each shadow map draw call,
the following Metal API calls are made:
 setVertexBuffer:
 drawIndexedPrimitives:

OpenGL ES 3.0 is only used in single-threaded mode, where the draw calls
for all geometries are made first for the shadow map pass and then for the
lighting pass.

Page 60 of 71
OPENGL ES 3.0 PATH
All lighting draw calls use the same primitive topology, shader program, and
other graphics rendering state. The following OpenGL ES 3.0 API calls are
made for each lighting draw call:
 glActiveTexture()
 glBindTexture()
 glBindSampler()
 glBindBufferRange()
 glBindVertexArray()
 glDrawElements()

All shadow map draw calls use the same primitive topology, shader
program, and other graphics rendering state. On each shadow map draw
call, the following OpenGL ES 3.0 API calls are made:
 glBindBufferRange()
 glBindVertexArray()
 glDrawElements()

OpenGL ES 3.0 is only used in single-threaded mode, where the draw calls
for all geometries are made first for the shadow map pass and then for the
lighting pass.

Page 61 of 71
SCORING
The test increases the number of draw calls per frame in steps, until the
frame rate drops below 30 frames per second.

Note that if a single frame takes more than 3 times as long to render than
the average time for the 20 previous frames, it is treated as an outlier and
ignored. This is necessary because the first frame after raising the draw call
count sometimes has a longer frame time, which would cause the test to
end earlier than it should.

Once the frame rate drops below 30 frames per second, the number of
draw calls per frame is kept constant and the average frame rate is
measured over 3 seconds.

This frame rate value is then multiplied by the number of draw calls per
frame to give the result of the test: the number of draw calls per second
achieved by each API.

 ⚠ The API Overhead feature test is not a general-purpose GPU
 benchmark, and it should not be used to compare graphics
 cards from different vendors. The proper use of the test is to
 compare the relative performance of each API on a single
 system, rather than the absolute performance of different
 systems.

Page 62 of 71
API OVERHEAD VERSION HISTORY

VERSION NOTES

1.0 Launch version

Page 63 of 71
HOW TO REPORT SCORES 3DMark includes many tests, each designed for a specific type of device. Make sure you use the most appropriate test for the device. Each test gives its own score, which you can use to compare similar devices.. There is no overall 3DMark score. Scores from different tests are not comparable. Do not use 3DMark as a unit of measurement. "Smartphone scores 2,000 in the Sling Shot Extreme benchmark." "The smartphone scores 2,000 3DMarks." Always include details of the device used to obtain the score. Be sure to include the OS version and the exact device model. Delisted Devices We have rules for manufacturers and developers that specify how a platform can interact with our benchmark software. When a device is suspected of breaking those rules it is delisted. Scores from delisted devices are not shown in the Hardware Channel and should not be used to compare devices. Using 3DMark scores in reviews We provide complimentary Professional Edition benchmarks to members of the press working for established and reputable publications. Contact us at UL.BenchmarkPress@ul.com to request keys for your publication. Press can use our benchmark scores in their hardware reviews. We kindly ask you to include a link to https://benchmarks.ul.com/ whenever you use our benchmarks in a review, feature or news story. Using 3DMark scores in marketing material For business purposes, a commercial license is granted with the purchase of 3DMark Professional Edition or through our site licensing program. ⚠ You must not disclose or publish 3DMark benchmark test results, nor may you use the UL logo or other UL assets in your sales and marketing materials, without prior, written permission from UL. Please contact UL.BenchmarkSales@ul.com for details. Page 64 of 71
On the first mention of 3DMark in marketing text, such as an advertisement
or product brochure, please write "3DMark benchmark" to protect our
trademark.

"We recommend 3DMark® benchmarks from UL."

Please include our legal text in your small print.

3DMark® is a registered trademark of Futuremark Corporation.

Page 65 of 71
RELEASE NOTES

IOS EDITION - 3DMARK WILD LIFE APP
3DMark Wild Life iOS Edition v1.0.200 – October 22, 2020
This is a minor update. Benchmark scores are not affected.

Fixed

• Minor bug fixes and UI improvements.

3DMark Wild Life iOS Edition v1.0.187 – October 15, 2020
• Launch version.

Page 66 of 71
IOS EDITION - 3DMARK SLING SHOT APP
3DMark Sling Shot iOS Edition – October 23, 2020
This is a minor update. Benchmark scores are not affected.

Improved

• Improved compatibility with the latest models.

3DMark Sling Shot iOS Edition – January 14, 2020
This update marks the end of support for 3DMark Ice Storm benchmarks.
These tests no longer provide useful results with modern iOS devices. Ice
Storm results and links have been removed from this app.

3DMark Sling Shot iOS Edition 1.0.745 – April 18, 2016
Fixed

This update fixes a bug from the previous release (1.0.734) that inflated
Physics test scores. Scores from this version are again comparable across all
compatible platforms and devices.

3DMark Sling Shot iOS Edition 1.0.734 – March 29, 2016
New

Added Sling Shot Extreme, a more demanding test for the latest high-end
smartphones and tablets. Sling Shot Extreme uses Apple's Metal API and a
2560 × 1440 rendering resolution. You can compare Sling Shot Extreme
scores across platforms.

Improved

• UI improvements.

3DMark Sling Shot iOS Edition v1.0.484 – October 16, 2015
• Launch version.

Page 67 of 71
You can also read