Monitoring of Erosive Tooth Wear with Intraoral Scanners In vitro
←
→
Page content transcription
If your browser does not render page correctly, please read the page content below
Research Article

                                                               Caries Res 2021;55:215–224                                                                Received: March 31, 2020
                                                                                                                                                         Accepted: January 13, 2021
                                                               DOI: 10.1159/000514666                                                                    Published online: March 22, 2021

Monitoring of Erosive Tooth Wear with
Intraoral Scanners In vitro
Corinna Witecy a Carolina Ganss a Bernd Wöstmann b Moritz B. Schlenz b
Maximiliane A. Schlenz b
a Department
               of Conservative and Preventive Dentistry, Justus Liebig University Giessen, Giessen, Germany;
b Department
               of Prosthodontics, Justus Liebig University Giessen, Giessen, Germany

Keywords                                                                                           tion of the load-bearing cusps of the model teeth with a
Erosive tooth wear · Intraoral scanner · Profilometry ·                                            spherical diamond bur, and the maximum vertical depth af-
Monitoring                                                                                         ter each preparation step was measured only by IOS. Trios3
                                                                                                   (3Shape, Denmark), Carestream CS3600 (Carestream, USA)
                                                                                                   and an optical profilometer (MicroProf, Fries, Germany) were
Abstract                                                                                           used to measure the flat areas of the enamel samples, where-
Intraoral scanners (IOS) have been used to quantify tooth                                          as only IOS were used to measure curved surfaces on the
wear, but so far they have not been systematically validated                                       load-bearing cupped cusps of the model teeth. The IOS data
for monitoring of tissue loss. The aim of this in vitro study was                                  were analyzed with an external software (GOM Inspect, Ger-
to investigate whether progression of tissue loss can be de-                                       many) and with the respective internal IOS software. PRO re-
tected with an IOS and whether IOS values agree with those                                         vealed a mean (±SD) tissue loss of 17.1 ± 4.7 µm after 30-s
obtained with noncontacting profilometry (PRO) serving as                                          etching steps and 10.1 ± 5.1 µm after the 15-s etching steps.
a standard method. Model jaws were mounted in a phantom                                            IOS and software types were able to detect the progression
head positioned in a dental chair. Flattened areas were pre-                                       of tissue loss after each etching step (p ≤ 0.001 each); Bland-
pared on the non-load-bearing cusps of the first molars                                            Altmann plots revealed good agreement with PRO regard-
(model teeth; n = 16) in order to fix flat enamel samples with                                     less of the order of tissue loss, and no systematic difference
an experimental area and a reference area. After baseline                                          was found. Increasing cupped lesion depths were detected
PRO and IOS, the experimental enamel area was stepwise                                             by all IOS, with no significant differences between IOS and
etched with 35% H3PO4 gel (4 × 30 s and 4 × 15 s). After each                                      analysis methods. IOS were able to detect small amounts of
etching, PRO and IOS was performed and the vertical tissue                                         tissue loss under simulated clinical conditions and seem to
loss between the reference and experimental areas was                                              be a promising tool for monitoring even initial erosive tooth
measured, each at the same 3 measurement points. Further-                                          wear.                                   © 2021 The Author(s)
more, cupped cusps were simulated by stepwise prepara-                                                                                                   Published by S. Karger AG, Basel

karger@karger.com        © 2021 The Author(s)                                                      Corinna Witecy
www.karger.com/cre       Published by S. Karger AG, Basel                                          Department of Conservative and Preventive Dentistry
                         This is an Open Access article licensed under the Creative Commons
                                                                                                   Justus Liebig University Giessen, Schlangenzahl 14
                         Attribution-NonCommercial-4.0 International License (CC BY-NC)            DE–35392 Giessen (Germany)
                         (http://www.karger.com/Services/OpenAccessLicense), applicable to         corinna.witecy @ dentist.med.uni-giessen.de
                         the online version of the article only. Usage and distribution for com-
                         mercial purposes requires written permission.
Introduction Therefore, it was the primary aim of the present study
to investigate whether IOS can detect the progression of
Erosive tooth wear is an increasingly important oral tissue loss after consecutive steps of short acid etching of
health issue [Schlueter and Luka, 2018]. Therefore, sensi- prepared flat enamel samples. Two different IOS were
tive methods for early detection, individual monitoring, used in a simulated clinical setting. The resulting 3-D data
and gathering of incidence data, as well as for clinical sets were analyzed with an external laboratory software as
studies on the effects of therapeutic agents and behavior well as with the respective internal software using the
change strategies, are urgently required. An established measurement tools of the IOS. The standard method for
method for recording erosive tooth wear consists of the comparison was profilometry (PRO).
use indices, which usually combine diagnostic criteria A secondary aim was to examine whether the different
and scores for grading the severity of lesions. The litera- IOS as well as the different types of software were suitable
ture provides a large number of such index systems, but for monitoring of the progression of cupped lesions on
none has gained general acceptance [Bardsley, 2008]. A cusps, typical of erosive tooth wear, which were simulated
more recent suggestion of a standardized, validated index by manual preparation of model teeth.
and a simple tool for clinical practice is the Basic Erosive
Wear Examination (BEWE) [Bartlett et al., 2008], which
has been used clinically but also to monitor erosive wear Materials and Methods
on study casts and their 3-D images [Alaraudanjoki et al., Preparation of Enamel Samples
2017; Marro et al., 2018, 2020; Wohlrab et al., 2019]. Human caries-free third molars extracted for therapeutic rea-
However, all of these index systems are semiquantita- sons were collected. After cleaning, the teeth were stored in satu-
tive, making quantification and monitoring of early ero- rated aqueous thymol solution (Sigma-Aldrich Chemie GmbH,
sive tooth wear in the order of micrometers difficult. An Steinheim, Germany) at 4 ° C. From the smooth surfaces, approxi-
mately 1-mm-thick longitudinal slices were prepared, ground flat,
attempt to overcome this problem consisted of using ac- polished (diamond grinding and polishing discs of 30, 15, and 3
id-resistant markers adhesively bonded to the eroded µm; Bühler GmbH, Düsseldorf, Germany), and cut, resulting in
tooth surface serving as reference for profilometric mea- enamel samples of 4 × 3 mm (n = 16).
surements [Bartlett et al., 1997; Schlueter et al., 2005]. For a reproducible highly standardized test setup, 4 grooves
However, the method is time consuming, has problems (mesial, distal, oral, and buccal) were prepared with a diamond
disc (ISO 806104317524220; Gebr. Brasseler GmbH & Co. KG,
with marker retention, and lacks patient compliance. Lemgo, Germany) on each enamel sample, serving as reference
A more suitable method would be to capture 3-D im- points (Fig. 1a).
ages using scanners, which has already been suggested as Samples were checked for cracks and damage under a stereo
the preferred method for measurement of tooth wear microscope (×10 magnification, Nikon SMZ-2T; Tokyo, Japan).
[DeLong, 2006]. To monitor wear in various contexts, the The bottom sides of the enamel samples were etched with 35%
H3PO4 gel for 30 s (iBond etch 35; Kulzer GmbH, Hanau, Ger-
majority of studies have used 3-D datasets of study mod- many), cleaned under running distilled water, and gently air dried.
els [Wulfman et al., 2018; O’Toole et al., 2019a; Marro et
al., 2020]. However, dimensional changes in the materials Fixing the Enamel Samples on the Model Teeth
might affect the accuracy, especially at the micrometer First, 4 first molar model teeth (ANA-4; frasaco GmbH,
level. Furthermore, this indirect measurement requires a Tettnang, Germany; FDI 16, 26, 36, and 46) were prepared. The
non-load-bearing cusp of each model tooth was flattened with a
complex laboratory set-up with a model scanner, inspec- diamond bur (ISO 806104140524880/018; Busch, Engelskirchen,
tion software, and expert skills. Germany) and the teeth were mounted in the corresponding upper
Meanwhile, IOS have been developed from the restor- or lower model jaw (ANA-4; frasaco GmbH), simulating a com-
ative field to diagnostic instruments, as some manufac- plete dentition. Then an enamel sample was luted with composite
tures have implemented an additional software applica- (Venus Diamond Flow; Heraeus Kulzer, Hanau, Germany) on the
flattened area of each model tooth (Fig. 1a). While mounted with
tion that allows chairside alignment of 2 datasets in the the uncured composite, profilometric traces were made on each
IOS software. Thus, IOS have been used for direct wear enamel sample until it was assured that the enamel sample was
measurements in vitro [Meireles et al., 2016; Hartkamp et positioned in parallel to the profilometer table and then fixed by
al., 2017b; Kumar et al., 2019] and in vivo [Hartkamp et light curing (120 s, Excelite-S white; Jovident GmbH, Duisburg,
al., 2017a]. Germany). Four model jaw sets were created.
So far, however, intraoral scanning has not been sys- Experimental Procedure
tematically validated for detection and monitoring of small At first, baseline profilometric measurements of the enamel
amounts of tissue loss in the context of erosive tooth wear. samples were made. To simulate a real patient situation, the mod-
216 Caries Res 2021;55:215–224 Witecy/Ganss/Wöstmann/Schlenz/
DOI: 10.1159/000514666 Schlenzjaws were removed from the phantom head, and PRO of the enam-
o el samples was done. Subsequently, the enamel samples were
etched and the cusps prepared again, and the model jaws were re-
MP1 placed in the phantom head. This procedure was repeated 4 times
1 mm
MP2 (T1 to T4). After T4, the enamel etching time was reduced to 15 s
m d
while all other procedures were kept constant and the procedure
MP3
1 mm was repeated an additional 4 times (T5 to T8).
a 1 mm b Measurement of Enamel Loss
Profilometric measurements were done with a noncontact opti-
500 µm cal device (MicroProf; Fries Research & Technology GmbH, Ber-
gisch-Gladbach, Germany; sensor HO, 200 pixels, 32 Hertz, vertical
range of measurement: 300 µm, vertical resolution: 10 nm, lateral
Vertical distance resolution: 1–2 µm). Three traces at intervals of 1 and 3 mm in
length were made and interpreted with special software (Mark III,
Fries Research & Technology GmbH). On the traces, regression
b 1 mm lines 0.5 mm in length and 1 mm apart from the border of the ref-
erence and the experimental area were constructed on both areas
(Fig. 1b). After orientation on the x and y coordinates, tissue loss
Fig. 1. a Schematic drawing of an enamel sample (occlusal perspec- (µm) was defined as the vertical distance of the regression lines. For
tive). Reference grooves were prepared on the oral (o), buccal (b), a reproducible highly standardized test setup, all measurements of
mesial (m), and distal (d) sides. The measuring areas were orient- the flat enamel samples were taken at the same 3 measurement
ed in line with the m/d grooves as well as 1 mm apart in both the points (MP1, MP2, and MP3). The 3 measuring points were defined
oral and buccal directions. The 3 measuring points (MP1, MP2, as intersections between constructed guides on each sample. The
and MP3) were located on the measurement areas 1 mm apart distance between the 3 measurement points, the outer borders, and
from the border between the experimental area (light grey) and the the border between the experimental area (light grey) and the refer-
reference area (dark grey) of the enamel sample; b Schematic ence area (dark grey) of the enamel sample was 1 mm (Fig. 1a).
drawing of profilometric writing with the corresponding evalua- Datasets of the IOS (T0 to T8) from TRI and CAR were ana-
tion area (buccal-oral perspective). Two regression lines were cre- lyzed with an external 3-D measurement software (TRIe and
ated 1 mm apart from the border of the reference and the experi- CARe) as well as with the internal software using measuring tools
mental area. Tissue loss (µm) was defined as the vertical distance of the IOS (TRIi and CARi).
of the regression lines. For the former analysis with external software, data sets from
IOS were exported in standard tessellation language to GOM In-
spect 3-D software (version V8 SR1; GOM GmbH, Braunschweig,
Deutschland) and reduced to the area of interest (first molar).
el jaws were mounted in a frasaco phantom head (P-6/5 HGB) Then, scans were analyzed by superimposition of the baseline scan
equipped with a face mask (P-6 GMN). The phantom head was (T0) with each of the consecutive datasets (T1 to T8) using best-fit
placed in a phantom torso (P-6-TSE) which was mounted in a den- alignment (iterative closest point technique). Only 2 datasets were
tal chair for intraoral scanning. Two different IOS (TRI: Trios 3, superimposed at one time (e.g., T0 and T1, T0 and T2, T0 and T3,
version 1.18.2.10, 3Shape, Copenhagen, Denmark; CAR: Care …,T0 and T8). Construction tools such as planes in the 3-D soft-
stream CS3600, version 3.1.0, Carestream Dental LLC, Atlanta, ware were used to define the exact measurement points (MP1,
GA, USA) were used. The scan area included the first molars with MP2, and MP3) on the baseline dataset (T0) to ensure a standard-
the mesial and distal adjacent teeth. The same scanning protocol ized measurement. The maximum vertical loss (µm) for the etched
was used for all scanning procedures, beginning with the occlusal area of enamel was measured at the measuring points (MP1–3) as
and oral surface followed by the buccal surface [Müller et al., 2016]. described in Figure 1.
Before scanning, TRI was calibrated using the respective calibra- The internal software of both IOS was used for superimposing
tion device based on the manufacturer’s instructions. For CAR, no the follow-up scans with the baseline scans as described for the
calibration was necessary. external analysis, and the respective measuring tools were used to
After baseline PRO and intraoral scanning (T0), enamel loss determine the enamel loss (µm) at the same measurement points
was created. To protect the reference area, a transparent tape (te (MP1–3) as described above.
safilm; Global Headquarters – tesa SE, Norderstedt, Germany) was
applied under a surgical microscope (×5 magnification,; Carl Zeiss Measurement of Cusp Loss
Surgical GmbH, Oberkochen, Germany). Then the experimental The maximum depth (µm) of the cupped lesion of the cusps
area was etched with 35% H3PO4 gel for 30 s, cleaned under run- (cusp loss) was measured on the 3-D datasets obtained from the 2
ning distilled water for 30 s, and gently air dried. Afterward, the IOS either with GOM or with the respective internal software and
tape was removed. measuring tools of the IOS. PRO was not performed.
In addition, a cup was prepared on the mesial load-bearing
cusps of each first molar model tooth using a spherical diamond Reproducibility
bur (ISO 806104001524018; Busch) under constant water cooling. Before starting the experimental procedure, the reproducibility
After that, the teeth were scanned as described above, the model was determined. One additional enamel sample was prepared,
Monitoring Erosive Tooth Wear with IOS Caries Res 2021;55:215–224 217
DOI: 10.1159/000514666T0–T4
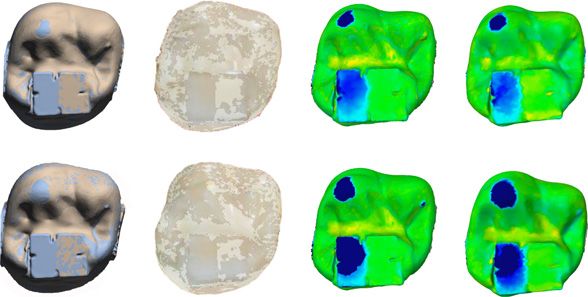
Fig. 2. Representative illustration of the su-
perimposed data sets from a right upper
first molar showing the difference from T0
to T4 (top) and from T0 to T8 (bottom) as
obtained from the 2 scanner types (TRI and T0–T8
CAR) and from the external (e) and inter-
nal (i) software. Differences between the
experimental (left) and the reference
(right) areas of the enamel sample as well TRIi CARi TRIe CARe
as of the cup on the load bearing cusp can
be clearly seen.
Table 1. Reproducibility of results from
10 repeated measurements of the same PRO TRIe CARe TRIi CARi
sample obtained from the 2 IOS types and
from the external and internal software Mean ± SD, µm 34.2±0.3 23.9±2.4 25.8±3.0 23.0±3.7 22.3±3.7
99% CI 33.9–34.5 21.4–26.3 22.7–28.9 19.2–26.8 18.8–25.7
mounted on a model tooth in a complete jaw model as described ues had an effect on agreement (proportional difference), and one-
before, and, after baseline measurements, etched with phosphoric sample t tests of the mean differences of values obtained from the
acid for 60 s. To simulate a comparable experimental procedure, 4 methods with values from PRO were conducted to evaluate
measurements were taken beginning with PRO, followed by whether there was a systematic difference.
mounting of the model in a phantom head and taking of intraoral
scans with Trios 3 and CS3600. After the last measurement, the Cusp Loss
models were removed from the phantom head and the whole pro- Cusp loss was determined as the maximum depth of the cupped
cedure was repeated 10 times with all 3 devices (PRO, TRI, and lesion (µm). Within-method comparisons of cumulative loss val-
CAR). Loss values as well as 99% CI are given in Table 1. ues from T1 to T8 were done with t tests for dependent samples.
In addition, as described above, differences from the respective
Statistics previous value were calculated to describe the loss occurring from
Statistics were done with IBM SPSS Statistics version 25 (IBM each preparation step. The cusp loss occurring after each prepara-
Germany GmbH, Ehningen, Germany). All data were checked for tion step obtained from the 2 IOS and software types (TRIe, CARe,
deviations from a Gaussian distribution (Kolmogrorov-Smirnov TRIi, and CARi) was compared by t tests for dependent samples
test). As there were no significant deviations, parametric proce- (between-method comparisons).
dures were used for all comparisons. Values are given as means ±
SD. p < 0.05 was considered statistically significant.
Enamel Loss Results
The loss of a sample was expressed as the mean of 3 measure-
ments (µm; MP1–3). Within-method comparisons of cumulative Enamel Loss
loss values from T1 to T8 were done with t tests for dependent
samples. In addition to the cumulative loss values, their differenc- Figure 2 shows an example of the superimposed data
es from the respective previous value were calculated to describe sets from the 2 IOS as well as from the external and inter-
the loss occurring from each etching step. One-sample t tests and nal analyses.
99% CI were used to investigate whether these differences were The data for the cumulative enamel loss from T1 to T8
different from zero. Bland-Altman plots [Bland and Altman, 1999;
obtained from all measuring methods is shown in Fig. 3.
Giavarina, 2015] were used to analyze the agreement of enamel
loss values after each etching step obtained from IOS (TRIe, CARe, PRO revealed a significant increase in enamel loss after
TRIi, and CARi), with values from PRO as the reference. A regres- each etching for both the 30-s and the 15-s etching times
sion analysis was performed to evaluate whether the order of val- (p ≤ 0.001 each). Similar results were found with intraoral
218 Caries Res 2021;55:215–224 Witecy/Ganss/Wöstmann/Schlenz/
DOI: 10.1159/000514666 Schlenz130
120
110
100
90
80
Enamel loss, µm
70
60
50
40
30
20
10
0
1 2 3 4 5 6 7 8 1 2 3 4 5 6 7 8 1 2 3 4 5 6 7 8 1 2 3 4 5 6 7 8 1 2 3 4 5 6 7 8
PRO TRIe CARe TRIi CARi
Fig. 3. Cumulative enamel loss (mean ± SD) after each of the 8 consecutive etching steps (light grey: 30-s etching
time; dark grey: 15-s etching time) as obtained from the 2 scanner types (TRI and CAR) and from the external
(e) and internal (i) software.
Table 2. Mean differences and 99% CI of loss values occurring after each etching step
T1–T0 T2–T1 T3–T2 T4–T3 T5–T4 T6–T5 T7–T6 T8–T7
PRO 16.6 (14.2–19.1) 17.8 (14.4–21.1) 18.8 (15.1–22.5) 15.1 (11.1–19.1) 7.6 (4.3–10.8) 11.0 (7.4–14.6) 11.1 (6.7–15.6) 10.7 (7.2–14.2)
TRIe 4.8 (3.2–6.5) 12.8 (6.8–18.9) 17.7 (14.0–21.5) 16.7 (12.9–20.5) 10.5 (7.3–13.6) 10.4 (8.2–12.6) 10.6 (7.9–13.3) 9.2 (6.7–11.7)
CARe 7.8 (4.3–11.3) 16.9 (11.6–22.1) 19.6 (15.5–23.6) 15.7 (10.5–20.9) 10.8 (7.5–14.1) 10.0 (7.0–13.0) 10.3 (7.4–13.2) 10.9 (8.7–13.1)
TRIi 4.8 (2.0–7.6) 14.8 (8.5–21.1) 19.0 (13.9–24.0) 13.5 (8.8–18.3) 11.7 (7.1–16.2) 10.0 (2.6–17.4) 9.0 (4.1–13.8) 9.8 (5.7–14.0)
CARi 0.6 (-0.5–1.6) 14.7 (9.1–20.4) 15.1 (9.3–20.9) 14.6 (9.3–19.8) 9.7 (7.3–12.0) 10.6 (6.9–14.3) 10.6 (5.2–15.9) 10.0 (6.6–13.3)
T1 to T4: 30-s etching time. T5 to T8: 15-s etching time.
scanning regardless of the scanner type or the mode of cy for higher values at a smaller scale and lower values at
analysis (within each method all cumulative increases p ≤ a greater scale. For all comparisons, the mean differences
0.001). Further, the differences from the previous etching were not significantly different from zero, indicating that
step were all significantly different from zero (p ≤ 0.001 neither method had a systematic difference compared to
for all differences except CARi at T1 n.s.; Table 2). PRO; thus the variability of the differences was only
The Bland-Altman analysis (Fig. 4) revealed that for all linked to the repeatability imprecision of each of the
comparisons except TRIi the slope of the regression line methods of comparison. Due to this, the limits of agree-
was not significantly different from zero, indicating that ment indicate that, in a single case, an IOSe measurement
the order of loss values did not influence the agreement can be approximately ±10 µm of the PRO measurement
of the scanner results with the results from PRO. For and an IOSi measurement can be ±15 µm of the PRO
TRIi, there was a small but significant (p ≤ 0.01) tenden- measurement.
Monitoring Erosive Tooth Wear with IOS Caries Res 2021;55:215–224 219
DOI: 10.1159/00051466620 20
10 10
PRO-CARe
PRO-TRIe
0 0
–10 –10
–20 –20
0 5 10 15 20 25 30 0 5 10 15 20 25 30
(PRO + TRIe)/2 (PRO + CARe)/2
20 20
10 10
PRO-CARi
PRO-TRIi
0 0
–10 –10
–20 –20
0 5 10 15 20 25 30 0 5 10 15 20 25 30
(PRO + TRIi)/2 (PRO + CARi)/2
Fig. 4. Bland-Altman plots evaluating the agreement between the loss values (µm) obtained from the 2 scanner
types (TRI and CAR) and from the external (e) and internal (i) software with PRO. The solid line indicates the
mean difference of the methods of comparison; the broken lines indicate the 95% limits of agreement (mean ±
1.96 × SD). Please note that the data output software TRIi on the micrometer scale gives no output on decimal
places.
Cusp Loss Discussion
All IOS were able to detect cusp loss (Fig. 5) from man-
ual bur preparation as cumulative loss values increased As a primary aim, the present study investigated the
significantly from time point to time point (within each potential of IOS for detecting progression of small
method, all differences p ≤ 0.0001). The overall loss per amounts of tissue loss in comparison to PRO as a refer-
preparation step was 55.0 ± 32.8, 55.3 ± 35.2, 56.4 ± 36.4, ence [Schlueter et al., 2011]. To simulate a setting close
and 55.9 ± 36.9 µm for TRIe, CARe, TRIi, and CARi, re- to the clinical situation, model teeth were mounted in a
spectively. From time point to time point (T2–T1, T3– phantom head positioned in a dental chair, where all
T2, … T8–T7), both IOS and methods of analysis re- IOS procedures were performed. Flat enamel samples
vealed similar loss values, with no significant differences were used as they fulfill the requirements for profilomet-
between them. ric measurements in the order of a few micrometers; in
addition, enamel allows for creation of tissue loss
through acid etching at any desired dimension and in a
suitable way. The profilometric procedure we used here
220 Caries Res 2021;55:215–224 Witecy/Ganss/Wöstmann/Schlenz/
DOI: 10.1159/000514666 Schlenz600
500
400
Cusp loss, µm
300
200
100
0
1 2 3 4 5 6 7 8 1 2 3 4 5 6 7 8 1 2 3 4 5 6 7 8 1 2 3 4 5 6 7 8
TRIe CARe TRIi CARi
Fig. 5. Cumulative cusp loss (mean ± SD) after each of the 8 consecutive preparation steps as obtained from the
2 scanner types (TRI and CAR) and from the external (e) and internal (i) software.
has been validated [Ganss et al., 2005] and it has been The obtained 3-D datasets were further processed with
used in numerous studies of our group, showing that it different software. For comparison of 3-D datasets, the
is able to measure tissue loss in various dimensions in a alignment procedure is important to obtain a rigid trans-
reliable way. The magnitude of tissue loss was chosen in formation that best adapts 2 existing models [Meireles et
view of clinical needs for monitoring, i.e., reasonable ob- al., 2016]. The superimposition, however, is not trivial and
servation periods, but also in view of needs for discrim- it is prone to error [Besl, 1992], and the choice of align-
inating physiological from pathological wear. So far, ment method has a significant influence on the measure-
there is no age-related threshold for pathological wear ment outcome. In contrast to reference alignment, best-fit
rates; therefore, the different resistance of enamel and alignment minimizes the mesh distance error between 2
dentine against chemical and physical impacts was con- data sets and may underestimate the order of a difference
sidered. On exposed dentine, antierosion agents are lim- at the area of interest [O’Toole et al., 2019b]. However,
ited in efficacy [Magalhaes et al., 2011] and physical there is no reliable reference structure in the oral cavity.
forces lead to higher wear rates in dentine than in enam- Because the internal IOS software uses best-fit alignment,
el [Dzakovich and Oslak, 2017]. Therefore, one pillar in the same alignment procedure was used for the external
tooth wear prevention should be preservation of the analysis with 3-D laboratory software for standardized
enamel covering of the crown. On occlusal surfaces of testing conditions. The authors are aware of a minimized
premolars and molars, the enamel has a thickness in the mesh distance due to best-fit alignment, but in this study
order of 1–2 mm [Kono et al., 2002]; thus, from a young a progression of flat and cupped lesions was shown re-
age, an annual wear rate of no more than about 20 µm gardless of the software. From a clinical point of view, this
may be considered acceptable. This order of wear was is an important gain of information for daily practice.
also described in a convenience sample of young adults As expected, the enamel loss increased with time and
with complete dentition and normal occlusion [Lam- the order of it varied according to the varying susceptibil-
brechts et al., 1989]. ity of the human material coming from different donors
Monitoring Erosive Tooth Wear with IOS Caries Res 2021;55:215–224 221
DOI: 10.1159/000514666[Uhlen et al., 2016]. Thus, a clinically relevant order of Accordingly, parameters like volume change, mean and
variation of the measured values was obtained, which maximum surface height loss, average profile height loss,
provided a good source for validation. PRO was able to or percentage of the surface area affected by wear have
detect this tissue loss after each 30-s and 15-s etching step been used for quantification. In addition to the options
(Fig. 3). Even though a linear increase and reproducible of IOS measurement tools, a current easy-to-use free
results were also found for IOS, absolute loss values be- software offering more measuring parameters could be
tween PRO and IOS differed. useful for a more comprehensive description of tooth
The authors are aware of the problem that measure- wear (www.leadsdigitaldentistry.com/WearCompare)
ment of tissue loss in the order of micrometers might rep- [O’Toole et al., 2019b]. However, as no particular param-
resent in the area of measurement uncertainty of IOS. eter has gained general acceptance, a recent systematic
Manufacturers do not quote the exact number of mea- review on the methodology of wear measurement con-
surement points for IOS datasets. However, some studies cluded that there is need for standardization [Wulfman
have focused on that topic and investigated the resolution et al., 2018]. Therefore, an important issue for future re-
of IOS used in this study. Chiu et al. [2020] described a search is validation of various parameters or combina-
scanning resolution in the region of 33 µm for Trios 3 re- tions of them for monitoring of erosive tooth wear.
garding discrepancy on the finish line. A study of Medi- So far, results of measurement of flat enamel samples
na-Sotomayor et al. [2018] analyzed the relationship be- have been regarded. In the clinical situation, however,
tween resolution and accuracy (trueness/precision) of such defined flat areas usually do not occur, with the ex-
different IOS. They described a resolution in the region ception, perhaps, of facets from attrition. In addition to
of 40 µm for Trios 3 but could not find a relationship be- the measurements on gradually etched enamel, scanners
tween resolution and accuracy. were therefore also applied to a clinically relevant defect
Monitoring, however, means detecting a difference in form as a secondary aim. For this purpose, cupped lesions
tissue loss from different observations; thus the focus of of cusps were simulated by manual bur preparation and
this paper was not to describe absolute values but rather the resulting substance loss was evaluated with the 2 scan-
to show that detection of consecutive tissue loss in a clin- ners and different types of software each. The measure-
ically meaningful dimension is possible with IOS. This ment problem here was not the determination of mea-
has a high clinical relevance because treatment options surement limits but the question of whether the scanners
depend on progression or stagnation of substance loss. would measure the progressive loss of cupped lesions in
External analysis with an elaborated 3-D laboratory a comparable way. The application of PRO would not
software tool like GOM is time consuming and requires have yielded any further insight here. Manual prepara-
operator skills. In view of the need for routine applica- tion produced substance loss values in the order of about
tions, we additionally examined the internal measuring 50 µm at each time point (Fig. 5), which is clearly within
software of the IOS, which is easy to use and already clin- the measuring capacity of the scanners as determined
ically applicable for analysis of fit regarding single crowns with the flat samples. The relatively wide range of values
[Schlenz et al., 2020]. In view of clinical needs, it is an obtained is due to the manual preparation, which in itself
encouraging finding that the internal software was also creates a greater variability of values than etching. All
able to detect tissue loss even after the 15-s etching steps measurement and analysis procedures were able to show
with good agreement with the profilometer results. The the increasing depth of the lesion with time, and there
limitation was that the output of the current internal were no significant differences between them. An encour-
software of TRI was on a millimeter scale with only 2 aging result is that the internal software of both scanners
decimal places. This means that on the micrometer scale again produced results comparable to those of the exter-
tissue loss was given in decimal steps, which explains the nal evaluation. Thus, the scanners could potentially be an
proportional difference to PRO. IOS software should be easy-to-use method to monitor cupped lesions in dental
improved to report measurements on a micrometer practice.
scale. Clearly, a laboratory set-up can only simulate clinical
A limitation of the present study is that the analysis conditions partially. This is a limitation as natural teeth
was restricted to the vertical height loss on sectional sometimes incur wear over the entire crown, lacking sta-
planes. Tooth wear varies distinctly with respect to the ble reference areas, or are prone to adaptive movements
shape of the lesions; thus, tissue loss can be reasonably for instance elongation. Furthermore, clinical conditions
described as changes in depth, volume, or affected area. (e.g., saliva or patient movement) might influence the
222 Caries Res 2021;55:215–224 Witecy/Ganss/Wöstmann/Schlenz/
DOI: 10.1159/000514666 Schlenzdata acquisition of IOS. However, a recent study investi- Statement of Ethics
gating pre- and postorthodontic treatment casts demon-
Teeth were extracted with the patients’ consent. The use of hu-
strated that IOS was able to confirm clinically visible wear man extracted teeth was approved by the Ethics Committee of the
progression [Marro et al., 2020], indicating the potential Justus Liebig University of Giessen (ref. No. 143/09).
of IOS for wear monitoring. Further research, however,
is required to refine methods of alignment and analysis
and to investigate whether the promising measurement Conflict of Interest Statement
potential of the scanners shown here can also be realized
in clinical practice. The authors have no conflict of interests to declare.
Conclusion Funding Sources
The study was funded by the Justus Liebig University of Giessen.
In a simulated clinical setting, IOS were able to detect
progression of tissue loss on flat enamel samples even af-
ter 15-s etching steps both when the datasets were ana-
Author Contributions
lyzed with an external software (GOM) and with the re-
spective internal software tools. Bland-Altman analysis C.W. and C.G. share first authorship. C.W. designed and per-
revealed good agreement with tissue loss values obtained formed the experiment, acquired profilometric and IOS data, and
from PRO, which served as the reference method. Moni- wrote this paper. C.G. designed the experiment, performed statis-
tical analyses, interpreted the data, and wrote this paper. B.W. al-
toring of the progression of tissue loss from cupped le-
located the resources and revised this paper. M.B.S. performed the
sions was also possible with both IOS and software types. experiments, acquired IOS data, and revised this paper. M.A.S. de-
IOS seem to be a promising tool to monitor erosive tooth signed the experiment, monitored the data acquisition, and wrote
wear even at small wear rates. this paper. All of the authors approved the final version of this pa-
per and are accountable for all aspects of this work.
References
Alaraudanjoki V, Saarela H, Pesonen R, Laitala Dzakovich JJ, Oslak RR. In vitro effects of acid Lambrechts P, Braem M, Vuylsteke-Wauters M,
ML, Kiviahde H, Tjäderhane L, et al. Is a Basic challenge on incisal/occlusal cupping/crater- Vanherle G. Quantitative in vivo wear of hu-
Erosive Wear Examination (BEWE) reliable ing. J Prosthet Dent. 2017 Jan;117(1):124–31. man enamel. J Dent Res. 1989 Dec; 68(12):
for recording erosive tooth wear on 3D mod- Ganss C, Lussi A, Klimek J. Comparison of cal- 1752–4.
els? J Dent. 2017 Apr;59:26–32. cium/phosphorus analysis, longitudinal mi- Magalhães AC, Wiegand A, Rios D, Buzalaf MA,
Bardsley PF. The evolution of tooth wear indices. croradiography and profilometry for the Lussi A. Fluoride in dental erosion. Monogr
Clin Oral Investig. 2008 Mar; 12(Suppl quantitative assessment of erosive deminer- Oral Sci. 2011;22:158–70.
1):S15–9. alisation. Caries Res. 2005 May-Jun; 39(3): Marro F, De Lat L, Martens L, Jacquet W, Botten-
Bartlett DW, Blunt L, Smith BG. Measurement of 178–84. berg P. Monitoring the progression of erosive
tooth wear in patients with palatal erosion. Br Giavarina D. Understanding Bland Altman anal- tooth wear (ETW) using BEWE index in casts
Dent J. 1997 Mar;182(5):179–84. ysis. Biochem Med (Zagreb). 2015 Jun;25(2): and their 3D images: A retrospective longitu-
Bartlett D, Ganss C, Lussi A. Basic Erosive Wear 141–51. dinal study. J Dent. 2018 Jun;73:70–5.
Examination (BEWE): a new scoring system Hartkamp O, Lohbauer U, Reich S. Antagonist Marro F, Jacquet W, Martens L, Keeling A,
for scientific and clinical needs. Clin Oral In- wear by polished zirconia crowns. Int J Com- Bartlett D, O’Toole S. Quantifying increased
vestig. 2008 Mar;12(Suppl 1):S65–8. put Dent. 2017a;20(3):263–74. rates of erosive tooth wear progression in the
Besl PJ, McKay ND. A method for registration of Hartkamp O, Peters F, Bothung H, Lohbauer U, early permanent dentition. J Dent. 2020 Feb;
3-D shapes. IEEE Trans Pattern Anal Mach Reich S. Optical profilometry versus intraoral 93:103282.
Intell. 1992;14(2):239–56. (handheld) scanning. Int J Comput Dent. Medina-Sotomayor P, Pascual-Moscardó A,
Bland JM, Altman DG. Measuring agreement in 2017b;20(2):165–76. Camps I. Relationship between resolution
method comparison studies. Stat Methods Kono RT, Suwa G, Tanijiri T. A three-dimension- and accuracy of four intraoral scanners in
Med Res. 1999 Jun;8(2):135–60. al analysis of enamel distribution patterns in complete-arch impressions. J Clin Exp Dent.
Chiu A, Chen YW, Hayashi J, Sadr A. Accuracy of human permanent first molars. Arch Oral 2018 Apr;10(4):e361–6.
CAD/CAM Digital Impressions with Differ- Biol. 2002 Dec;47(12):867–75. Meireles AB, Vieira AW, Corpas L, Vandenber-
ent Intraoral Scanner Parameters. Sensors Kumar S, Keeling A, Osnes C, Bartlett D, O’Toole ghe B, Bastos FS, Lambrechts P, et al. Dental
(Basel). 2020 Feb;20(4):20. S. The sensitivity of digital intraoral scanners wear estimation using a digital intra-oral opti-
DeLong R. Intra-oral restorative materials wear: at measuring early erosive wear. J Dent. 2019 cal scanner and an automated 3D computer
rethinking the current approaches: how to Feb;81:39–42. vision method. Comput Methods Biomech
measure wear. Dent Mater. 2006 Aug; 22(8): Biomed Engin. 2016;19(5):507–14.
702–11.
Monitoring Erosive Tooth Wear with IOS Caries Res 2021;55:215–224 223
DOI: 10.1159/000514666Müller P, Ender A, Joda T, Katsoulis J. Impact of Schlenz MA, Vogler J, Schmidt A, Rehmann P, Uhlen MM, Mulic A, Holme B, Tveit AB, Stenha-
digital intraoral scan strategies on the impres- Wöstmann B. New Intraoral Scanner-Based gen KR. The Susceptibility to Dental Erosion
sion accuracy using the TRIOS Pod scanner. Chairside Measurement Method to Investi- Differs among Individuals. Caries Res. 2016;
Quintessence Int. 2016 Apr;47(4):343–9. gate the Internal Fit of Crowns: A Clinical 50(2):117–23.
O’Toole S, Osnes C, Bartlett D, Keeling A. Inves- Trial. Int J Environ Res Public Health. 2020 Wohlrab T, Flechtenmacher S, Krisam J, Saure D,
tigation into the validity of WearCompare, a Mar;17(7):17. Wolff D, Frese C. Diagnostic value of the Ba-
purpose-built software to quantify erosive Schlueter N, Ganss C, De Sanctis S, Klimek J. sic Erosive Wear Examination for the assess-
tooth wear progression. Dent Mater. 2019a Evaluation of a profilometrical method for ment of dental erosion on patients, dental
Oct;35(10):1408–14. monitoring erosive tooth wear. Eur J Oral Sci. photographs, and dental casts. Oper Dent.
O’Toole S, Osnes C, Bartlett D, Keeling A. Inves- 2005 Dec;113(6):505–11. 2019 Nov/Dec;44(6):E279–88.
tigation into the accuracy and measurement Schlueter N, Hara A, Shellis RP, Ganss C. Meth- Wulfman C, Koenig V, Mainjot AK. Wear mea-
methods of sequential 3D dental scan align- ods for the measurement and characteriza- surement of dental tissues and materials in
ment. Dent Mater. 2019b Mar;35(3):495–500. tion of erosion in enamel and dentine. Caries clinical studies: A systematic review. Dent
Res. 2011;45 Suppl 1:13–23. Mater. 2018 Jun;34(6):825–50.
Schlueter N, Luka B. Erosive tooth wear - a re-
view on global prevalence and on its preva-
lence in risk groups. Br Dent J. 2018 Mar;
224(5): 364–70.
224 Caries Res 2021;55:215–224 Witecy/Ganss/Wöstmann/Schlenz/
DOI: 10.1159/000514666 SchlenzYou can also read