Pharmacokinetics and Tissue Distribution of Gingerols and Shogaols from Ginger (Zingiber officinale Rosc.) in Rats by UPLC-Q-Exactive-HRMS
←
→
Page content transcription
If your browser does not render page correctly, please read the page content below
molecules
Article
Pharmacokinetics and Tissue Distribution of
Gingerols and Shogaols from Ginger (Zingiber
officinale Rosc.) in Rats by UPLC–Q-Exactive–HRMS
Ling-Ling Li 1,2 , Ying Cui 1,2, *, Xing-Han Guo 1 , Kai Ma 3 , Ping Tian 3 , Jing Feng 1 and
Jun-Ming Wang 1
 1   School of Pharmacy, Henan University of Chinese Medicine, 156 Jinshui east Road, Zhengzhou 450046,
     China; openleeling@163.com (L.-L.L.); gxh5508@163.com (X.-H.G.); fj.xyz@163.com (J.F.);
     mjw98@126.com (J.-M.W.)
 2   Collaborative Innovation Center for Respiratory Disease Diagnosis and Treatment & Chinese Medicine
     Development of Henan Province, 156 Jinshui east Road, Zhengzhou 450046, China
 3   Henan Province Chinese Medicine Research Institute, Zhengzhou 450046, China; zzmk1968@126.com (K.M.);
     tianping082@163.com (P.T.)
 *   Correspondence: cyexin@hactcm.edu.cn; Tel.: +86-371-8653-5313

 Received: 2 January 2019; Accepted: 29 January 2019; Published: 31 January 2019

 Abstract: Gingerols and shogaols are recognized as active ingredients in ginger and exhibit diverse
 pharmacological activities. The preclinical pharmacokinetics and tissue distribution investigations
 of gingerols and shogaols in rats remain less explored, especially for the simultaneous analysis
 of multi-components. In this study, a rapid, sensitive, selective, and reliable method using
 an Ultra-Performance Liquid Chromatography Q-Exactive High-Resolution Mass Spectrometer
 (UPLC-Q-Exactive–HRMS) was established and validated for simultaneous determination of
 eight compounds, including 6-gingerol, 6-shogaol, 8-gingerol, 8-shogaol, 10-gingerol, 10-shogaol,
 Zingerone, and 6-isodehydrogingenone in plasma and tissues of rats. The analytes were separated
 on a Syncronis C18 column (100 × 2.1 mm, 1.7 µm) using a gradient elution of acetonitrile and
 0.1% formic acid in water at a flow rate of 0.25 mL/min at 30 ◦ C. The method was linear for each
 ingredient over the investigated range with all correlation coefficients greater than 0.9910. The lowest
 Lower Limit of quantitation (LLOQ) was 1.0 ng/mL. The intra- and inter-day precisions (Relative
 Standard Deviation, RSD%) were less than 12.2% and the accuracy (relative error, RE%) ranged
 from −8.7% to 8.7%. Extraction recovery was 91.4–107.4% and the matrix effect was 86.3–113.4%.
 The validated method was successfully applied to investigate the pharmacokinetics and tissue
 distribution of eight components after oral administration of ginger extract to rats. These results
 provide useful information about the pharmacokinetics and biodistribution of the multi-component
 bioactive ingredients of ginger in rats and will contribute to clinical practice and the evaluation of the
 safety of a Chinese herbal medicine.

 Keywords: pharmacokinetics; tissue distribution; ginger; gingerols; shogaols; UPLC–Q-Exactive–HRMS

1. Introduction
     Ginger, the rhizome of Zingiber officinale Rosc. (Z. officinale), is frequently utilized as both a spice
and a traditional herbal medicine for centuries all over the world due to its health benefits [1–3]. Several
regulatory authorities identify ginger as a safe supplemental herbal [4,5], and it is also implemented
in complementary and alternative medicine preparations for the treatment of different diseases,
such as headaches, colds, and fevers, for reliving gingivitis, and as an anti-emetic, expectorant,

Molecules 2019, 24, 512; doi:10.3390/molecules24030512                       www.mdpi.com/journal/molecules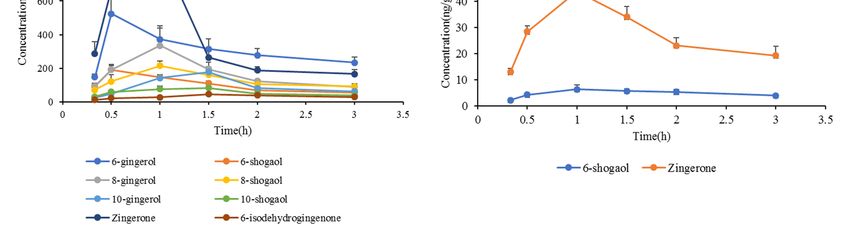
Molecules 2019, 24, 512                                                                               2 of 12

and appetite stimulant [6–8]. Furthermore, previous studies have revealed that ginger possesses
anti-tumor activity [9,10].
       More than 200 compounds are identified from ginger, and its bioactive components include
volatile oils, anthocyanins, tannins, and pungent phenolic compounds known as gingerols, shogaols,
and sesquiterpenes [11,12]. Ginger is widely cultivated as a spice for its aromatic and pungent
components including essential oil and oleoresins [13]. The non-volatile compounds are gingerols,
shogaols, paradols, and zingerone [14], sharing the same parent nucleus structure and are
responsible for pharmacological functions in fresh ginger [15,16]. Previous studies demonstrated
that gingerols and shogaols have diverse pharmacological activities, especially for 6-gingerol and
6-shogaol, have been proven to exhibit significant anti-hyperglycemic activity [17], antioxidant [18],
analgesic [19], anti-inflammatory [20], anti-cancer [21], anti-arteriosclerosis [22], and lifespan-extending
functions [23,24].
       Owing to the abundant pharmacological actions of gingerols and shogaols, it is better to
understand their absorption and distribution in vivo. There are quite a few researches about
pharmacokinetic studies of 6-gingerol, 8-gingerol, 10-gingerol and 6-shogaol [25–27]; however, fewer
components of ginger were investigated and their tissue distribution was not involved. Therefore,
it is necessary and meaningful to develop a more accurate and selective bioanalytical method for the
determination of more active ingredients in plasma and tissues to understand the characterization and
diversity of the pharmacokinetic and tissue distribution properties of ginger.
       Ultra-Performance Liquid Chromatography (UPLC) combined with High-Resolution Mass
Spectrometry (HRMS) is a powerful technique utilized for diverse applications due to its very high
sensitivity and selectivity. In recent years, it has rapidly developed an important method to measure
the composition of trace components in food and drugs [28,29]. Therefore, the aim of this study was
to develop and validate a method for simultaneous measurement of eight components (6-gingerol,
6-shogaol, 8-gingerol, 8-shogaol, 10-gingerol, 10-shogaol, Zingerone and 6-isodehydrogingenone) in rat
plasma and organs using an Ultra-Performance Liquid Chromatography Q-Exactive High-Resolution
Mass Spectrometer (UPLC–Q-Exactive–HRMS), and investigate their pharmacokinetics and tissue
distribution. To the best of our knowledge, this is the first time a method has been established for
simultaneously measuring eight components of fresh ginger in rat plasma and organs and investigating
their pharmacokinetics and tissue distribution in rats.

2. Results and Discussion

2.1. Method Development
      Since analytes were present in relatively low concentrations and in a complex matrix environment,
it was important to optimize the chromatographic and mass spectrometric conditions to develop a
rapid, sensitive, and precise method to circumvent these potentially confounding issues as well as an
efficient extraction procedure for all analytes.

2.1.1. Chromatography and Mass Spectrometry
     To obtain optimized responses, suitable retention times, and ideal peak shapes for the analytes, the
chromatographic condition was optimized through trial and error based on previous studies [26,27].
Methanol, acetonitrile, 0.1% formic acid, and chromatographic grade water were selected as mobile
phase candidates. Finally, a gradient elution with acetonitrile and water containing 0.1% formic
acid achieved our purpose and was finally adopted as the mobile phase for the chromatographic
separation. Additionally, formic acid (0.1%) was added to water to improve peak shape of the
analytes, and the ionization efficiency was improved as the acidic mobile phase provided abundant H+ .
Run time of total chromatography analysis was 12 min with retention times of 2.64 min for 6-gingerol,
4.79 min for 6-shogaol, 4.29 min for 8-gingerol, 6.65 min for 8-shogaol, 6.16 min for 10-gingerol,
Molecules 2019, 24, 512 3 of 12
8.33 min for 10-shogaol, 2.64 min for Zingerone, 5.83 min for 6-isodehydrogingenone and 6.17 min
Molecules 2019, 24, x FOR PEER REVIEW
for
3 of 12
Atractylenolide I, used as the internal standard (IS).
For MS
For MScondition,
condition,thethe
feasibility of electrospray
feasibility in positive
of electrospray and negative
in positive ion modes
and negative ionwas evaluated
modes was
during assay development. We found that the response observed in positive ion
evaluated during assay development. We found that the response observed in positive ion mode was mode was higher
than that
higher in that
than negative mode.mode.
in negative Full scan
Full mode was used
scan mode to collect
was used the molecular
to collect ion peaks
the molecular withwith
ion peaks the
mass range of 100–1000. The +
the mass range of 100–1000. Themost
mostabundant
abundantions ionsinin the
the spectra ([M ++H]
spectra ([M H]+ ofof
6-,6-,
8-,8-, 10-shogaols,
10-shogaols, 6-
6-isodehydrogingenone and IS, [M + H − H O] + of 6-, 8-, 10-gingerols and Zingerone) were selected
isodehydrogingenone and IS, [M + H − H2O]2 of 6-, 8-, 10-gingerols and Zingerone) were selected for
+
for sensitive
sensitive quantitation.
quantitation. The m/zTheofm/z of 6-gingerol
6-gingerol and 6-shogaol
and 6-shogaol was 277.18024,
was 277.18024, 8-gingerol8-gingerol and
and 8-shogaol
8-shogaol
was was 305.21188,
305.21188, 10-gingerol10-gingerol and 10-shogaol
and 10-shogaol was 333.24222,
was 333.24222, Zingerone
Zingerone was was 177.09105,
177.09105, 6-
6-isodehydrogingenone was 291.15891, and IS was 231.13847. The structures of eight
isodehydrogingenone was 291.15891, and IS was 231.13847. The structures of eight analytes and IS analytes and IS
are shown
are shown inin Figure
Figure 1.
1.
Figure 1. Chemical structures of eight target analytes and Atractylenolide I, the internal standard (IS).
Figure 1. Chemical structures of eight target analytes and Atractylenolide I, the internal standard
2.1.2. Sample Preparation and Internal Standard Selection
(IS).
An effective and simple protein precipitation and a liquid–liquid extraction method was employed
2.1.2. Sample
to remove Preparation
protein and Internal
and potential Standard
interference from Selection
bio-samples (plasma and tissue samples) prior to
LC–MS analysis. Methanol was used as the protein precipitation
An effective and simple protein precipitation and a liquid–liquid solvent and ethyl acetatemethod
extraction was applied
was
to extract target analytes.
employed to remove protein and potential interference from bio-samples (plasma and tissue
A suitable
samples) prior tointernal
LC–MSstandard
analysis.isMethanol
a key factor
wasinused
biological
as the sample
protein analysis. Atractylenolide
precipitation solvent and Iethyl
was
chosen to be an internal standard because
acetate was applied to extract target analytes. of its similar retention time to other analytes and lack of
endogenous
A suitableinterference in rat plasma
internal standard andfactor
is a key organinsamples.
biological sample analysis. Atractylenolide I was
chosen to be an internal standard because of its similar retention time to other analytes and lack of
2.2. Method Validation
endogenous interference in rat plasma and organ samples.
2.2.1. Selectivity and Linearity
2.2. Method Validation
The selectivity was evaluated by comparing the typical chromatograms of blank plasma, heart,
liver, spleen,
2.2.1. lung,
Selectivity andkidney, stomach, intestine, and brain; blank plasma or organ spiked with the eight
Linearity
target analytes and IS; and bio-samples (plasma and lung tissue) after oral administration of ginger
TheThere
extract. selectivity
was no wasendogenous
evaluated by comparinginthe
interference thetypical chromatograms
full scan mode for each of of
blank
the plasma,
analytesheart,
in all
liver, spleen, lung, kidney, stomach, intestine, and brain;
samples and the representative spectra is presented in Figure 2. blank plasma or organ spiked with the eight
targetThe
analytes and
linearity of IS;
theand bio-samples
eight (plasma
target analytes and lung under
was estimated tissue)optimized
after oral conditions.
administration of ranges,
Linear ginger
extract. There was no endogenous interference in the full scan mode for each of the
correlation coefficients (r) and LLOQ are shown in Table S1. The standard curves of the eight target analytes in all
samples
analytes and
hadthe
goodrepresentative
linearity with spectra is presented
correlation in Figure
coefficients more 2. than 0.9910. The lowest LLOQ was
1.0 ng/mL.Molecules 2019, 24, 512 4 of 12
Molecules 2019, 24, x FOR PEER REVIEW 4 of 12
Figure 2. Representative chromatograms of eight analytes and IS: Blank plasma (A); blank plasma
Figure 2. Representative chromatograms of eight analytes and IS: Blank plasma (A); blank plasma
spiked with analytes and IS (B); plasma (C) and lung sample (D) collected at 1 h after oral administration
spiked with analytes and IS (B); plasma (C) and lung sample (D) collected at 1 h after oral
of ginger extract at a dose of 400 mg/kg.
administration of ginger extract at a dose of 400 mg/kg.
2.2.2. Precision, Accuracy, Extraction Recovery and Matrix Effect
The linearity of the eight target analytes was estimated under optimized conditions. Linear
ranges,Intra- and inter-day
correlation precision
coefficients andLLOQ
(r) and accuracy
are of the eight
shown analytes
in Table in QC
S1. The samples
standard are summarized
curves of the eight
in Table S2. The results indicated that the intra- and inter-day precision (RSD%) of these
target analytes had good linearity with correlation coefficients more than 0.9910. The lowest analytes were
LLOQ
in the
was 1.0range
ng/mL.of 1.1% to 12.2%, respectively, while the corresponding REs ranged from –8.7% to 8.7%,
respectively. These results suggested that this method had an acceptable precision and accuracy [30].
2.2.2.The resultsAccuracy,
Precision, for extraction recovery
Extraction and matrix
Recovery effectEffect
and Matrix of the eight analytes are also shown in
Table S2. The extraction recoveries were in the acceptable range from 91.4% to 107.4%. Regarding the
Intra- and inter-day precision and accuracy of the eight analytes in QC samples are summarized
matrix effects, all ratios were between 86.3% and 113.4%, suggesting that there was no endogenous
in Table S2. The results indicated that the intra- and inter-day precision (RSD%) of these analytes
substances and interference for the ionization of the analytes in the co-eluting matrix.
were in the range of 1.1% to 12.2%, respectively, while the corresponding REs ranged from –8.7% to
8.7%, respectively. These results suggested that this method had an acceptable precision and accuracy
[30].
The results for extraction recovery and matrix effect of the eight analytes are also shown in Table
S2. The extraction recoveries were in the acceptable range from 91.4% to 107.4%. Regarding the matrixMolecules 2019, 24, x FOR PEER REVIEW 5 of 12
effects, all ratios were between 86.3% and 113.4%, suggesting that there was no endogenous
Molecules 2019, 24, 512 5 of 12
substances and interference for the ionization of the analytes in the co-eluting matrix.
2.2.3. Stability
2.2.3. Stability
The stability of the eight analytes in rat plasma and organ tissues under different conditions is
The stability of the eight analytes in rat plasma and organ tissues under different conditions
shown in Table S3. The extracted samples were stable under the testing conditions including auto-
is shown in Table S3. The extracted samples were stable under the testing conditions including
sampler temperature (4 °C) for 24 h, three freeze–thaw cycles and long-term cold storage (–20 °C for
auto-sampler temperature (4 ◦ C) for 24 h, three freeze–thaw cycles and long-term cold storage (–20 ◦ C
30 days) with RE% values of –9.7–11.3%. The data indicated that the eight ingredients were stable in
for 30 days) with RE% values of –9.7–11.3%. The data indicated that the eight ingredients were stable
biological samples stored under various conditions.
in biological samples stored under various conditions.
2.3.
2.3. Pharmacokinetic
Pharmacokinetic Study
Study
The
The validated
validated method
methodwas wassuccessfully
successfullyutilized
utilizedtotoexamine
examinethe concentrations
the concentrations of of
6-gingerol, 6-
6-gingerol,
shogaol, 8-gingerol,
6-shogaol, 8-gingerol,8-shogaol, 10-gingerol,
8-shogaol, 10-gingerol, 10-shogaol,
10-shogaol, Zingerone andand
Zingerone 6-isodehydrogingenone
6-isodehydrogingenone in rat
in
plasma and organ samples after oral administration of ginger extract at a
rat plasma and organ samples after oral administration of ginger extract at a dose of 400mg/kgdose of 400mg/kg
(equivalent to
(equivalent 42.7 mg/kg
to 42.7 mg/kg 6-gingerol,
6-gingerol, 17.217.2 mg/kg
mg/kg6-shogaol,
6-shogaol,21.3
21.3mg/kg
mg/kg 8-gingerol,
8-gingerol,11.0 mg/kg
11.0 mg/kg 8-
shogaol,
8-shogaol,14.9
14.9mg/kg
mg/kg 10-gingerol,
10-gingerol, 9.49.4mg/kg
mg/kg 10-shogaol,
10-shogaol, 10.9 mg/kg
10.9 mg/kg Zingerone,
Zingerone, and 5.85.8
and mg/kg
mg/kg 6-
isodehydrogingenone). The mean plasma concentration–time profiles of the
6-isodehydrogingenone). The mean plasma concentration–time profiles of the eight analytes are eight analytes are
presented in
presented in Figure
Figure3.3.TheThe
main pharmacokinetic
main pharmacokineticparameters, including
parameters, the area
including theunder
area the plasma
under the
concentration–time curve (AUC (0–t)), half-life (t1/2), peak time (Tmax), and maximum plasma
plasma concentration–time curve (AUC(0–t) ), half-life (t1/2 ), peak time (Tmax ), and maximum plasma
concentration
concentration (C(Cmax
max), were estimated with DAS 3.2.8 software using non-compartmental calculations.
), were estimated with DAS 3.2.8 software using non-compartmental calculations.
The results
The results are
are summarized
summarized in in Table
Table 1. 1.
Figure 3. Mean plasma concentration–time curves of eight analytes after oral administration of ginger
extract at a dose of 400 mg/kg. (n = 10, mean ± SD).
Figure 3. Mean plasma concentration–time curves of eight analytes after oral administration of ginger
extract1.atPharmacokinetic
Table parameters
a dose of 400 mg/kg. (n = 10,of eight± constituents
mean SD). in rats plasma after oral administration of
ginger extract at a dose of 400 mg/kg (n = 10, mean ± SD).
Table 1. Pharmacokinetic parameters of eight constituents in rats plasma after oral administration of
Analytes AUC(0–t) (µg/L·h) t1/2 (h) Tmax (h) Cmax (µg/L)
ginger extract at a dose of 400 mg/kg (n = 10, mean ± SD).
6-gingerol 691.5 ± 80.7 2.6 ± 0.7 0.9 ± 0.2 255.4 ± 44.7
6-shogaol Analytes 545.3AUC (0–t) (µg/L·h)
± 95.7 3.9 ±t1/21.2
(h) Tmax0.7
(h)± 0.3
Cmax (µg/L)
214.4 ± 40.7
8-gingerol6-gingerol 579.4 ±691.5
79.4 ± 80.7 2.72.6 ± 0.3± 0.7 0.9 1.1
± 0.2± 0.2255.4 ± 44.7
156.0 ± 23.5
8-shogaol 6-shogaol 171.3 ±545.3
25.9 ± 95.7 3.03.9 ± 1.2± 1.2 0.7 0.9
± 0.3± 0.2 46.5 ± 9.7
214.4 ± 40.7
10-gingerol8-gingerol 259.1 ±579.4
46.0 ± 79.4 2.72.7 ± 0.4± 0.3 1.1 1.5
± 0.2± 0.3 92.8 ± 11.3
156.0 ± 23.5
10-shogaol8-shogaol 101.3 ±171.3
24.6 ± 25.9 2.53.0 ± 2.4± 1.2 0.9 1.4
± 0.2± 0.446.5 ± 9.732.5 ± 6.2
Zingerone10-gingerol 641.0 ±259.1
85.3 ± 46.0 2.22.7 ± 0.4± 0.4 1.5 0.7
± 0.3± 0.392.8 ± 11.3
174.8 ± 23.0
6-isodehydrogingenone
10-shogaol 63.7 ± 9.7
101.3 ± 24.6 1.0 ± 1.1 1.1
2.5 ± 2.4 1.4 ± 0.4 ± 0.232.5 ± 6.224.4 ± 8.1Molecules 2019, 24, 512 6 of 12
Gingerols are aromatic polyphenols, composed of a series of structural analogs, which have an α,
β-unsaturated ketone structure with a varied unbranched alkyl chain length [31,32], whereas shogaols
are a series of homologues derived from dehydration of gingerol on C-5 and C-4 [33]. Results showed
that all analytes were quickly absorbed into the circulatory system with different concentrations;
gingerols have similar drug–time curves to shogaols with a corresponding carbon chain length due
to structural similarity. The Tmax of 6-, 8-, and 10-gingerols/shogaols showed that shogaols were
absorbed faster than gingerols with a corresponding carbon chain length, although their contents were
lower in fresh ginger. Additionally, the increase in the alkyl side chain length weakened the entry
capacity in blood of gingerols and shogaols. The t1/2 of shogaols were longer than gingerols indicating
that shogaols had a relatively long residence time in the body and it may be the reason that shogaols
exhibited higher biological activities than gingerols to a certain extent [18,20]. Abnormally, 6-gingerol
is the most abundant in ginger, but the detected plasma concentration was not very high (the Cmax of
6-gingerol was 255.4 ± 44.7 µg/L), probably due to the major existing form of 6-gingerol in plasma is
its glucuronide metabolites [26,27], which is consistent with the previous study [27].
Furthermore, 6- and 8-gingerols/shogaols had the double absorption at about 3 h in the
concentration–time profile after administration. One reason for the observed result probably resulted
from enterohepatic circulation [34] and the other reason might have been the reciprocal transformation
between gingerols/shogaols and glucuronide metabolites [26,27]. Additionally, the double-site
absorption of drugs might be the first peak expressed by the absorption of the components in the
stomach and the second peak was caused by intestinal absorption [35].
The Tmax of Zingerone was 0.7 ± 0.3 h, showing that Zingerone was quickly absorbed and
maintained durably and eliminated slowly in vivo. Thus, further research on Zingerone is under way
and needs more attention [36,37]. The Tmax and Cmax of 6-isodehydrogingenone were 1.1 ± 0.2 h and
24.4 ± 8.1 µg/L, indicating that although 6-isodehydrogingenone had more active groups in structure,
it was still relatively slow to demonstrate its performance in the circulatory system. Its difficulty to enter
into the plasma and tissues was possibly due to the decreased abundance of 6-isodehydrogingenone in
the ginger extract; moreover, it may also have been related to the binding reaction of other substances.
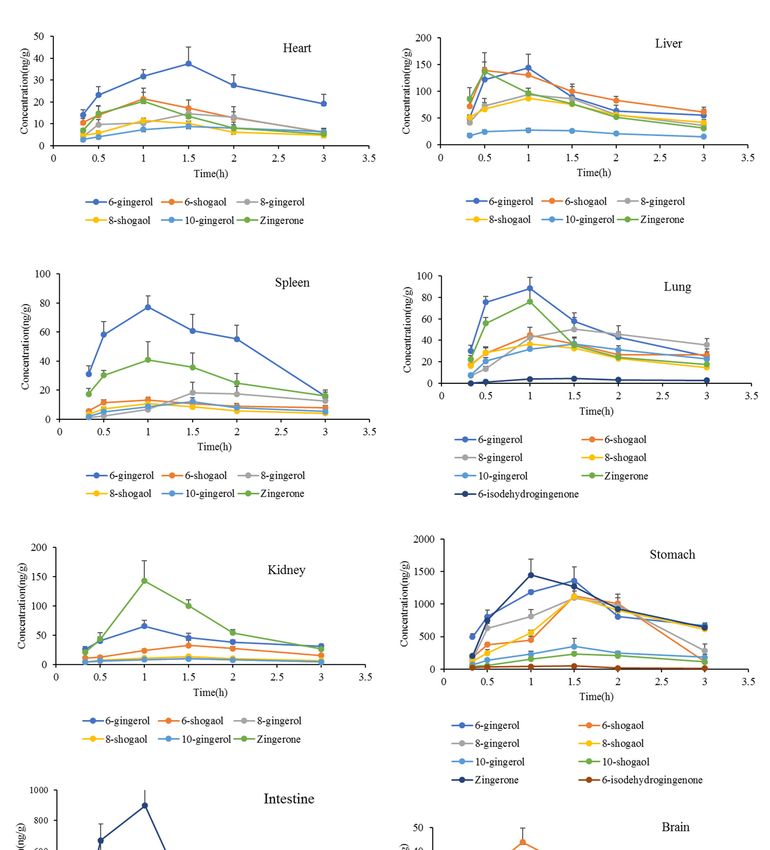
2.4. Tissue Distribution Study
The tissue distributions of 6-gingerol, 6-shogaol, 8-gingerol 8-shogaol, 10-gingerol, 10-shogaol,
Zingerone, and 6-isodehydrogingenone were observed in rats at 0.33, 0.5, 1.0, 1.5, 2, and 3 h after
oral administration of ginger extract at a dose of 400 mg/kg (equivalent to 42.7 mg/kg 6-gingerol,
17.2 mg/kg 6-shogaol, 21.3 mg/kg 8-gingerol, 11.0 mg/kg 8-shogaol, 14.9 mg/kg 10-gingerol,
9.4 mg/kg 10-shogaol, 10.9 mg/kg Zingerone, and 5.8 mg/kg 6-isodehydrogingenone). The time point
of organ removal referred to the above results obtained from pharmacokinetics. The tissue distribution
was determined in various tissues of rats, including the liver, heart, spleen, lung, kidney, stomach,
intestine, and brain. The concentrations of ingredients in various tissues at different time points are
shown in Figure 4.
The results stated clearly that most of the ingredients could be detected in the studied
organizations except for 10-shogaol and 6-isodehydrogingenone, which was probably due to their
difficulties to enter into the tissue. In addition, they might have been absorbed slowly and in the
time before tissue removal were unable to reach the detectable concentration. Moreover, the hydroxyl
and unsaturated double bond groups in 10-shogaol and 6-isodehydrogingenone resulted in a binding
reaction with proteins. Interestingly, a trace of 6-isodehydrogingenone was detected in the lung tissue
suggesting that it may have potential in the treatment of pulmonary diseases. More research of the
reciprocity of 6-isodehydrogingenone and pulmonary diseases would be necessary to prove this.Molecules 2019, 24, x FOR PEER REVIEW 7 of 12
Molecules 2019, 24, 512 7 of 12
Figure 4. The concentrations of analytes in various tissues at different time points (n = 6, mean ± SD).
Figure 4. The concentrations of analytes in various tissues at different time points (n = 6, mean ± SD).
At 0.33 h after oral administration, different concentrations of 6-gingerol, 6-shogaol, 8-gingerol
The results stated clearly that most of the ingredients could be detected in the studied
8-shogaol, 10-gingerol, and Zingerone were detected in rat tissues, indicating that these ingredients
organizations except for 10-shogaol and 6-isodehydrogingenone, which was probably due to their
were distributed widely and rapidly in various tissues. With the time extension, concentrations in
difficulties to enter into the tissue. In addition, they might have been absorbed slowly and in the time
most of the tissues were obviously decreased at 3 h, indicating that they did not accumulate during the
before tissue removal were unable to reach the detectable concentration. Moreover, the hydroxyl and
detection period, which was in coincidence with that of the plasma concentration change. 6-gingerol,
unsaturated double bond groups in 10-shogaol and 6-isodehydrogingenone resulted in a binding
6-shogaol, 8-gingerol, 8-shogaol, 10-gingerol and Zingerone were widely distributed in various tissues,
reaction with proteins. Interestingly, a trace of 6-isodehydrogingenone was detected in the lung tissueMolecules 2019, 24, 512 8 of 12
especially in the stomach, intestine, liver, lung and kidney, indicating that the digestive system and
lung might have been the target organs, and the liver and kidney were the main metabolized and
eliminated channel. That is probably the pharmacokinetics basis of 6-gingerol, 6-shogaol, 8-gingerol
8-shogaol, 10-gingerol, and Zingerone for good therapeutic effect on the digestive and respiratory
system. 6-shogaol and Zingerone were also detected in the brain suggesting that ginger has potential
to treat brain-related diseases due to their penetrability to the blood–brain barrier.
Our ultimate goal is not only to explore the absorption and distribution of gingerols and shogaols
in normal organisms, but also to compare normal animals with disease models. This research is
now being carried out, and expected to discover new therapeutic targets of ginger for the treatment
of diseases.
3. Materials and Methods
3.1. Materials and Reagents
6-gingerol, 6-shogaol, and 8-gingerol were received from the Henan Province Chinese Medicine
Research Institute. 8-shogaol, 10-gingerol, 10-shogaol, Zingerone, and 6-isodehydrogingenone were
purchased from Sichuan Vicket Biological Technology Co., Ltd. (Sichuan, China). Atractylenolide I was
purchased from the China Research Institute of Food and Drug Verification (Beijing, China). The purity
of each reference standard was above 98%. Heparin sodium and sodium carboxymethylcellulose
(CMC–Na) were purchased from Sigma–Aldrich (St. Louis, MO, USA). Acetonitrile and methanol of
HPLC grade were obtained from Thermo Fisher Scientific (Fair Lawn, NJ, USA). Chromatography
grade formic acid was supplied by Sigma–Aldrich (St. Louis, MO, USA). Ethyl acetate was purchased
from Tianjin Dasen Chemical Products Sales Co. Ltd. (Tianjin, China). Water used throughout the
study was obtained from a MilliQ Reagent Water System (Billerica, MA, USA). Unless otherwise stated,
all other chemicals were of analytical grade.
3.2. Preparation of Ginger Extract
Ginger was purchased from a farm product market (Zhengzhou, China) and identified as the
rhizome of Z. officinale by Professor Suiqing Chen at the Henan University of Chinese Medicine. A total
of 10 kg of ginger was cut into fine filaments and refluxed with 75% ethanol (1:10, w/v) twice for 1.5 h.
The combined solutions were filtered and concentrated to 0.5 g/mL, and the concentrates were purified
by D101 macroporous adsorption resin column chromatography using a gradient elution of 30%, 50%,
70%, and 95% ethanol. The 70% and 95% ethanol eluate were collected and evaporated under vacuum
to obtain a gingerol-enriched extract. LC–MS was employed to determine the contents of 6-gingerol,
6-shogaol, 8-gingerol, 8-shogaol, 10-gingerol, 10-shogaol, Zingerone, and 6-isodehydrogingenone in
the gingerol-enriched extract; the concentrations of each individual were 106.8, 42.9, 53.2, 27.4, 37.4,
23.5, 27.3, and 14.4 mg/g, respectively.
3.3. Animals and Pharmacokinetic Study
3.3.1. Animals
All protocols of animal experiments were performed in accordance with the guidelines of the
Committee on the Care and Use of Laboratory Animals in China. Forty-six Wistar rats (weight
200 ± 20 g) were obtained from Beijing Vital River Laboratory Animal Technology Co., Ltd. (Beijing,
China, Certificate No.: SCXK (Jing) 2016-0011). The rats were acclimated to standard housing (Henan
University of Chinese Medicine, Certificate No.: SCXK (Yu) 2015-0005) and environmental conditions
(25 ◦ C, 60% relative humidity) for 1 week. Before administration, rats were fasted for 12 h with access
to water freely.Molecules 2019, 24, 512 9 of 12
3.3.2. Oral Administration of Ginger Extract
The rats were orally administrated with a single dose of 400 mg/kg ginger extract. The oral
dose was calculated on the basis of the human dose in the Chinese Pharmacopoeia (2015) and a
pre-experiment which contained a certain amount of target components and could be detected in
plasma. Ten rats were used for blood collection, and the other thirty-six rats were used for the collection
of tissues. Extract of ginger was suspended in CMC–Na to obtain a stable solution. After administration,
blood samples were collected from the orbital venous plexus and placed into heparinized haemospasia
tubes at 0, 0.17, 0.33, 0.5, 1, 1.5, 2, 3, 4, 6, 8, 10, and 12 h after oral administration. The blood samples
were immediately centrifuged at 4000 rpm for 20 min at 4 ◦ C. The plasma was removed and frozen at
−80 ◦ C until analysis. For organ samples, after administration at 0.33, 0.5, 1, 1.5, 2, and 3 h (six rats at
each time), the rats were intraperitoneally anesthetized with 10% chloral hydrate and the liver, heart,
spleen, lung, kidney, stomach, intestine, and brain were isolated immediately. These collected tissue
samples were stored at −80 ◦ C until analysis.
3.4. Instruments and Experimental Conditions
Chromatographic analysis was performed on a Thermo UltiMate 3000 UPLC system with a
conditioned auto-sampler equipped with Syncronis C18 column (100 × 2.1 mm, 1.7 µm, Thermo
Fisher Scientific) and the column temperature was maintained at 30 ◦ C. A gradient elution with water
containing 0.1% formic acid (A) and acetonitrile (B) was used at a flow rate of 0.25 mL/min as follows:
0–6 min (60%–95% B); 6–9 min (95% B); 9.1–12 min (60% B). The injection volume was 5 µL.
Mass spectrometric detection was performed using a Thermo Q-Exactive-Qibitrap-MS (Thermo
Scientific, Waltham, MA, USA) with an electrospray Ionization (ESI) interface in the positive ionization
mode at full scan mode. The scope of data acquisition is m/z 100.0–1000.0. The optimal MS parameters
were as follows: Spray voltage 3.8 Kv (+); sheath gas flow rate, 40 arbitrary units; auxiliary gas flow rate,
10 arbitrary units; capillary temperature and auxiliary gas heater temperature, 350 ◦ C. The collision
gas (N2 ) for MS was maintained at 10 mL/min.
3.5. Sample Preparation
3.5.1. Calibration Standards and Quality Control Samples
The mixture stock solution of 6-gingerol, 6-shogaol, 8-gingerol, 8-shogaol, 10-gingerol, 10-shogaol,
Zingerone, and 6-isodehydrogingenone were prepared by dissolving the proper amounts of each
standard substance in 10 mL of methanol to yield concentrations of 416.7, 484.0, 1104.9, 471.6,
412.4, 400.0, 749.1, and 322.1 µg/mL, respectively. Stock solutions were prepared and serially
diluted to give working solutions used for validation experiments. The internal standard (IS)
stock solution (667 g/mL) was prepared by dissolving the proper amount of Atractylenolide I in
methanol. A 100 ng/mL working standard solution of IS was prepared by dilution with methanol.
Calibration standard samples were prepared by spiking blank plasma and tissues homogenate with
appropriate amounts of working solutions, yielding concentrations of 2.0–500.0 ng/mL for 6-gingerol,
6-shogaol, 8-gingerol, 8-shogaol, 10-gingerol and Zingerone, and 1.0–250.0 ng/mL for 10-shogaol and
6-isodehydrogingenone. Quality control (QC) samples were independently prepared in the same way
at 62.5, 250.0, and 500.0 ng/mL for 6-gingerol, 6-shogaol, 8-gingerol, 10-gingerol, and Zingerone; 15.6,
125.0, and 250.0 ng/mL for 8-shogaol, 10-shogaol and 6-isodehydrogingenone. The standard and
quality control samples were extracted on each analysis day using the same procedures for plasma
samples as described above.
3.5.2. Blood Samples
The plasma (200 µL) was spiked with 20 µL of IS (100 ng/mL) and 600 µL methanol vortexed for
1 min to precipitate proteins. The mixture was extracted by adding 800 µL ethyl acetate and oscillating
at room temperature for 5 min. After centrifugation for 10 min at 12,000 rpm, the supernatant wasMolecules 2019, 24, 512 10 of 12
transferred and evaporated to dry under a mild nitrogen flow at 40 ◦ C. The residue was dissolved in
100 µL methanol and centrifuged at 12,000 rpm for 10 min. Then 80 µL of supernatant were transferred
to sampling vials for the LC–MS system.
3.5.3. Tissue Samples
The thawed tissue samples (1.0 g) were homogenized in normal saline (2 mL), and diluted of
homogenate with 6 mL methanol, and then mixed with 20 µL of IS solution (100 ng/mL). A total of
5 mL supernatant was removed and extracted by adding 5 mL ethyl acetate and vortexed for 5 min,
then centrifuged at 12,000 rpm for 10 min. The above operation was repeated, and then the two
supernatants were combined and blow dried with nitrogen at 40 ◦ C. The residue was dissolved in
300 µL methanol and centrifuged at 12,000 rpm for 10 min. The supernatant was filtered through a
0.22 µm filter. A total of 5 µL of filtrate was subjected to the LC–MS system for analysis.
3.6. Method Validation
According to FDA guidance for validation of bioanalytical methods, the UPLC–Q-Exactive–HRMS
was established and validated for selectivity, linearity, precision, accuracy, matrix effect, extraction
recovery, and stability of the eight analytes in rat plasma and tissues [30].
4. Conclusions
A sensitive, rapid, and reliable UPLC–Q-Exactive–HRMS analytical method was established and
validated for the simultaneous determination and quantification of 6-gingerol, 6-shogaol, 8-gingerol,
8-shogaol, 10-gingerol, 10-shogaol, Zingerone, and 6-isodehydrogingenone in the plasma and tissues
of rats. The results demonstrated that of the active ingredients 6-gingerol, 6-shogaol, 8-gingerol,
8-shogaol, 10-gingerol, and Zingerone were absorbed rapidly into the circulatory system, while the
other components such as 10-shogaol and 6-isodehydrogingenone had relatively difficulty being
absorbed after oral administration of ginger extract. In addition, 6-shogaol and Zingerone were able to
penetrate the blood–brain barrier and enter the brain. These results demonstrated the pharmacokinetics
and tissue distribution of active ingredients of ginger in vivo, and provided useful information for
further pharmacological and clinical practice use of ginger.
Supplementary Materials: The Supplementary Materials are available online.
Author Contributions: Data curation, P.T.; funding acquisition, Y.C.; investigation, L.-L.L. and J.F.; methodology,
X.-H.G.; resources, K.M.; validation, J.-M.W.; writing—original draft, L.-L.L. All authors read and approved the
final manuscript.
Funding: This research was funded by National Natural Science Foundation of China (NO. 81473368) and
the Collaborative Innovation Center for Respiratory Disease Diagnosis and Treatment & Chinese Medicine
Development of Henan Province.
Conflicts of Interest: The authors declare no conflict of interest.
References
1. De Lima, R.M.T.; Dos Reis, A.C.; De Menezes, A.P.M.; Santos, J.V.O.; Filho, J.W.G.O.; Ferreira, J.R.O.;
De Alencar, M.V.O.B.; Da Mata, A.M.O.F.; Khan, I.N.; Islam, A.; et al. Protective and therapeutic potential of
ginger (Zingiber officinale) extract and [6]-gingerol in cancer: A comprehensive review. Phytother. Res. 2018,
32, 1885–1907. [CrossRef]
2. Shahidi, F.; Ambigaipalan, P. Phenolics and polyphenolics in foods, beverages and spices: Antioxidant
activity and health effects—A review. J. Funct. Foods 2015, 18, 820–897. [CrossRef]
3. Embuscado, M.E. Spices and herbs: Natural sources of antioxidants—A mini review. J. Funct. Foods 2015, 18,
811–819. [CrossRef]
4. Butt, M.S.; Sultan, M.T. Ginger and its health claims: Molecular aspects. Crit. Rev. Food Sci. 2011, 51, 383–393.
[CrossRef]Molecules 2019, 24, 512 11 of 12
5. Al-Suhaimi, E.A.; Al-Riziza, N.A.; Al-Essa, R.A. Physiological and therapeutical roles of ginger and turmeric
on endocrine functions. Am. J. Chin. Med. 2011, 39, 215–231. [CrossRef]
6. Konmun, J.; Danwilai, K.; Ngamphaiboon, N.; Sripanidkulchai, B.; Sookprasert, A.; Subongkot, S. A phase II
randomized double-blind placebo-controlled study of 6-gingerol as an anti-emetic in solid tumor patients
receiving moderately to highly emetogenic chemotherapy. Med. Oncol. 2017, 34, 69. [CrossRef]
7. Giacosa, A.; Morazzoni, P.; Bombardelli, E.; Riva, A.; Bianchi Porro, G.; Rondanelli, M. Can nausea and
vomiting be treated with ginger extract? Eur. Rev. Med. Pharmacol. Sci. 2015, 19, 1291–1296.
8. Ali, B.H.; Blunden, G.; Tanira, M.O.; Nemma, A. Review: Some phytochemical, pharmacological and
toxicological properties of ginger (Zingiber officinale Roscoe): A review of recent research. Food Chem. Toxicol.
2008, 46, 409–420. [CrossRef]
9. Vemuri, S.K.; Banala, R.R.; Subbaiah, G.P.V.; Srivastava, S.K.; Reddy, A.V.G.; Malarvili, T. Anti-cancer
potential of a mix of natural extracts of turmeric, ginger and garlic: A cell-based study. Egypt. J. Basic
Appl. Sci. 2017, 4, 332–344. [CrossRef]
10. Akimoto, M.; Iizuka, M.; Kanematsu, R.; Yoshida, M.; Takenaga, K. Anticancer effect of ginger extract against
pancreatic cancer cells mainly through reactive oxygen species-mediated autotic cell death. PLoS ONE 2015,
10, e0126605. [CrossRef]
11. Sharma, P.K.; Singh, V.; Ali, M.; Kumar, S. Effect of ethanolic extract of Zingiber officinale Roscoe on central
nervous system activity in mice. Indian J. Exp. Biol. 2016, 54, 664–669.
12. Semwal, R.B.; Semwal, D.K.; Combrinck, S.; Viljoen, A.M. Gingerols and shogaols: Important nutraceutical
principles from ginger. Phytochemistry 2015, 117, 554–568. [CrossRef]
13. Kaur, I.P.; Deol, P.K.; Kondepudi, K.K.; Bishnoi, M. Anticancer potential of ginger: Mechanistic and
pharmaceutical aspects. Curr. Pharm. Des. 2016, 22, 4160–4172. [CrossRef]
14. Jonathan, K.; Justin, S. Ginger: The root of cancer therapy? Lancet Oncol. 2012, 13, 235–236.
15. Chang, K.W.; Kuo, C.Y. 6-Gingerol modulates proinflammatory responses in dextran sodium sulfate
(DSS)-treated Caco-2 cells and experimental colitis in mice through adenosine monophosphate-activated
protein kinase (AMPK) activation. Food Funct. 2015, 6, 3334–3341. [CrossRef]
16. Young, H.Y.; Chiang, C.T.; Huang, Y.L.; Pan, F.P.; Chen, G.L. Analytical and stability studies of ginger
preparations. J. Food Drug Anal. 2002, 10, 149–153.
17. Mehdi, B.S.; Nurul Absar, B.M.; Bodiul Alam, R.; Mohammad, T.H.; Sinayat, M.; Naziat, U.; Ishrat, A.M.;
Farjana, A.; Ashraf, U.K.; Hannan, J.M.A. [6]-Gingerol, from Zingiber officinale, potentiates GLP-1 mediated
glucose-stimulated insulin secretion pathway in pancreatic β-cells and increases RAB8/RAB10-regulated
membrane presentation of GLUT4 transporters in skeletal muscle to improve hyperglycemia in Leprdb/db
type 2 diabetic mice. BMC Complement. Altern. Med. 2017, 17, 395. [CrossRef]
18. Ghasemzadeh, A.; Jaafar, H.Z.E.; Baghdadi, A.; Tayebi-Meigooni, A. Formation of 6-, 8- and 10-Shogaol in
Ginger through Application of Different Drying Methods: Altered Antioxidant and Antimicrobial Activity.
Molecules 2018, 23, 1646. [CrossRef]
19. Hitomi, S.; Ono, K.; Terawaki, K.; Matsumoto, C.; Mizuno, K.; Yamaguchi, K.; Imai, R.; Omiya, Y.; Hattori, T.;
Kase, Y. [6]-gingerol and [6]-shogaol, active ingredients of the traditional Japanese medicine hangeshashinto,
relief oral ulcerative mucositis-induced pain via action on Na+ channels. Pharmacol. Res. 2017, 117, 288–302.
[CrossRef]
20. Ho, S.C.; Chang, Y.H. Comparison of Inhibitory Capacities of 6-, 8-and 10-Gingerols/Shogaols on the
Canonical NLRP3 Inflammasome-Mediated IL-1 beta Secretion. Molecules 2018, 23, 466. [CrossRef]
21. Kapoor, V.; Aggarwal, S.; Das, S.N. 6-Gingerol mediates its anti-tumor activities in human oral and cervical
cancer cell lines through apoptosis and cell cycle arrest. Phytother. Res. 2016, 30, 588–595. [CrossRef]
22. Wang, S.; Tian, M.; Yang, R.; Jing, Y.; Chen, W.; Wang, J.; Zheng, X.; Wang, F. 6-Gingerol Ameliorates
Behavioral Changes and Atherosclerotic Lesions in ApoE−/− Mice Exposed to Chronic Mild Stress.
Cardiovasc. Toxicol. 2018, 18, 420–430. [CrossRef]
23. Han, H.S.; Kim, K.B.; Jung, J.H.; An, I.S.; Kim, Y.J.; An, S. Anti-apoptotic, antioxidant and anti-aging effects
of 6-shogaol on human dermal fibroblasts. Biomed. Dermatol. 2018, 2, 27. [CrossRef]
24. Lee, E.B.; Kim, J.H.; Kim, Y.J.; Noh, Y.J.; Kim, S.J.; Hwang, I.H.; Kim, D.K. Lifespan-extending property of
6-shogaol from Zingiber officinale Roscoe in Caenorhabditis elegans. Arch. Pharm. Res. 2018, 41, 743–752.
[CrossRef]Molecules 2019, 24, 512 12 of 12
25. Asami, A.; Shimada, T.; Mizuhara, Y.; Asano, T.; Takeda, S.; Aburada, T.; Miyamoto, K.I.; Aburada, M.
Pharmacokinetics of [6]-shogaol, a pungent ingredient of Zingiber officinale Roscoe (Part I). J. Nat. Med. Tokyo
2010, 64, 281–287. [CrossRef]
26. Yu, Y.K.; Zick, S.; Li, X.Q.; Zou, P.; Wright, B.; Sun, D.X. Examination of the Pharmacokinetics of Active
Ingredients of Ginger in Humans. AAPS J. 2011, 13, 417. [CrossRef]
27. Wang, W.; Li, C.Y.; Wen, X.D.; Li, P.; Qi, L.W. Simultaneous determination of 6-gingerol, 8-gingerol,
10-gingerol and 6-shogaol in rat plasma by liquid chromatography-mass spectrometry: Application to
pharmacokinetics. J. Chromatogr. B 2009, 877, 671–679. [CrossRef]
28. Feng, S.X.; Li, X.H.; Wang, M.M.; Hao, R.; Li, M.M.; Zhang, L.; Wang, Z. A sensitive HPLC-MS method for
simultaneous determination of thirteen components in rat plasma and its application to pharmacokinetic
study of Tanreqing injection. J. Pharm. Biomed. Anal. 2017, 148, 205–213. [CrossRef]
29. Wang, P.; Zhang, T.L.; Yu, G.H.; Li, M.J.; Su, J.; Zhang, J.Q.; Li, K.; Fu, Y.; Xu, H.Y.; Yang, H.J.
Poly-pharmacokinetic strategy-delineated metabolic fate of bioactive compounds in a traditional Chinese
medicine formula, Yuanhu Zhitong tablets, using parallel reaction monitoring mode. Phytomedicine 2019, 53,
53–61.
30. United States Food and Drug Administration. Bioanalytical Method Validation Guidance for Industry. 2018.
Available online: http://www.fda.gov/downloads/Drugs/GuidanceComplianceRegulatoryInformation/
Guidances/UCM070107.pdf (accessed on 24 May 2018).
31. Murthy, P.S.; Gautam, R.; Naik, J.P. Ginger oleoresin chemical composition, bioactivity and application as
bio-preservatives. J. Food Process. Preserv. 2015, 39, 1905–1912. [CrossRef]
32. Zhan, K.Y.; Xu, K.; Yin, H.Z. Preparative separation and purification of gingerols from ginger (Zingiber
officinale Roscoe) by high-speed counter-current chromatography. Food Chem. 2011, 126, 1959–1963.
[CrossRef]
33. Benzie, I.F.F.; Wachtel-Galor, S. The Amazing and Mighty Ginger—Herbal Medicine: Biomolecular and Clinical
Aspects; CRC Press: Boca Raton, FL, USA, 2011; Chapter 7.
34. Wang, X.; Zhao, X.; Gu, L.; Lv, C.; He, B.; Liu, Z.; Hou, P.; Bi, K.; Chen, X. Simultaneous determination
of five free and total flavonoids in rat plasma by ultra hplc-ms/ms and its application to a comparative
pharmacokinetic study in normal and hyperlipidemic rats. J. Chromatogr. B 2014, 953, 1–10. [CrossRef]
35. Huang, Y.; Sun, H.Y.; Qin, X.L.; Li, Y.J.; Liao, S.G.; Gong, Z.P.; Lu, Y.; Wang, Y.L.; Wang, A.M.; Lan, Y.Y.; et al.
A UPLC-MS/MS Method for Simultaneous Determination of Free and Total Forms of a Phenolic Acid and
Two Flavonoids in Rat Plasma and Its Application to Comparative Pharmacokinetic Studies of Polygonum
capitatum Extract in Rats. Molecules 2017, 22, 353. [CrossRef]
36. Min, G.; Ku, S.K.; Lee, T.; Bae, J.S. Suppressive effects of zingerone on TGFBIp-mediated septic responses.
Arch. Pharm. Res. 2018, 41, 276–287. [CrossRef]
37. Soliman, A.F.; Anees, L.M.; Ibrahim, D.M. Cardioprotective effect of zingerone against oxidative stress,
inflammation, and apoptosis induced by cisplatin or gamma radiation in rats. Naunyn-Schmiedeberg Arch.
Pharmacol 2018, 1–14. [CrossRef]
Sample Availability: Samples of the compounds are not available from the authors.
© 2019 by the authors. Licensee MDPI, Basel, Switzerland. This article is an open access
article distributed under the terms and conditions of the Creative Commons Attribution
(CC BY) license (http://creativecommons.org/licenses/by/4.0/).You can also read