Formic Acid Manufacture: Carbon Dioxide Utilization Alternatives - MDPI
←
→
Page content transcription
If your browser does not render page correctly, please read the page content below
applied
           sciences
Article
Formic Acid Manufacture: Carbon Dioxide
Utilization Alternatives
Marta Rumayor *, Antonio Dominguez-Ramos           ID
                                                        and Angel Irabien   ID

 Department of Chemical and Biomolecular Engineering, University of Cantabria, Av. Los Castros s/n,
 39005 Santander, Spain; antonio.dominguez@unican.es (A.D.-R.); angel.irabien@unican.es (A.I.)
 * Correspondence: marta.rumayor@unican.es; Tel.: +34-942-206-749

 Received: 7 May 2018; Accepted: 29 May 2018; Published: 2 June 2018

 Abstract: Carbon dioxide (CO2 ) utilization alternatives for manufacturing formic acid (FA) such as
 electrochemical reduction (ER) or homogeneous catalysis of CO2 and H2 could be efficient options for
 developing more environmentally-friendly production alternatives to FA fossil-dependant production.
 However, these alternatives are currently found at different technological readiness levels (TRLs),
 and some remaining technical challenges need to be overcome to achieve at least carbon-even FA
 compared to the commercial process, especially ER of CO2 , which is still farther from its industrial
 application. The main technical limitations inherited by FA production by ER are the low FA
 concentration achieved and the high overpotentials required, which involve high consumptions of
 energy (ER cell) and steam (distillation). In this study, a comparison in terms of carbon footprints
 (CF) using the Life Cycle Assessment (LCA) tool was done to evaluate the potential technological
 challenges assuring the environmental competitiveness of the FA production by ER of CO2 . The CF
 of the FA conventional production were used as a benchmark, as well as the CF of a simulated plant
 based on homogeneous catalysts of CO2 and H2 (found closer to be commercial). Renewable energy
 utilization as PV solar for the reaction is essential to achieve a carbon-even product; however, the CF
 benefits are still negligible due to the enormous contribution of the steam produced by natural gas
 (purification stage). Some ER reactor configurations, plus a recirculation mode, could achieve an
 even CF versus commercial process. It was demonstrated that the ER alternatives could lead to lower
 natural resources consumption (mainly, natural gas and heavy fuel oil) compared to the commercial
 process, which is a noticeable advantage in environmental sustainability terms.

 Keywords: carbon capture and utilization; formic acid; life cycle assessment; electrochemical reduction

1. Introduction
      Formic acid (FA) is a valuable chemical product that is difficult to replace in certain applications.
Its strong acidic and reducing properties make it useful in agriculture, pharmaceutics, food, textiles,
and chemicals. FA has recently been suggested as a promising hydrogen storage component via its
decomposition to CO2 and H2 with a possible reversible transformation back to regenerate formic acid,
which serves as a platform for chemical energy storage [1]. The conventional production processes of
FA are based mainly on fossil fuels utilization. Production processes of formic acid can be classified
into four groups: methyl formate hydrolysis, oxidation of hydrocarbons, hydrolysis of formamide,
and preparation of formic acid from formates. Among them, the methyl formate-based process route
is currently dominant [2]. Worldwide formic acid production capacity by hydrolysis of methyl formate
was estimated at 770 kton·year−1 in 2014, covering approximately 90% of the overall installed capacity.
This process involves a carbonylation of methanol and subsequent hydrolysis of the methyl formate
that is produced.

Appl. Sci. 2018, 8, 914; doi:10.3390/app8060914                                  www.mdpi.com/journal/applsci
Appl. Sci. 2018, 8, 914 2 of 12
Carbon dioxide (CO2 ) emissions during the production of FA that use hydrolysis of methyl
formate came from the required steam and syngas productions in the upstream processing. Syngas
is needed as CO in order to react with methanol; it may come from steam reforming of light ends,
as natural gas, from partial oxidation of fossil feedstocks or from coal gasification [3]. Limitations
of the FA conventional process can include slow reaction rate, undesirable by-products, high cost
of investment, and issues related to the environment such as the high energy requirements (in the
separation stage) and a noticeable dependence on fossil fuel (heavy fuel oil is used in the synthesis of
CO) [4]. Thus, in parallel to the alarming issue of the global warming and climate change, the depletion
of the mentioned fossil fuels, which must remain underground for generations to come, may seem less
evident. Therefore, it is not surprising that nowadays the utilization of CO2 is gaining momentum in
the scientific community and the industrial corporations in order to shift from conventional fossil-based
processes toward environmentally-friendly processes.
In that context, CO2 could be a feedstock for the production of a wide variety of fuels and
commodities including FA. The concept, known as CO2 valorisation, offers a potential solution
directed towards the pursuit of mitigation targets set by the COP21 Paris Agreement to abate the
problem of the greenhouse effect [5]. Undoubtedly, it cannot be claimed that climate change will be
solved merely by the utilization of CO2 to FA or any other reduced form of CO2 such as methanol,
syngas, methane, ethylene, etc., but the exploration of new alternatives to fossil-based production
routes shows a potential pathway with which to contribute to the curbing of CO2 emissions.
Some of the main available processes to convert CO2 into FA are homogeneous catalysis [6–8],
heterogeneous catalysis [9–12], photocatalytic reduction [13], and electrochemical reduction (ER) [14,15],
which share a substantial input of energy per unit of reduced CO2 [6]. These CO2 utilization
technologies for production of FA are currently found at different stages in terms of maturity.
The alternatives should be economically viable, safe, and sustainable for their final industrial
commercialization. The efforts are mainly focused on decreasing the overall energy consumption
of the processes. On one hand, thermocatalytic synthesis of FA from CO2 and H2 may be easily
adopted due to it being based on currently available technology; however, it needs a high heat input
or a heat integration [7]. Another approach is the photocatalytic method that could use visible light
directly [13], avoiding the associated carbon footprint of the energy conversion that it is still found
at lower TRLs. On the other hand, ER of CO2 is still behind in terms of TRLs compared to catalytic
ways but has the advantage that it can be fully developed at atmospheric temperature and pressure
in such a way that it can utilize surpluses of electricity from renewable sources [16,17]. Despite the
numerous advances and novel approaches in recent decades, the ER process remains challenging
because of (i) the high overpotential needed, (ii) the high consumption of steam of the final separation
step, (iii) the low solubility of CO2 at both ambient temperature and pressure, and (iv) the deactivation
and damage of the electrodes [18]. Continuous efforts are still required to achieve an efficient ER of
CO2 from the point of view of environmental sustainability. The development of highly active and
durable electrocatalysts for both the cathode (CO2 reduction reaction) and the anode (O2 evolution
reaction), as well as electrodes and electrolytes that have high conductivity and allow for sufficient
mass transport of the reactants and products to/from the catalyst layers, are some of the key points to
ensure environmental sustainability [19,20].
A recent economic-viability study of four possible routes for the ER of CO2 to liquid products
(including FA) has demonstrated that the primary economic limiting factor is the high capital expense
for the electrolyzer units [21]. Consequently, some technological challenges need to be overtaken to
make ER alternative an industrial viable option. It is clear that several options are available and, at least,
environmental sustainability must be analysed prior to any other economic or social consideration.
In this study, Life Cycle Assessment (LCA) is used as a decision-making tool for process development,
enabling the prediction of the sustainability implications of the different alternatives. LCA is a
widely used tool that is used to evaluate the net contribution of the use of carbon dioxide [22–25],
and thus it can be used to compare the FA conventional process with both CO2 utilization alternatives.Appl. Sci. 2018, 8, 914 3 of 12
In a previous study from the authors, it was concluded that the integration of renewable energy
was required to ensure the potential environmental sustainability of FA by ER synthesis based on
the champion lab data at the time of the study [26]. The results obtained in this study provide a
complete overview of the remaining technological challenges, especially for the competitiveness of
CO2 utilization plants based on ER as it remains in its infancy. The technological aspects included
in this study involve (1) reaction, by means of the concentration of FA at the outlet stream of the ER
cell, the cell voltage, the faradic efficiency, and the mode of operation (i.e., recirculation); and (2) the
separation step, by means of azeotropic distillation.
This work aims to compare, in terms of carbon footprint, the FA commercial production process
(fossil-based) with two of the main CO2 utilization alternatives of FA synthesis (homogeneous catalysts
and the novel ER of CO2 ) based on the latest available experimental developments [7,14,15]. Savings
in terms of raw materials are also included for a more fair comparison. The novelty of this work relies
on the use of new champion lab data, which show the tremendous progress taking place in the ER
research field in order to check if current technological developments can even out the conventional
production processes in terms of carbon footprint.
2. Methodology
A comparison of three options for the production of 1 kg of FA at commercial concentration
of 85% wt. (Figure 1) was completed in terms of carbon footprints (CFs). The FA manufacture
options consist of two CO2 utilization alternatives (based on ER of CO2 and homogeneous catalysis
of CO2 and H2 ) and a third one as benchmark in the form of the commercial conventional process.
CFs were determined by means of the LCA tool (cradle-to-gate approach). The CF assessment of
the alternative based on a ER of CO2 (AER ) was performed using the experimental data of three
selected available studies generating three ER scenarios labelled as A1.1, A1.2, and A1.3 [7,14,15].
A1.1 represents the current best performance within the research group of the authors. A1.2 and A1.3
represent the best champion data available in the literature regarding FA production by ER in terms of
concentration. Their estimated values of CF were then compared with those CF values corresponding
to the FA conventional (ACONV ) process [27] and the simulated CO2 utilization alternative based on
homogeneous catalysis of CO2 and H2, which was found in the literature (AJCR ) [6]. On one hand,
a comparison between the CF values of the three novel ER alternatives (A1.1, A1.2, and A1.3) and the
CF of ACONV was performed in order to provide an overview of the main remaining challenges to
achieve at least carbon neutral cycle of FA production by ER (which is still in development) compared
to the conventional route. On the other hand, the comparison of the results with the better-known
AJCR alternative was included in the study in order to reflect the different levels of development and
their viabilities for a final industrial competitiveness. Additionally an assessment of the amount of
raw materials needed in both CO2 utilization alternatives and the conventional process was done to
evaluate mainly the fossil fuel savings. The functional unit used in the study is defined as 1 kg of FA at
a commercial concentration of 85% wt. Ecoinvent 3.3 database [27] and GaBi Professional software [28]
were used in the background process.
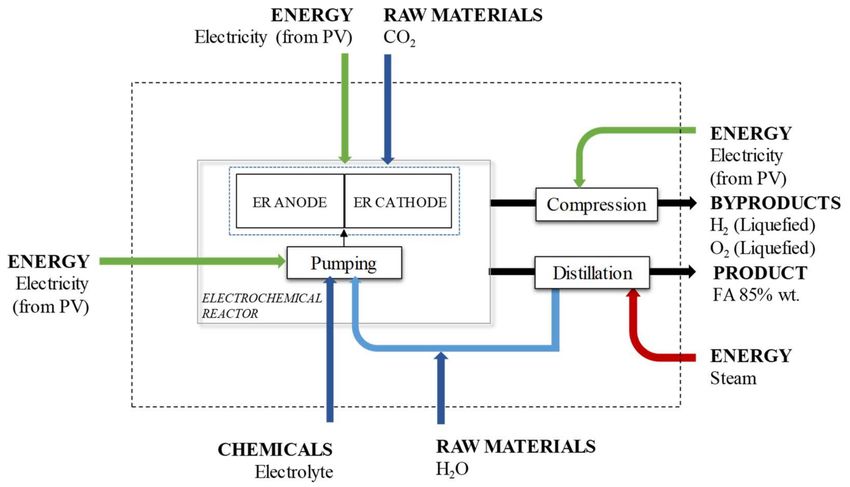
2.1. Alternative Based on Electrochemical Reduction CO2
To estimate the CF of the ER alternatives A1.1, A1.2, and A1.3, the LCA system framework was
set as in Figure 2. As it can be seen, there are three main steps: the ER of CO2 , the distillation of the
products, and the compression of parallel obtained byproducts such as H2 and O2 in a liquid form
ready to transport. Energy consumption is in the form of electricity or steam according to the nature of
each individual process.Appl. Sci. 2018, 8, 914 4 of 12
Figure 1. System frameworks: (a) alternative AER (scenarios A1.1, A1.2 and A1.3), (b) alternative AJRC ,
and (c) conventional ACONV .
Figure 2. CCU system framework.
Mass balances are based on the reaction of the CO2 ER shown in Table 1, assuming neutral
to alkaline conditions [29,30]. CO2 and water are injected in the cathode. As solubility of CO2 is
assumed to be very high, the soluble CO2 reaches the cathode surface. CO2 is reduced to formate
(HCOO− ) and H2 O to hydroxide ions (OH− ) in the presence of the correspondent electrolyte in the
cathodic compartment of the ER cell. Simultaneously, the formation of oxygen (O2 ) and protons (H+ )
is considered as the only reaction taking place in the anodic compartment. Both the formate ions
and hydroxide ions migrate to the centre compartment through the membrane, where they balance
the protons produced in the anode to form FA (HCOOH) and water (H2 O). In an ideal ER reactor,
an excellent electrode would lead to a value of 100% for the faradaic current efficiency (FE). This wouldAppl. Sci. 2018, 8, 914 5 of 12
correspond to the formation of pure HCOOH in the cathode and pure O2 in the anode. However,
a part of the applied current density is deviated to other parallel/parasitic reactions [30], reducing
the FE to FA production. In this study, H2 evolution reaction (HER) is assumed as the unique parallel
reaction. It is considered that water is the chemical compound that is consumed regardless of the pH
in the half-cell being acid or basic. The O2 evolution reaction (OER) is the only reaction taking place in
the anode.
Table 1. Main and side reactions.
Cathodic Reaction Anodic Reaction
CO2 + H2 O +2e− → HCOO− + OH−
H2 O → 2H+ + 2e− + 1/2 O2
2H2 O + 2e− → H2 + 2 OH−
Overall reaction
CO2 + 2H2 O → HCOOH + O2 + H2
A purification process in the form of a distillation is required to increase the FA concentration at
the outlet of ER to the accepted commercial concentration value at 85% wt. Therefore, cooling and
heating are needed. The distillation process was simulated in a previous study carried out by the
authors [26]. The simulation considers only presence of water (obtained as a head product) and FA
(obtained as the bottom product) at the required concentration. Distilled water is recirculated and
reinjected to the inlet freshwater stream to the cathode. Then, net water consumption is the difference
between water in the inlet stream and water that is recirculated. The pure O2 produced as a secondary
product, mainly by the anodic reaction, is separated, liquefied, and recovered, as well as H2 , which is
produced by the competing reaction, and it is assumed to be pure.
Finally, a summary of additional hypothesis that was taking into account in this work is listed next:
i A CO2 valorisation plant is in the same site of the CO2 source (no transport is required).
ii The feed of CO2 to the plant is assumed to be pure and with a suitable pressure for the ER process.
iii The feed of CO2 to the plant is assumed to be free of environmental burdens. The feedstock CO2
sourced to the plant is for free, so 100% of the burdens are allocated to the product that directly
releases the CO2, e.g., electricity forms a coal-fired power plant.
iv The vapour steam needed for FA purification exists in dry saturated conditions.
v Electrolytes used in the ER process can be perfectly separated and they are considered to be
avoided products.
vi The lifetimes of the electrode materials and catalysts are long enough to neglect their
carbon footprint.
Life Cycle Inventory (LCI) and LCA (cradle-to-gate analysis) were performed based on the
experimental conditions used in three different approaches of ER of CO2 to formate/formic acid
that were found in the literature. The selected references and their corresponding conditions are
summarized in Table 2. Data for A1.1 was obtained within the research group of the authors [15].
This work represents a relevant advance compared to previous results due to the high concentrations
obtained. A1.2 and A1.3 are, to the best of our knowledge, the performing champions in terms of
FA concentration. This way, it is possible to establish a benchmark for further developments as later
discussed. A1.2 and A1.3 [14] alternatives were selected because of their demonstrated capability
of producing FA concentrations of 10.0% wt. and 20.5% wt., respectively. Main difference between
A1.2 and A1.3 is their mode of operation, being single pass in the case of A1.2 (as in the case of A1.1)
and recirculated mode in the case of A1.3. Electrolyte flowrate used in A1.1 reference is an order of
magnitude higher than A1.2 and A1.3. Differences in electrode and membrane materials can be also
observed. They share mainly the cathode material in the form of Sn nanoparticles (Sn NPs) deposited
over a carbonaceous GDE. Regarding FE, A1.1 shows a higher value than A1.3 but is lower than A1.2.Appl. Sci. 2018, 8, 914 6 of 12
Catalytic electrode materials, reactor design, hydrodynamic conditions, current density, supporting
electrolyte, etc., could be potentially combined to yield the best FE.
Table 2. Experimental conditions of the selected references/scenarios for the carbon footprint of CO2
to formic acid.
UNITS A1.1 [15] A1.2 [14] A1.3 [14]
Cathode Sn NPs (Sn/C-GDEs) Sn NPs (Sn/C-GDEs) Sn NPs (Sn/C-GDEs)
Anode DSA/O2 (Ir-MMO on Pt) IrO2 on Toray paper IrO2 on Toray paper
Cation membrane material Dupont Nafion 324 Dupont Nafion 324
Dioxide Materials Dioxide Materials
Anion membrane material
SustanionTM SustanionTM
Current density, i mA·cm−2 200 140 140
Electrolyte flowrate to geometric mL·min−1 ·cm−2
70.0 6.00 6.00
projected cathodic area, Q/A (10−3 )
Geometric projected cathodic
cm2 10.0 5.00 5.00
area, A
Faradaic current efficiency, FE % 42.3 94.0 32.0
FA reaction rate, rFA mmol·m−2 ·s−1 4.38 2.22 4.63
Overall cell voltage, Ecell V 4.30 3.28 3.28
Concentration of FA, [FA] % wt. 1.68 10.0 20.5
Mode of operation Single pass Single pass Recirculated
The detailed LCIs for required materials and energy corresponding to each set of experimental
data were calculated by means of a sequence of energy and mass balances. More details can be found
in the supplementary data published in a previous study [26]. Mass balances were performed in each
unit, ensuring that there were no mass losses for any element. This methodology ensures that each
CCU-ER alternative is treated equally; thus, the results are directly comparable. The electricity needed
in the process, such as the electricity demanded in the reduction of CO2 to FA, the electricity for the
pumps within the reactor cell, and the electricity needed for liquefying both O2 and H2, was assumed
to come from the surplus production of renewable energy in the form of photovoltaic solar energy
(PV). Alternatively, wind power could be also considered. Surplus energy derives from avoiding
curtailment of PV solar or wind farms due to the possibility of injecting excess power in the CCU
facility. The periods in which the electricity generation exceeds the demand create a problem of
“surplus production”, which can help at the ER of CO2 . This selection determines the CF of each
unit of electricity used for the process, which in this case was 0.03 kg·kWh−1 [31]. The use of other
high-carbon source for the electricity consumption will make no sense for ER purposes [26]. Pumping
needs are derived from the need to overcome the pressure drop inside the reactors. Heat, as steam,
is a utility used in the distillation unit. The source for this steam is natural gas and the CF per unit of
steam used is 0.277 kg·kg−1 , which was obtained from Ecoinvent data [27].
2.2. Alternative Based on Homogeneous Catalysts of CO2 and H2 (AJCR )
The CCU alternative labelled as AJRC displayed a CF per unit mass of FA as low as 0.166 kg·kg−1
supported by a set of hypothesis [7]. The main hypothesis is (i) hydrogen needed by the AJRC plant is
supplied by water electrolysis, (ii) the CO2 use and capture plants are at the same site (no transport is
needed), and (iii) the compression of CO2 from atmospheric pressure to the pressure of the synthesis
process is allocated to the utilisation plant [7].
2.3. Conventional Production of Formic Acid (ACONV )
Conventional FA manufacture was assumed by means of hydrolysis of methyl formate. This route
consists on a two-stage process: in the first stage, methanol is carbonylated with carbon monoxide
(CH3 OH + CO → HCOOCH3 ), and in a second stage, methyl formate is hydrolysed to FA andAppl. Sci. 2018, 8, 914 7 of 12
methanol (CH3 OOCH + H2 O → CH3 OH + HCOOH). The CF of FA conventional process, as kg of
CO2 per kg of FA produced is 2.2 kg·kg−1 , which was obtained from Ecoinvent data [27]. This CF
value could decrease up to 2.07 kg·kg−1 whether PV solar was supplied to a FA conventional plant
instead electricity from the production mix.
3. Results and Discussions
3.1. Life Cycle Inventory of the Selected Alternatives and the Conventional Production Process
Table 3 shows a summary of the LCI results obtained at the outlet of the ER process assuming a
final concentration of FA at the bottom of the distillation column of 85% wt. for A1.1, A1.2, and A1.3 as
ER processes. Additionally, there are summarized values related to the commercial route of production
sourced from Ecoinvent [27] (ACONV ) and the alternative of the direct catalytic reaction of CO2 and H2
(AJCR ). The values summarized in Table 3 are grouped as electrode/catalyst materials, raw materials,
products (formic acid 85% wt.), other valuable products obtained in the process (H2 and O2 ), and energy
and heat demand (steam). This study considers that other salts and acids used in ER process can be
perfectly recirculated.
Table 3. LCI for the ER of CO2 according to the three selected experimental data references (A1.1,
A1.2, and A1.3), the conventional commercial process sourced from Ecoinvent [27] (ACONV ), and an
alternative CCU process based on the catalytic conversion of CO2 and H2 [7] (AJCR ). The functional
unit is 1 kg FA.
AER AJRC ACONV
UNITS A1.1 A1.2 A1.3
Electrode/Catalyst
TOTAL kg (10−6 ) 1.30 9.92 14.9 3.75 15.60
Raw materials
CO2 kg 0.95 0.96 0.96 0.83 -
H2 O kg 1.10 0.59 1.41 0.56 0.60
CO kg - - - - 0.61
CH3 OH kg - - - - 0.04
Products
HCOOH kg 1.00 1.00 1.00 1.00 1.00
H2 O kg 0.18 0.18 0.18 0.06 0.18
By-products
H2 kg (10−3 ) 59.00 3.00 92.00 −0.06 -
O2 kg 0.82 0.37 1.09 0.48 -
Energy
Electricity
ER kWh 11.80 4.59 11.93 - -
Pump kWh (10−3 ) 7.35 1.24 0.63 - -
Compression kWh 0.15 0.04 0.11 - -
TOTAL 11.80 4.59 11.90 4.07 0.29
Heat demand
Steam MJ 401.00 65.18 25.67 10.03 22.77
It can be seen in Table 3 that values of ER energy and steam are expected to be the main resources
contributing to the overall CF. The electricity consumption by ER per mass unit of FA ranges between
4.59 kWh·kg−1 and 11.93 kWh·kg−1 , with A1.2 alternative having the best conditions in terms of
electric consumption. The differences are mainly due to the combinations of reaction rates and cell
potentials at a certain current density. A1.2 has the lowest flow rate (for pumping) and the highest
Faradaic Efficiency. These values are well over the minimum theoretical electricity consumption of
1.72 kWh·kg−1 (originally 1.803 MWh·ton−1 when related to CO2 as reported in [17]). A1.1 alternative
exhibits the highest consumption of steam by unit of mass of FA 401 MJ·kg−1 , as the FA concentrationAppl. Sci. 2018, 8, 914 8 of 12
is lower than the concentration reached by the other references (A1.2 and A1.3 alternatives). As it was
mentioned above, surpluses of renewable energy from PV solar energy were supposed to be used
for supplying energy to ER, pumping, and compression. The wide range of consumption of steam
per mass unit of FA (from 401 MJ·kg−1 to 25.7 MJ·kg−1 ) highlights the significance of the purification
step. As it was expected, the higher FA concentration at the outlet of the ER cell, the lower steam
consumption (A1.3 scenario).
3.2. Carbon Footprint of the Selected Alternatives
After a proper LCI was available for each individual case of production of FA, the CF calculations
were accomplished with the values of the resources obtained in each alternative. It is worth mentioning
that no direct emissions from the ER process are considered. Also, it must be highlighted that the
CF calculation was run only for the A1.1, A1.2, and A1.3 alternatives, as the CF values for ACONV
and AJCR were provided by the corresponding references [6,7,27]. Ecoinvent database was used to
obtain the CO2 equivalent emissions for the requested resources such as conventional FA production,
H2 O, H2 , O2 , and steam [27], and the CO2 equivalent emissions for the requested PV solar energy
were based on the results of a previous study [31]. The CO2 used as feedstock was considered not to
contribute to the CF, as all the emissions are allocated to the corresponding main product, which can
be electricity in the case of a coal-fired power plant. Figure 3 displays the CF values corresponding
to each alternative, considering the next 5 resources: (i) steam for purification; (ii) avoided emissions
from the byproduct O2 ; (iii) avoided emissions from the byproduct H2 ; (iv) electricity as PV solar
energy for the reactor, the pumping, and the compression/liquefaction of H2 /O2 ; and, finally, (v) the
ionized water as raw material, using a functional unit of 1 kg of FA as reference, considering that the
FA is at a concentration of 85% wt. The mass of CO2 per mass unit of FA was excluded from the use of
resources, but in any case, it would represent a value of −1 kg·kg−1 . The CF of the electrode materials
and catalysers were neglected, as their lifetimes were assumed to be long enough.
Figure 3. CF values for the selected scenarios (functional unit is 1 kg of FA at a commercial concentration
of 85% wt).
It can be observed that the demand of steam for the purification stage is the main contribution
to GHG in all cases. However, there is a noticeable difference between A1.1 and both A1.2 and
A1.3. It should be remarked that in the case of A1.1, the concentration of FA in the inlet feed to the
distillation column was only 1.6% wt., while in cases A1.2 and A1.3 it was feed to the distillation
column a FA concentration of 10% wt. and 21% wt., respectively. The CF values as kg of CO2Appl. Sci. 2018, 8, 914 9 of 12
per kg of FA obtained for A1.1, A1.2, and A1.3, were 31.9 kg·kg−1 , 5.3 kg·kg−1 , and 1.6 kg·kg−1 ,
respectively. The scenarios used for comparison, ACONV , and AJCR , present CF values of 2.2 kg·kg−1
and 0.16 kg·kg−1 , respectively [7,27]. Additionally, it was mentioned above that CF of ACONV could
decrease up to 2.07 kg·kg−1 whether PV solar was supplied to the plant instead of electricity from
the production mix. It must be taken into consideration that in the alternative AJCR , H2 needed in the
process is supplied by water electrolysis; therefore, in its CF value (0.16 kg·kg−1 ), there is no explicit
mention of the contribution of conventional H2 production. If a conventional process was used for H2
production, it would be necessary to add its CF. The CF value, expressed as the mass of CO2 emitted
per kg of H2 produced, represents a value of 1.7 kg·kg−1 [27]. Adding 0.102 kg·kg−1 as CF would lead
to a total value of 0.26 kg·kg−1 . The small contribution of hydrogen is related to the use of just 1.38
times the stoichiometric amount of H2 . In the cases of ER, the avoided burdens from the recovery of
H2 and O2 have only a significant effect on A1.3. Values displayed in Figure 3 present positive values
due to those resources positive CF contributions and negative values from the avoided H2 and O2 .
As it was mentioned, the ER of CO2 to FA has also a positive effect in terms of environmental
sustainability: a reduction in the consumption of raw materials is also expected. An assessment of the
amount of raw materials needed was carried out in the ACONV , AJCR, and A1.3 scenarios. Table 4 shows
the quantities of raw materials needed for the production of 1 kg of FA. For a fair comparison, electricity
was assumed to be obtained from renewable energy in all scenarios. While for ACONV scenario, direct
figures of heavy oil and natural gas were provided, data for AJCR scenario were derived based on the
heating needs obtained from liquefied natural gas (LNG) combustion (54.40 MJ·kg−1 ) [32]. From the
point of view of natural resources consumption and their environmental implications, as in the case of
conventional fossil fuel utilization, the conventional/commercial fabrication of FA used as benchmark
presents higher consumption of natural gas and heavy fuel oil in comparison with both A1.3 and AJCR
alternatives. Conventional production of 1 kg FA requires the consumption of natural gas for heating
purposes of 0.246 kg·kg−1 , which is in the same order of magnitude than the values of natural gas for
heating of both AJCR and A1.3. However, it must be taken into account that the conventional FA route
of hydrolysis of methyl formate, which is obtained by carbonylation of methanol, involves a second
consumption of natural gas at high pressure for production of the methanol [27]. This additional
consumption of natural gas per kg of FA represents an overall consumption of natural gas higher
than both CO2 valorisation options. In addition, conventional production of 1 kg of FA from MeOH
and CO involves a consumption of catalysts per unit of mass of FA of 15.6 × 10⁻⁶ kg·kg−1 (such as
aluminium oxide, copper oxide, molybdenum, nickel, and zinc) as sourced from Ecoinvent data [27].
In the AJCR scenario, 3.75 × 10⁻⁶ kg of ruthenium and phosphine-based catalysts are reported to be
consumed per kg of FA produced [7]. In the case of A1.3, 14.88 × 10⁻⁶ kg of catalysts are needed for
the production of 1 kg of FA. Alternative AJCR needs 0.060 kg of H2 per kg of FA that is produced.
In the study, it was assumed that H2 came from an in-situ electrolyser. However, in a worst scenario,
hydrogen would be produced conventionally at refineries by (i) steam reforming of light ends or
natural gas (the most common production route in Europe); (ii) partial oxidation (gasification) of
heavy oil fractions (produces syngas, from which hydrogen can be separated; and (iii) coal or coke
gasification, representing additional fossil fuel consumption in the alternative AJRC .
Table 4. Consumption of raw materials (per unit of kg of FA).
Raw Materials Consumption
Unit ACONV [27] A1.3 AJCR
Heavy fuel oil kg 0.405
Natural gas (heat) kg 0.273 0.423 0.166
Natural gas at high pressure * kg 1.250
Hydrogen kg 0.060 **
* At 60 bar, 15 ◦ C,
the natural gas density used is 48 kg·m−3(original value was expressed as m3 ); ** in the original
reference, 90 kg·h−1 of H2 is used to produce 1500 kg·h−1 of FA.Appl. Sci. 2018, 8, 914 10 of 12
3.3. Remaining Challenges
CO2 valorisation technologies for production of FA are attractive options that can potentially
reduce both the greenhouse effect and the depletion of fossil resources for industrial processes.
However, it is still necessary to further improve some technical aspects to produce FA at higher
concentrations. This fact must be enough to decrease the high demand of steam in the purification
stage that can finally neutralise the CF values with respect to the conventional production process
(ACONV ) attracting an industrial interest in a more sustainable process. Using renewable energy is
another one of the most important approaches to achieve an even carbon cycle. However, in most cases,
the high demand of steam in the purification stage overlaps the use of renewable energy, no matter if
PV solar or wind energy is used. A future challenge also includes the fact that the steam could come
also from a renewable source.
On one hand, it has been already demonstrated that in the alternative of homogeneous catalysts,
hydrogen synthesis is the weak spot [6]. It should be further studied and optimised, as it would
be one of the main contributors to the high environmental costs through electricity consumption
(indirect emissions).
On the other hand, ER, which is at lower level of development, needs further improvement of its
energetic efficiencies that are achieved at higher FE values. Some factors such as catalysts, electrodes,
electrolytes (composition and pH), and cell configuration could to be further improved [19] for better
efficiencies. In fact, during the past decades, efforts have focused on the development of metal catalyst.
Pb, Hg, In, Sn, Cd, and Tl are metals generally used to produce FA [33]. N-doped porous carbon
materials insulating with polymer binders, such as Nafion or PVDF, are commonly used. This is an
attractive option due to their low cost, large surface areas, metal-free nature, chemical stability, tunable
conductivity, and electrochemical activity [34]. New developments based on dendritic copper-indium
alloys have demonstrated their capability at enhancing the control over the product distribution
being an inexpensive and efficient option for the production of fuels [35]. It is known that competing
H2 evolution reaction by N-doped carbons in water is sluggish and kinetically negligible under
appropriate conditions. In recent years, the use of solid polymers electrolytes has being presented as a
powerful alternative to overcome electrode corrosion and the lifetime increase [36]. Yang et al. 2017
demonstrated that an unsuitable choice of the cation exchange membrane may be a significant potential
source of FE loss in the formic acid cell [14]. Nafion 324 membrane was the preferred membrane, as is
shown in the lowest transport of formate ions into the anode (cases S2 and S3). Finally, an efficient
mode of operation of the electrolytic reactor, such as recirculation mode, is necessary to achieve at least
an FA concentration of 20% wt. to obtain an even CF compared to the FA conventional process.
4. Conclusions
CO2 utilisation techniques for the production of FA have been demonstrated to be attractive
alternatives compared to the fossil-dependant routes. They show potentially similar CF values and
a net replacement of the consumption of fossil fuels under proper future technical developments.
This study shows two CCU options at different technological readiness levels. The results displayed
that the alternative of ER of CO2 to FA can be redesigned to provide even CF values compared to
commercial production processes, including a reduction in the consumption of raw materials of fossil
origin in the whole supply chain. This means that a noticeable increase in the concentration of the
HCOOH at the ER reactor is needed. Utilization of renewable energy such as PV solar energy is
one of the most important restrictions for achieving production of FA with a more even CF value
than the conventional production route of FA; however, the contribution of the CF of the electricity
from the PV solar is still dwarfed by the CF derived from the high requirement of steam in the
purification stage in order to reach commercial purity (heating for distillation sourced mainly from the
combustion of natural gas). The optimization of the electrolytic reactor is still needed in the common
ER configurations. An increment of FA concentration in the outlet stream of ER reactor up to 21% wt.
demonstrated even steam consumption with respect to the conventional process of FA production.Appl. Sci. 2018, 8, 914 11 of 12
Author Contributions: M.R., A.D.-R., and A.I. conceptualized this research work; M.R. carried out the
investigation tasks and prepared the original draft. A.D.-R. and A.I. wrote, reviewed, and edited the manuscript.
A.I. supervised the investigation and acquired the funding.
Funding: This research was funded by the Spanish Ministry of Economy and Competitiveness (MINECO) through
the project CTQ2016-76231-C2-1-R. Marta Rumayor contract was funded by the Spanish Ministry of Economy and
Competitiveness (MINECO) through a Juan de la Cierva postdoctoral contract (FJCI-2015-23658).
Acknowledgments: Authors thank Spanish Ministry of Economy and Competitiveness (MINECO) for the
financial support through the project CTQ2016-76231-C2-1-R. We would like also to thank MINECO for providing
Marta Rumayor with a Juan de la Cierva postdoctoral contract (FJCI-2015-23658).
Conflicts of Interest: The authors declare no conflict of interest.
References
1. Grasemann, M.; Laurenczy, G. Formic acid as a hydrogen source—Recent developments and future trends.
Energy Environ. Sci. 2012, 5, 8171–8181. [CrossRef]
2. Hietala, J.; Vouri, A.; Pekka, J.; Ilkka, P.; Reutemann, W.; Heinz, K. Formic Acid. In Ullmann’s Encyclopedia of
Industrial Chemistry; Wiley-VCH: Weinheim, Germany, 2000; pp. 1–22, ISBN 9783527306732.
3. Arvola, J. Reducing Industrial Use of Fossil Raw Materials: Techno-Economic Assessment of Relevant Cases in
Northern Finland; University of Oulu: Oulu, Finland, 2011; ISBN 9789514296888.
4. Sharma, S.; Patle, D.S.; Gadhamsetti, A.P.; Pandit, S.; Manca, D.; Nirmala, G.S. Intensification and
performance assessment of the formic acid production process through a dividing wall reactive distillation
column with vapor recompression. Chem. Eng. Process. Process Intensif. 2018, 123, 204–213. [CrossRef]
5. United Nations Framework Convention on Climate Change (UNFCCC). The Paris Agreement. Available
online: http://unfccc.int/paris_agreement/items/9485.php (accessed on 31 October 2017).
6. Pérez-Fortes, M.; Schöneberger, J.C.; Boulamanti, A.; Harrison, G.; Tzimas, E. Formic acid synthesis using CO2
as raw material: Techno-economic and environmental evaluation and market potential. Int. J. Hydrog. Energy
2016, 41, 16444–16462. [CrossRef]
7. Pérez-Fortes, M.; Tzimas, E. Techno-Economic and Environmental Evaluation of CO2 Utilisation for Fuel
Production—Synthesis of Methanol and Formic Acid; Publications Office of the European Union: Luxembourg,
2016. [CrossRef]
8. Wang, W.-H.; Himeda, Y.; Muckerman, J.T.; Manbeck, G.F.; Fujita, E. CO2 Hydrogenation to Formate and
Methanol as an Alternative to Photo- and Electrochemical CO2 Reduction. Chem. Rev. 2015, 115, 12936–12973.
[CrossRef] [PubMed]
9. Maru, M.S.; Ram, S.; Shukla, R.S.; Noor-ul, H.K. Ruthenium-hydrotalcite (Ru-HT) as an effective
heterogeneous catalyst for the selective hydrogenation of CO2 to formic acid. Mol. Catal. 2018, 446,
23–30. [CrossRef]
10. Hariyanandam, G.G.; Hyun, D.; Natarajan, P.; Jung, K.-D.; Yoon, S. An effective heterogeneous Ir(III) catalyst,
immobilized on a heptazine-based organic framework, for the hydrogenation of CO2 to formate. Catal. Today
2016, 265, 52–55. [CrossRef]
11. Yang, Z.-Z.; Zhang, H.; Yu, B.; Zhao, Y.; Ji, G.; Liu, Z. A Troger’s base-derived microporous organic polymer:
Design and applications in CO2 /H2 capture and hydrogenation of CO2 to formic acid. Chem. Commun. 2015,
51, 1271–1274. [CrossRef] [PubMed]
12. Yan, N.; Philippot, K. Transformation of CO2 by using nanoscale metal catalysts: Cases studies on the
formation of formic acid and dimethylether. Curr. Opin. Chem. Eng. 2018, 20, 86–92. [CrossRef]
13. Suzuki, T.M.; Takayama, T.; Sato, S.; Iwase, A.; Kudo, A.; Morikawa, T. Enhancement of CO2 reduction
activity under visible light irradiation over Zn-based metal sulfides by combination with Ru-complex
catalysts. Appl. Catal. B Environ. 2018, 224, 572–578. [CrossRef]
14. Yang, H.; Kaczur, J.J.; Sajjad, S.D.; Masel, R.I. Electrochemical conversion of CO2 to formic acid utilizing
SustainionTM membranes. J. CO2 Util. 2017, 20, 208–217. [CrossRef]
15. Del Castillo, A.; Alvarez-Guerra, M.; Solla-Gullón, J.; Sáez, A.; Montiel, V.; Irabien, A. Sn nanoparticles on
gas diffusion electrodes: Synthesis, characterization and use for continuous CO2 electroreduction to formate.
J. CO2 Util. 2017, 18, 222–228. [CrossRef]
16. Ganesh, I. Electrochemical conversion of carbon dioxide into renewable fuel chemicals—The role of
nanomaterials and the commercialization. Renew. Sustain. Energy Rev. 2016, 59, 1269–1297. [CrossRef]Appl. Sci. 2018, 8, 914 12 of 12
17. Kauffman, D.R.; Thakkar, J.; Siva, R.; Matranga, C.; Ohodnicki, P.R.; Zeng, C.; Jin, R. Efficient Electrochemical
CO2 Conversion Powered by Renewable Energy. ACS Appl. Mater. Interfaces 2015, 7, 15626–15632. [CrossRef]
[PubMed]
18. Kondratenko, E.V.; Mul, G.; Baltrusaitis, J.; Larrazábal, G.O.; Pérez-Ramírez, J. Status and perspectives
of CO2 conversion into fuels and chemicals by catalytic, photocatalytic and electrocatalytic processes.
Energy Environ. Sci. 2013, 6, 3112–3135. [CrossRef]
19. Jhong, H.R.M.; Ma, S.; Kenis, P.J. Electrochemical conversion of CO2 to useful chemicals: Current status,
remaining challenges, and future opportunities. Curr. Opin. Chem. Eng. 2013, 2, 191–199. [CrossRef]
20. Feaster, J.T.; Shi, C.; Cave, E.R.; Hatsukade, T.; Abram, D.N.; Kuhl, K.P.; Hahn, C.; Nørskov, J.K.; Jaramillo, T.F.
Understanding Selectivity for the Electrochemical Reduction of Carbon Dioxide to Formic Acid and Carbon
Monoxide on Metal Electrodes. ACS Catal. 2017, 7, 4822–4827. [CrossRef]
21. Spurgeon, J.; KUMAR, B. A comparative technoeconomic analysis of pathways for commercial
electrochemical CO2 reduction to liquid products. Energy Environ. Sci. 2018. [CrossRef]
22. The Royal Society. The Potential and Limitations of Using Carbon Dioxide. 2017. Available online: www.
royalsociety.org/low-carbon-energy-programme (accessed on 22 May 2018).
23. Von der Assen, N.; Jung, J.; Bardow, A. Life-Cycle Assessment of Carbon Dioxide Capture and Utilization:
Avoiding the Pitfalls. Energy Environ. Sci. 2013, 6, 2721–2734. [CrossRef]
24. Von der Assen, N.; Voll, P.; Peters, M.; Bardow, A. Life cycle assessment of CO2 capture and utilization:
A tutorial review. Chem. Soc. Rev. 2014, 43, 7982–7994. [CrossRef] [PubMed]
25. Cuéllar-Franca, R.M.; Azapagic, A. Carbon capture, storage and utilisation technologies: A critical analysis
and comparison of their life cycle environmental impacts. J. CO2 Util. 2015, 9, 82–102. [CrossRef]
26. Dominguez-Ramos, A.; Singh, B.; Zhang, X.; Hertwich, E.G.; Irabien, A. Global warming footprint of the
electrochemical reduction of carbon dioxide to formate. J. Clean. Prod. 2015, 104, 148–155. [CrossRef]
27. Swiss Centre for Life Cycle Inventories. The Ecoinvent Database Version 3. Available online: http://www.
ecoinvent.org (accessed on 22 May 2018).
28. GaBi v8 LCA Software-System and Database for Life Cycle Engineering. Avaliable online: http://www.
gabi-software.com/hongkong/databases/ (accessed on 2 June 2018).
29. Li, H.; Oloman, C. Development of a continuous reactor for the electro-reduction of carbon dioxide to
formate—Part 1: Process variables. J. Appl. Electrochem. 2006, 36, 1105–1115. [CrossRef]
30. Oloman, C.; Li, H. Electrochemical processing of carbon dioxide. ChemSusChem 2008, 1, 385–391. [CrossRef]
[PubMed]
31. Dominguez-Ramos, A.; Held, M.; Aldaco, R.; Fischer, M.; Irabien, A. Prospective CO2 emissions from energy
supplying systems: Photovoltaic systems and conventional grid within Spanish frame conditions. Int. J. Life
Cycle Assess. 2010, 15, 557–566. [CrossRef]
32. International Energy Agency (IEA). Statistics Manual. Available online: https://www.iea.org (accessed on
17 January 2018).
33. Endrödi, B.; Bencsik, G.; Darvas, F.; Jones, R.; Rajeshwar, K.; Janáky, C. Continuous-flow electroreduction of
carbon dioxide. Prog. Energy Combust. Sci. 2017, 62, 133–154. [CrossRef]
34. Dai, L.; Xue, Y.; Qu, L.; Choi, H.J.; Baek, J.B. Metal-Free Catalysts for Oxygen Reduction Reaction. Chem. Rev.
2015, 115, 4823–4892. [CrossRef] [PubMed]
35. Hoffman, Z.B.; Gray, T.S.; Moraveck, K.B.; Gunnoe, T.B.; Zangari, G. The Electrochemical Reduction of
Carbon Dioxide to Syngas and Formate at Dendritic Copper-Indium Electrocatalysts. ACS Catal. 2017, 7,
5381–5390. [CrossRef]
36. Aeshala, L.M.; Rahman, S.U.; Verma, A. Effect of solid polymer electrolyte on electrochemical reduction of
CO2 . Sep. Purif. Technol. 2012, 94, 131–137. [CrossRef]
© 2018 by the authors. Licensee MDPI, Basel, Switzerland. This article is an open access
article distributed under the terms and conditions of the Creative Commons Attribution
(CC BY) license (http://creativecommons.org/licenses/by/4.0/).You can also read


