OCI Partners LP
Corporate Presentation
September 2016
←
→
Page content transcription
If your browser does not render page correctly, please read the page content below
OCI Partners LP Corporate Presentation September 2016
Safe Harbor Provision
Unless the context otherwise requires, references in this presentation to “our partnership,” “we,” “our,” “us” and similar terms, when used in a historical context, refer to the business and
operations of OCI Beaumont LLC, a Texas limited liability company (“OCIB”) that OCI USA Inc. will contribute to OCI Partners LP in connection with this offering. When used in the present
tense or future tense, those terms and “OCI Partners LP” and “OCIP” refer to OCI Partners LP, a Delaware limited partnership, and its subsidiaries, including OCIB. References to “our
general partner” refer to OCI GP LLC, a Delaware limited liability company and a wholly owned subsidiary of OCI USA Inc. References to “OCI” refer to OCI N.V., a Dutch public limited
liability company, and its consolidated subsidiaries other than us, our subsidiaries and our general partner. References to “OCI USA” refer to OCI USA Inc., a Delaware corporation, which is
an indirect wholly owned subsidiary of OCI. References to “OCI Fertilizer” refer to OCI Fertilizer International B.V., a Dutch private limited liability company, which is an indirect wholly
owned subsidiary of OCI.
This presentation may contain forward‐looking statements that are based upon current expectations and involve a number of risks and uncertainties. Statements that are predictive in
nature, that depend upon or refer to future events or conditions or that include the words “will,” “believe,” “expect,” “anticipate,” “intend,” “estimate” and other expressions that are
predictions of or indicate future events and trends and that do not relate to historical matters identify forward-looking statements. Statements concerning our current estimates,
expectations and projections about our future results, performance, prospects and opportunities and other statements, concerns, or matters that are not historical facts are
"forward‐looking statements," as that term is defined under United States securities laws. These statements involve known and unknown risks, uncertainties and other factors that may
cause our actual results and performance to be materially different from any future results or performance expressed or implied by these forward-looking statements.
Investors are cautioned that the following important factors, among others, may affect these forward‐looking statements. These factors include but are not limited to: risks and
uncertainties with the respect to the quantities and costs of natural gas, the costs to acquire feedstocks and the price of the refined products we ultimately sell; management's ability
to execute its strategy; our competitive position and the effects of competition; the projected growth of the industry in which we operate; changes in the scope, costs, and/or timing of
capital projects; general economic and business conditions, particularly levels of spending relating to demand for methanol and ammonia; our ability to operate as an MLP; changes in
the regulatory and/or environmental landscape; potential conflicts of interest between OCI USA and other unitholders; and other risks contained in our registration statement
(including a prospectus) filed with the United States Securities and Exchange Commission (the “SEC”).
Forward‐looking statements should not be read as a guarantee of future performance or results and will not be accurate indications of the times at or by which such performance or
results will be achieved. Forward‐looking information is based on information available at the time and/or management's good faith belief with respect to future events, and is subject
to risks and uncertainties that could cause actual performance or results to differ materially from those expressed in the statements. OCI Partners LP undertakes no obligation to
update or revise any such forward‐looking statements.
The Partnership has filed a registration statement (including a prospectus) with the SEC for the offering to which this presentation relates. Before you invest, you should read the
prospectus in that registration statement and other documents the Partnership has filed with the SEC for more complete information about the partnership and this offering. You may
get these documents for free by visiting EDGAR on the SEC website at www.sec.gov. Alternatively, the Partnership, any underwriter or any dealer participating in the offering will
arrange to send you the prospectus if you request it by emailing BofA Merrill Lynch at dg.prospectus_requests@baml.com or by calling either Barclays at (888) 603-5847 or Citigroup at
(800) 831-9146.
OCI Partners LP’s registration statement has not yet become effective and OCI Partners LP’s common units representing limited partnership interests may not be sold nor may offers to
buy be accepted prior to the time the registration statement becomes effective. The offering of the common units representing limited partner interests is being made by means of the
prospectus only, copies of which may be obtained from the underwriters as noted above.
This presentation is not, and under no circumstances is to be construed to be, a prospectus, offering memorandum, advertisement and is not an offer to sell securities. The SEC and
state securities regulators have not reviewed or determined if this presentation is truthful or complete.
Non-GAAP Financial Measures Disclosure
Today’s presentation includes certain non-GAAP financial measures as defined under Regulation G of the Securities Exchange Act of 1934, as amended. A reconciliation of those
measures to the most directly comparable GAAP measures is available in the appendix to this presentation.

                                                                                                                                                                                            2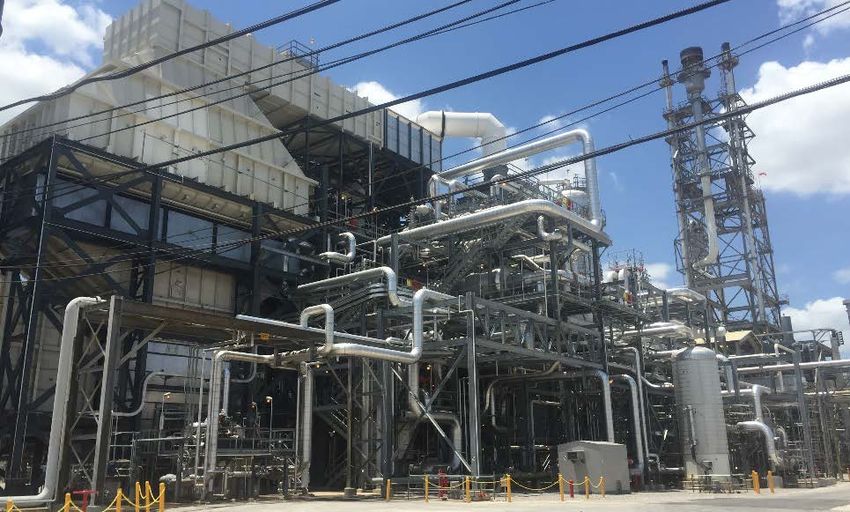
Partnership Overview
Partnership Overview
Organizational Structure

                                                                                           OCI N.V.
                                                                                        (NYSE Euronext
                                                                                      Amsterdam: OCI:NA)
                                                                                    100% indirect ownership
                                                                                            interest

                                                                                         OCI USA Inc.
                                                                                   69,497,590 common units

                                  OCI GP LLC
                                                                                      80% limited partner                            Public Unitholders
                             (our general partner)
                                                                                            interest                                17,500,000 common
                                                                           (1)                                                              units
                                                          Non-economic                                    20% limited partner
                                                      general partner interest                                  interest

                                                                                         OCI Partners LP
                                                                                          (NYSE: OCIP)

                                                                                    100% ownership interest

                                                                                       OCI Beaumont LLC

                                                                                   New Capital Injection
                    New Shares Issued                                                                                           Capital Structure
       Common Units (mm)                                    3,502,218                            OCI NV units (mm)                                    69,497,590   79.88%
       Share Price ($)                                         17.132                            Public Unitholders units (mm)                        17,500,000   20.12%

       Total Capital ($)                                  60,000,000                               Total Shares Outstanding                           86,997,590    100%

       ___________________________________
       (1) No excess distribution coverage and GP has non-economic interest and no incentive distribution rights
                                                                                                                                                                            4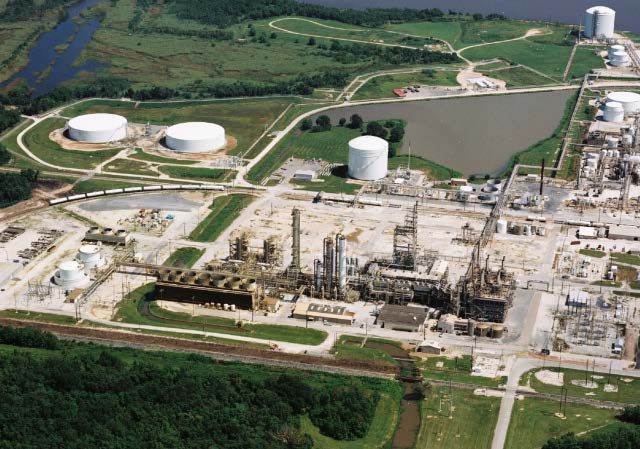
Partnership Overview
Asset History of OCI Beaumont

              DuPont builds 600         Start-up of the                       OCI N.V. acquires          Ammonia                  Debottlenecking
              Ktpa methanol             ammonia plant                         minority stake             production at the        process completed
              plant, largest in          built by Foster                      securing 100%              facility begins in       in 1Q 2015
              the world at the          Wheeler with a                        ownership of the           December
               time                     Haldor Topsoe                         plant
                                        process design
                                                                                    2011                                                    2015
                    1967                        2000                                                              2011

   Key
Milestones                                                                   2004
                  1980s                  1997
                                                                        Terra shuts-
                                                                        Down methanol                                                    2012
              Modernization of      Terra adds a 250                                                     2011
              The methanol unit     mtpa ammonia                        production                                                Methanol
              using Lurgi GmbH’s    synthesis loop to                                                OCI N.V. and its             production at the
              Low Pressure          The methanol                                                     partner acquire              facility begins in
              Methanol              plant                                                            the plant from               July
              technology                                                                             Eastman Chemical

                                                                                                                                     1,244
                                                                                                            995
                                                       850                   850                                                      331
    Plant                    600                                                                            265
                                                       250                   250
  Capacity                                                                                                                            913
                             600                       600                   600                            730
 (‘000 tpa)
                             1967                  1997                     2003                         4Q 2012                   1Q 2015
                                                                                                                              (Post-Debottleneck)
                                                             Methanol     Ammonia       Total Capacity

                                                                                                                                                       5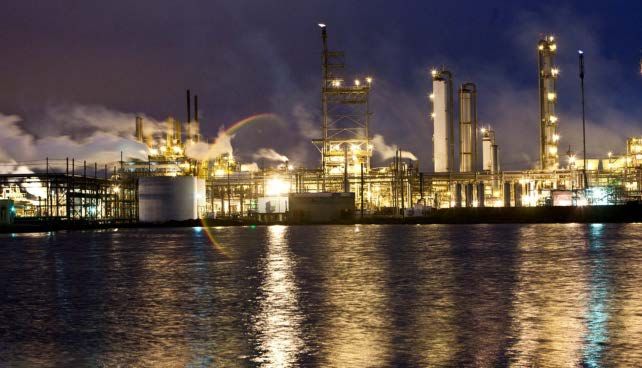
Partnership Overview
OCI Partners Summary
•       OCI’s facility near Beaumont, TX (“OCI Beaumont”) is an integrated methanol and ammonia facility strategically located on the Texas Gulf
        Coast
•       OCI N.V. acquired the Beaumont plant from Eastman Chemical Company in May 2011. Previously the Beaumont plant was owned by Terra
        Industries and DuPont, and was shut down from 2004 until OCI’s acquisition in 2011
•       Following a comprehensive upgrade, methanol and ammonia production commenced in July 2012 and December 2011, respectively
•       Partnership has completed all work related to debottlenecking project in 1Q 2015, with ammonia and methanol lines restarted in 2Q
              –   Increased methanol production capacity by 25% to 912,500 mtpa
              –   Increased ammonia production capacity by 25% to 331,000 mtpa
•       Partnership recently implemented a state-of-the-art methanol and ammonia truck loading facility on-site and expects to sell 80,000 mtpa
        via the new facility

                                                                                    Facility Overview

                                                              Capacity                                                                   Key Information
                                                             Production      Current Production         Product
                      Pre – Debottlenecking
    Product
                             Capacity
                                                             During Full       Capacity post-           Storage       Ownership      •    100%
                                                             Year 2014     Debottlenecking Project      Capacity

                                                                           Metric                                                    •    Volumes contractually secured
                    Metric           Metric Tons/                                        Metric          Metric       Natural Gas
                                                            Metric Tons    Tons/
                   Tons/Day            Year (1)                                        Tons/ Year (1)    Tons                             and pricing based on spot
                                                                            Day                                       Supply
                                                                                                                                          market
                                                                                                          42,000
    Methanol          2,000             730,000                617,031      2,500        912,500
                                                                                                        (two tanks)
                                                                                                                                     •    Direct sales to customers by
                                                                                                          33,000
                                                                                                                      Distribution
    Ammonia            726              264,990                259,214       907         331,000                                          truck, pipeline, and barges
                                                                                                        (two tanks)

                  ___________________________________
                  (1) Assumes facility operates for a full year.
                                                                                                                                                                         6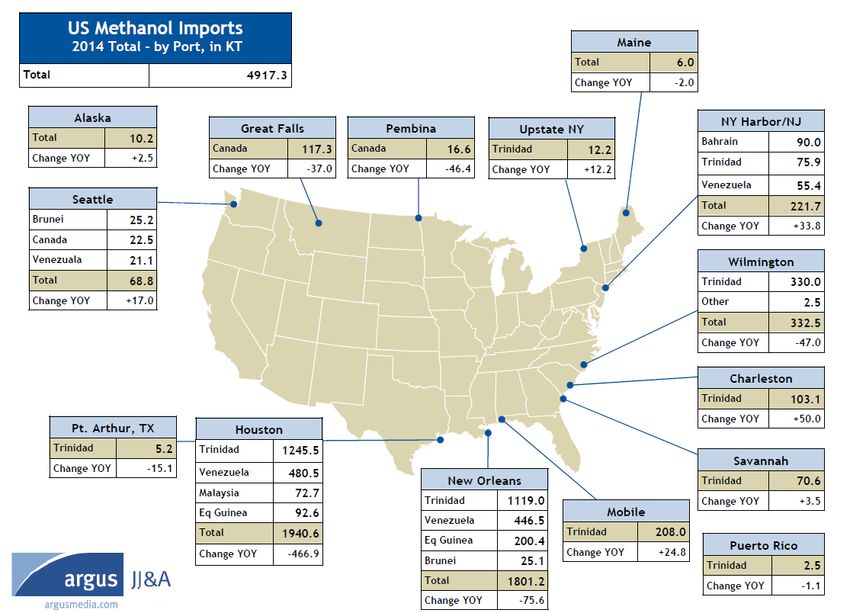
Partnership Overview
    Superior Site with Strong Customer Relationships
                            Selected Methanol Customers                                                                                   Methanol Customers
                                                                                                                                         Terms                        Delivery (2015)
                      Lucite      Methanex Exxon Mobil        Arkema                                                                                                           Truck
                                                                                                                       Contract Life:      2-5 Years / Renewable
                                                                                                                                                                                6%
Methanol Truck Terminal                                                                                                Pricing:            Jim Jordan Minus                          45% Barge
                                                                                                                                                                              49%
                                                                                                              Barges   Payment Terms: 25-30 Days                   Pipeline
                                            Methanol Pipelines
                                                                                                                       Key Customers:
 Natural Gas
  Pipelines

                                                                                                                                          Ammonia Customers
Houston Pipe Line
                                                                                                     Lucite                              Terms                        Delivery (2015)
                                                      Methanol Storage
                                                                                                                       Contract Life:      Monthly                            Truck
 Kinder Morgan                                                                    Ammonia Pipeline                                                                 Pipeline      6%
                                                                                                     DuPont
                                                                                                                       Pricing:            Tampa CFR Minus                    11%
                                                                                                                                                                                       83% Barge
                                                                                                                       Payment Terms: 30 Days
                                                                            Ammonia
DCP Midstream

                                         OCI Beaumont                                  Ammonia Storage                 Key Customers:
                                                                                                              Barges
 Florida Gas
 Transmission
                                                                                                                                              Gas Suppliers

                     Hydrogen Pipeline Nitrogen Pipeline
                                                                                                                                        Suppliers                      Delivery (LTM)
                                                                       Ammonia Truck Terminal
                                                                                                                                                                               Pipeline
                          Air Products          Air Liquide

                                                                                                                                                                                100%

                                                                                                                                                                                          7
Partnership Overview
Debottlenecking Project Drives Distribution Growth
                           Overview                                                            Processes
•   The Partnership delayed the planned debottlenecking to         •   Install a selective catalytic reduction unit
    January 2015 due to the holiday season to ensure all pre-      •   Install an additional flare
    turnaround construction activities are complete.
                                                                   •   Modify the convection section and heat exchangers
•   Construction completed in 1Q 2015.                             •   Increase the capacity of the synthesis gas compressor and
                                                                       the refrigeration compressor on the ammonia production
•   Total cost was US$ 384 million for project; US$ 97.5 million       unit
    for debottlenecking, US$ 124.4 million to improving
                                                                   •   Replace and refurbish equipment that caused downtime
    reliability and US$ 162.1 million for ensuring
    environmental compliance                                       •   Both methanol and ammonia production lines have been
                                                                       running at or above design capacity since April 23, 2015

                      Capacity Increase                                                        Benefits

             Previous Capacity        Current Capacity             •   Expands existing capacity
            Metric   Metric         Metric   Metric      %         •   Expected to maximize operational availability
Product
           Tons/Day Tons/Year      Tons/Day Tons/Year Increase
                                                                   •   Increases efficiency of plant
Methanol     2,000     730,000        2,500    912,500    25%      •   Increases margins; current headcount will be maintained
Ammonia       726      264,990        907      331,000    25%

                                                                                                                                   8
Partnership Overview
Financial Overview and 2Q 2016 Results Summary

                                                               Three Months Ended                                        Six Months Ended
                                                                       June 30                                                June 30
US$ thousand                                                      2016          2015                Change               2016          2015           Change
Revenues                                                            56,278        79,568            -29.3%               126,219       117,313          7.6%
Cost of Goods Sold                                                  39,758        44,514            -10.7%                 84,593       69,679         21.4%
Depreciation Expense                                                15,513        12,648             22.7%                 30,891       18,732         64.9%
Selling, General and Administrative Expenses                         6,442         4,912             31.1%                 12,901        9,972         29.4%
Income from Operations (before interest expense, other
                                                                     (5,435)            17,494      -131.1%               (2,166)          18,930     -111.4%
income (expense) and income tax expense)
Interest Expense                                                      9,973              1,785       458.7%               18,765            4,291 337.3%
Interest Expense - Related Party                                         51                  51       0.0%                    102             101   1.0%
Gain (loss) on disposition of fixed assets                              (26)            (1,982)      -98.7%                 (448)               5
Other Income                                                             (9)                 30     -130.0%                    13             121 -89.3%
Income (loss) from Operations (before tax expense)                  (15,494)            13,706      -213.0%              (21,468)          14,664 -246.4%
Income Tax Expense                                                      (47)                228     -120.6%                    33             293 -88.7%
Net Income (Loss)                                                   (15,447)            13,478      -214.6%              (21,501)          14,371 -249.6%

                                                                   30-Jun-16         31-Dec-15
Total Debt                                                          448,838           450,193        -0.3%
Net Debt                                                            440,278           436,955         0.8%

Sales Volumes
000 Metric Tons           H1 2016      Q2 2016       Q1 2016       H1 2015       Q2 2015       Q1 2015
Ammonia                    166.6         69.9          96.7          84.6          49.1         35.5
Methanol                   402.2        183.3         218.9         211.9         158.9         53.0

             *Net Debt is defined as Total Debt minus Cash and Cash Equivalents

             *Total Debt is the outstanding principal portion of our Term Loan B Credit facility and Revolving Credit Facility less the unamortized
             portion of the Deferred Financing Cost and Original Issue Discount associated with these facilities                                            9
Partnership Overview
OCI Partners LP Long-Term Strategy
• Maximize utilization rates of the debottlenecked plants
• Leverage sponsor’s technical know-how, expertise and track-record in identifying value-accretive projects
and new investment opportunities
• Evaluate potential downstream projects for both methanol and ammonia to diversify product portfolio
• Maximize and maintain distributions to OCIP unitholders of 100% of cash available for distribution
• Maintain strong customer relationships near Beaumont, TX
10Partnership Overview
Investment Highlights
Producer of essential, global
products: methanol and
ammonia
WA
MT ME
ND
Strong cash flow generation and VT
Supported byNH
a technically
OR MN
significant step-up in projected
ID strong sponsor,
MA
with an
SD WI NY
revenue and EBITDA from WY
exceptional entrepreneurial
CT
MI
debottlenecking project PA
track-record
NE IA NJ
NV IN OH
UT IL DC
CO WV
CA KS VA
MO KY
Key barriers to entry include
NC
high capital requirements,AZ TN
NM OK AR Global low-cost producer due to
lengthy permitting process and SC
U.S. natural gas advantage
proximity to customers / MS AL
GA
suppliers TX LA
FL
US methanol and ammonia
Advantageous access to
markets suffer from an import
feedstock, customers and
deficit, which is expected to
infrastructure
continue through at least 2018
11Industry Overview
Industry Overview
Robust and Growing Global Methanol Market

•         Methanol, also known as methyl alcohol or wood alcohol is the simplest of all alcohols

•         With its diversity of applications – from paints and plastics, furniture and carpeting, car parts and windshield wash fluid –
          methanol is one of the world’s most widely used industrial chemicals

          – Global demand in 2014 was roughly 72 million tons with 51% attributed to GDP-linked consumer and industrial products,
            while 37% is from fuel/energy related uses, and 12% is from methanol to olefins (“MTO”) / methanol to propylene
            (“MTP”)

          – Historical demand has been robust and is forecasted to remain so in the long term with China at the forefront

            2014 Global Methanol Demand by Derivative                                              China Leading Forecasted Industry Growth
                                                                                     mn t
                                All Other
     mn t/%                                                                                                                                   China
               Merchant          14%                             Formaldehyde         300
              MTO/MTP                                                27%
                5%                                                                                                                            N/E Asia
                                                                                      250
                                                                                                         CAGR = 6.2%
           Captive
          MTO/MTP                                                                                                                             S/E Asia/India
            7%                                                                        200

                                                                       Acetic Acid                                                            ME/Africa
                                                                         9%
             Dimethyl                                                                 150
              Ether
               9%                                                        Methyl                                                               EU/Russia
                                                                      Methacrylate    100
                         Fuel                                             1%
                                                                                                                                              South
                    Applications                        MTBE &
                                            Biodiesel                                  50                                                     America
                        12%                             TAME
    Blues = GDP-core - 51%                    5%         11%                                                                                  North
    Purples = Fuel/Energy - 37%
                                            Note: Total demand = 72 million             0
                                                                                                                                              America
    Grays = Methanol to olefins = 12%
                                                                                            2015       2020       2025      2030       2035
                ___________________________________
                Source: Argus JJ&A
                                                                                                                                                        13
Industry Overview
Chinese MTO Changing Global Methanol Demand
World Demand Growth (2000 - 2035E) (1)
mn t
300
250 CAGR = 6.2%
200
150
CAGR = 6.3%
100
50
0
2000 2005 2010 2015 2020 2025 2030 2035
Core - GDP Fuel MTO/MTP CTO/CTP (Coal to Olefins / Coal to Propylene)
• Excluding CTO/CTP, 2015 methanol demand is estimated to be 78 million tons
• China is the world’s largest producer of MTO and in 2015, MTO accounted for almost 18% of the country’s merchant
methanol demand
• MTO/MTP is poised to drive methanol demand, but affordability in current global crude oil environment remains key
___________________________________
(1) Source: Argus JJ&A
14Industry Overview
Exponential Growth Expected From Fuel Applications & MTO/MTP
• Chinese gasoline blending will continue to grow with its expanding population and automobile demand
‒ Europe currently allows blending of up to 3% methanol in gasoline. Countries such as Australia, Israel, Ecuador,
Mexico, Egypt, and Oman are actively exploring methanol as a blend component in gasoline.
‒ MTBE use has been growing constantly and has reached 20 mm t/yr, mostly from Asia which is not subject to
Fuel
ethanol blending programs
Applications
and Gasoline ‒ Many countries are also advancing the use of biodiesel, which requires blending approx. 10% methanol
Blending • Methanol’s attractive features as transportation fuel – easy blending, high octane, improved combustion– is
encouraging new potential demand uses
‒ Use of methanol as a marine fuel is a large potential new market. Stenna Line has converted one of its ferry’s to
methanol fuel and Methanex has on order six new dual-fueled methanol transport ships
World Methanol Demand Growth (Year over Year)
• Beginning in 2011, China redefined the methanol mn t
industry with its implementation of methanol
10
consumption for olefin production
9
‒ Historically, olefins were produced from naphtha,
8
but coal to methanol to olefins provided an
7
economic alternative
China’s 6
MTO/MTP • Chinese MTO/MTP will significantly increase 5
Expansion forecasted global methanol demand in the near term
4
‒ Argus expects China to add 3.75 mm t/yr of MTO 3
capacity from 2016 to 2019. By 2020, MTO use 2
will consume 67 mm t/yr of methanol. 1
‒ Because 1 ton of olefins requires 3 tons of 0
methanol, China’s capacity growth equates to 2016 2017 2018 2019 2020
over 10 mm t/yr of merchant methanol demand Core - GDP Fuel MTO/MTP
___________________________________
Source: Argus JJ&A
15Industry Overview
Attractive U.S. Methanol Market
• In 2015, the U.S. imported approximately 3.7 million metric tons of methanol to meet its supply deficit (57% of consumption)
• The U.S. sources a majority of its imports from Trinidad, which is currently facing a natural gas supply deficit
– Structural shortages in natural gas reserves have led to government rationing
• U.S. methanol demand is expected to increase at a CAGR of 6.3% between 2015 and 2020, driven by GDP
US Methanol Supply & Demand
’000t Exports Imports Production
20,000
15,000
10,000
5,000
0
-5,000
-10,000
2009 2013 2017 2021 2025
The majority of U.S. methanol demand is currently supplied by imports
___________________________________
Source: Argus JJ&A
16Industry Overview
China Cost Curve Setting Industry Floor
China Cost Curve
• Cost curve remains steep at the high
end with Chinese producers using
coal or expensive natural gas as
feedstock
• As the global marginal producer,
China’s cost curve sets a price floor
for methanol market
– In current lower energy price
environment, the price floor is
~$200/metric ton
• China’s natural gas-based cost
structure was reduced in Q4 2015;
however, the cost curve is not
expected to see significant change in
2016
___________________________________
Source: Argus JJ&A
17Industry Overview
Attractive U.S. Ammonia Markets
• In 2015, the U.S. imported 5.1 million metric tons of ammonia
– Represents 31% of total consumption
• Ammonia must be imported to the U.S. as approximately 20 ammonia plants were closed between 1999 and 2007, including
OCIP’s Beaumont facility
– These plants had total annual capacity of more than 8.0 million metric tons
• The U.S. is expected to remain a net importer for ammonia for the foreseeable future as the majority of new capacity announced
has already been cancelled
Three-Year Average U.S. Ammonia Use by End Market (1)
Direct
Application as Fertilizer
Fertilizer Feedstock
21.9%
50%
Industrial
Feedstock 28.1%
A significant portion of current and future U.S. ammonia demand is expected to be supplied by imports
___________________________________
Source: CRU (formerly Commodities Research Unit).
(1) Based on 2010-2012. 18Industry Overview
Ammonia Prices Remain Strong Along with Crop Prices
• Historically, there has been a meaningful correlation between nitrogen fertilizer prices and crop prices
– High crop prices incentivize farmers to increase fertilizer application in order to maximize crop yields, thereby increasing
fertilizer demand and resulting in higher ammonia prices
• Marginal producers in Eastern Europe (particularly the Ukraine), effectively set the price floor, with each region applying its
own premium based on a number of factors such as local supply/demand dynamics, transportation, logistics and government
policies
U.S. Fertilizer-Crop Price Relationship (1)
(US$ / St) (US$ / Bushel)
1,200 12
1,000 10
800 8
600 6
400 4
200 2
0 0
1996 1997 1998 1999 2000 2001 2002 2003 2004 2005 2006 2007 2008 2009 2010 2011 2012 2013 2014 2015 2016
Ammonia Mid Cornbelt Wheat Kansas City Cash Corn Chicago Cash
___________________________________
(1) Source: Bloomberg
19Industry Overview
Declining Trinidad Natural Gas Reserves: Supportive of OCI Partners LP Story
Natural Gas Production Reserve to Production Ratio
• Trinidad faces fundamental gas deficit issues as (TCf) (R/P Ratio)
increased natural gas production has not been matched 2 45
by new reserves, leading to a fall in reserve life to 8.8 1.5
36
Overview years in 2013 27
1
18
0.5
• Natural gas production fell in 2011 and 2012 as existing 9
reserves have been depleted 0 0
'00 '01 '02 '03 '04 '05 '06 '07 '08 '09 '10 '11 '12 '13
• Ammonia capacity utilization rates in Trinidad have been consistently declining since 2011 as gas supply
Impact on issues limited production
Nitrogen
Fertilizer • The nitrogen industry in Trinidad was established when there was a gas cost-based competitive advantage
Production over the U.S.; however, as U.S. gas costs have fallen, this advantage has eroded
• From 2013 to 2014, gas allocation to the production of ammonia dropped by 12%, and allocation to
methanol dropped by 1.2%.
Appropriation
of Natural Gas
• Fertilizer exports to the U.S. are expected to continue to fall, creating a more favorable environment for
domestic production
___________________________________
Source: CRU March 2013 Ammonia 10 Year Forecast, Trinidad Ministry of Energy, Wood Macknezie, Integer, EIA.
20Industry Overview
We Expect Our U.S. Natural Gas Advantage to Continue for the Foreseeable Future
• The emergence of a U.S. “shale gas advantage” has led to an increase in natural gas supply
• Production from shale formations increasing to ~50% of total annual natural gas production by 2040 as
Increased US compared with 34% in 2011
natural gas
production… • According to the Energy Information Association (the “EIA”) forecasts, increases in the supply of U.S. natural gas
are tracking to exceed increases in U.S. natural gas demand by 2019, leading to approximately 5.8 Tcf of net
exports by 2040
• This abundance of U.S. natural gas has resulted in attractive domestic natural gas prices, often substantially
below natural gas prices in other global markets, such as Europe, Japan and Northeast Asia
…has lead to • Having a low cost feedstock for the majority of our methanol and ammonia production gives us a significant
lower prices competitive advantage
• The EIA expects U.S. Henry Hub natural gas prices to remain low for the foreseeable future; natural gas forward
for 2015 is under US$ 3.00 MMBtu
Total U.S. Natural Gas Production and Consumption, 1990 – 2040 (1)
(Trillion Cubic Feet)
40
30
20
10
0
-10
2000 2005 2010 2015 2020 2025 2030 2035 2040
Production Consumption Net Imports
___________________________________
(1) Source: EIA, Annual Energy Outlook 2014.
21Sponsor Overview
Sponsor Overview
Overview of Our Sponsor – OCI N.V.

 •   OCI N.V. is a global natural gas-based fertilizer and industrial chemicals producers with
     production facilities in the Netherlands, USA, Egypt, and Algeria

 •   As of September 2015, the Sawiris family collectively owns 54% of the outstanding shares

 •   Currently employs approximately 3,000 people worldwide

 •   OCI N.V. is traded on the NYSE Euronext Amsterdam (OCI:NA)

       •   Approximately € 3.1 billion market capitalization as of September 2016

                                                                                                 23
Sponsor Overview
Overview of Our Sponsor – OCI N.V.
Leading global natural gas-based fertilizer & chemicals producer
‒ Production facilities in The Netherlands, USA, Egypt and Algeria complemented by global distribution network
‒ Top 5 five global nitrogen-based fertilizer producer - sellable capacity of c.7.7 mtpa at end-2014 with
competitive blended natural gas cost advantage over peers
Natural gas monetization focus following demerger of Construction business as of 9 March
2015
‒ Pure play fertilizer & chemicals company offering distinct investment propositions
Summary
Overview Growth initiatives 2014 - 2016
‒ 2015: additional volumes from Sorfert Algeria, debottlenecking OCI Beaumont and Iowa Fertilizer Co start-up
‒ On track to increase sellable capacity by 60% to c.12 mtpa by end-2016
‒ On June 12, 2015, OCI NV acquired BioMCN, a methanol and bio-methanol producer in the Netherlands with
two methanol plants, of which one is operational (440 ktpa) and one mothballed (430 ktpa)
Trading on Euronext Amsterdam since 25 January 2013 (NYSE Euronext: OCI)
‒ AEX Index constituent since March 2014
24Sponsor Overview
OCI Fertilizer Highlights
• With the addition of Iowa • OCI Fertilizer operates five production assets located in North
Fertilizer Company (IFCo), Africa (Egypt, Algeria), Europe (the Netherlands) and the U.S.,
total design saleable with production capacity of nearly 7.0 million mtpa of
capacity for nitrogen-based nitrogen‐based fertilizer
Egyptian
fertilizers will increase to Fertilizers Co.
8.7 million metric tons - This capacity is expected to increase to 8.6 mtpa in 2016 with
(10.4 million tons including the addition of IFCo and OCI Beaumont’s post-expansion
merchant ammonium capacity
sulphate) by 2016
• Fertilizers produced include ammonia, urea, calcium ammonium Egypt Basic
nitrate (CAN), urea ammonium nitrate (UAN) and other Industries Co
intermediary products; the business also sells ammonium
sulphate (AS) out of the Netherlands and Belgium
• OCIP also produces methanol at OCI Beaumont with a capacity OCI Nitrogen
of 0.75 mtpa expanding to 0.9 mtpa
• OCI Fertilizer’s downstream product portfolio includes:
- Melamine production Sorfert
- AS distribution
• North African facilities with attractive production costs
OCI Beaumont
• Global in-house distribution network with a presence in Europe
and strategic joint ventures in Brazil and the U.S.
Iowa
Fertilizer
25Appendix
Appendix
Board of Directors

                         OCI GP LLC                                       Background

                                                 Served as CEO and director of OCI N.V. and Orascom Construction
Nassef Sawiris               Director
                                                 Industries (“OCI SAE”) since its incorporation in 1998

                                                 Significant experience in the nitrogen industry, including serving as
Michael Bennett             Chairman
                                                 CEO of Terra Industries from 2001 to 2010

                                                 Served as vice president and general manager of OCIB from
Frank Bakker         Director, President & CEO
                                                 September 2011 to June 2013

                                                 Served as COO of OCI Fertilizer since January 2013 and has served
Renso Zwiers                 Director
                                                 as CEO of OCI Nitrogen since May 2010

                                                 Served as Executive VP of Terra Industries from 2007 until April
Francis Meyer                Director
                                                 2008 and as Senior VP and CFO from 1995 until 2007

                                                 Served as President of Sackett Partners Inc. since its formation in
Dod Fraser                   Director
                                                 2000 upon retiring from a 27-year career in Investment Banking

                                                 Served as corporate planning director and group controller of OCI
Fady Kiama             CFO & Vice President
                                                 SAE from 2001 until May 2013

Nathaniel Gregory            Director            Senior lecturer in finance at the MIT Sloan School of Management.

                                                                                                                       27
Appendix
Partnership Overview
Methanol Ammonia
• Methanol is a liquid petrochemical utilized in a variety • Ammonia constitutes the base feedstock for nearly all of
of industrial and energy-related applications the world‘s nitrogen chemical production
• The primary use of methanol is to make other • Over 95% of global ammonia output is used as a
chemicals feedstock to produce other chemical forms of nitrogen,
- ~30% of global methanol demand is converted such as:
to formaldehyde, which is used in various
industrial applications - Fertilizers
• Methanol is also used in the lumber industry, in paper - Blasting/mining compounds
and plastic products, and various other paint and textile
applications - Fibers and plastics
• Outside of the U.S., methanol is used as a fuel in
several capacities: - NOx emission reducing agents
- Direct fuel for automobile engines - Direct application to soil for agricultural purposes
- Gasoline blended fuel
• Ammonia is widely used in industrial applications,
- Octane booster in reformulated gasoline particularly in the Texas Gulf Coast market
Essential Building Blocks for Numerous End-Use Products
28Appendix
Product Process Overview
• Methanol production unit Methanol Process Flow
Natural Gas
Heat from Natural
is a 730,000 metric ton per Gas Combustion
year unit that is comprised Syngas
of Foster Wheeler- Natural Desulphurization Steam Reformer Heat Syngas Methanol Synthesis
designed twin steam Gas Reactor Unit Recovery Compression Reactors
methane reformers for
synthesis gas production, Steam
two Lurgi-designed parallel Steam is also used to
drive the compressors Cooling
low pressure, water-cooled
reactors and four
Recycle
distillation columns
Methanol
• Ammonia production unit Separation
is a 264,990 metric ton per
Ammonia Process Flow
year unit with a Haldor Liquid
Topsøe-designed ammonia H2
Purge Gas
Optional Syngas PSA Hydrogen Methanol
synthesis loop that H2N2 Compression Recovery Distillation
processes hydrogen Recycle Pure
produced by the methanol Methanol
production process as the NH3 Ammonia
feedstock to produce Synthesis
Cooling
Separation Methanol
Storage
ammonia
Liquid Pure
Ammonia
Barge /
Ammonia Pipeline
Storage
29Appendix
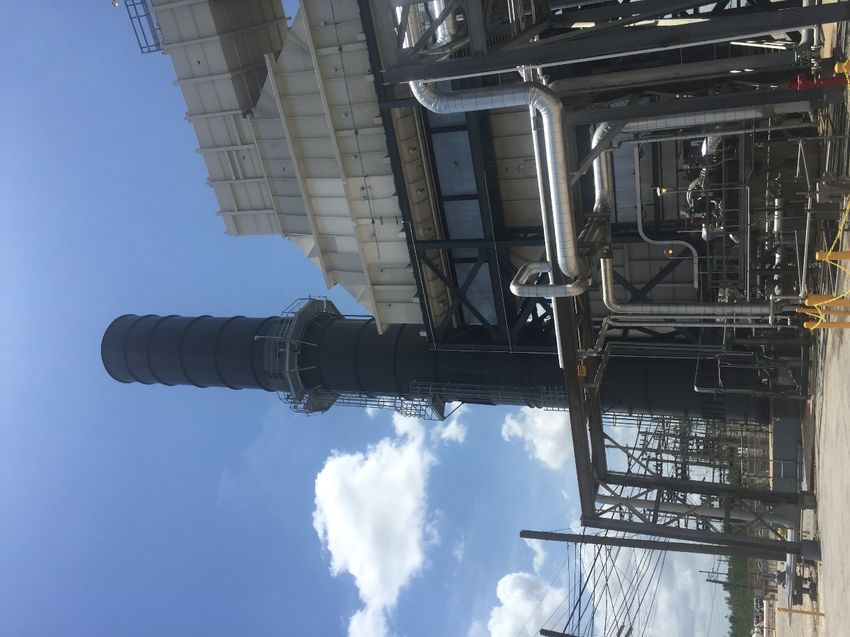
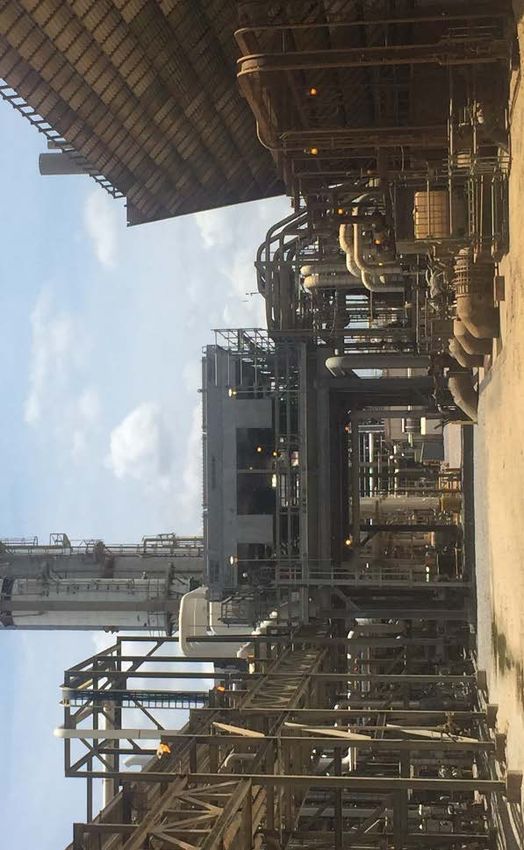
Site Facility Pictures
30Appendix
The U.S. Natural Gas Outlook
Low U.S. natural gas prices contribute to the competitive position of U.S. methanol and ammonia producers relative to foreign
producers
• Natural gas forwards project low Henry Hub Spot prices through 2028
– Below $4.00 per MMBtu until 2026
– Below $4.50 per MMBtu through 2028
Annual Average Henry Hub Spot Natural Gas Prices, 2001 – 2028 (1)
($/MMBtu)
$10.0
$8.0
$6.0
$4.0
$2.0
$0.0
2001 2004 2007 2010 2013 2016 2019 2022 2025 2028
Historical Henry Hub Spot Price Projected Henry Hub Spot Price
___________________________________
(1) Source: Bloomberg
31Appendix
OCIP Realized Methanol Pricing History
($/metric ton)
650
550
450
350
250
150
2012 2013 2014 2015 2016
Methanex Contract Southern Chemical Contract Argus Contract OCIP Realized Price
32Appendix
US Methanol Imports
___________________________________
(1) Source: Argus JJ&A
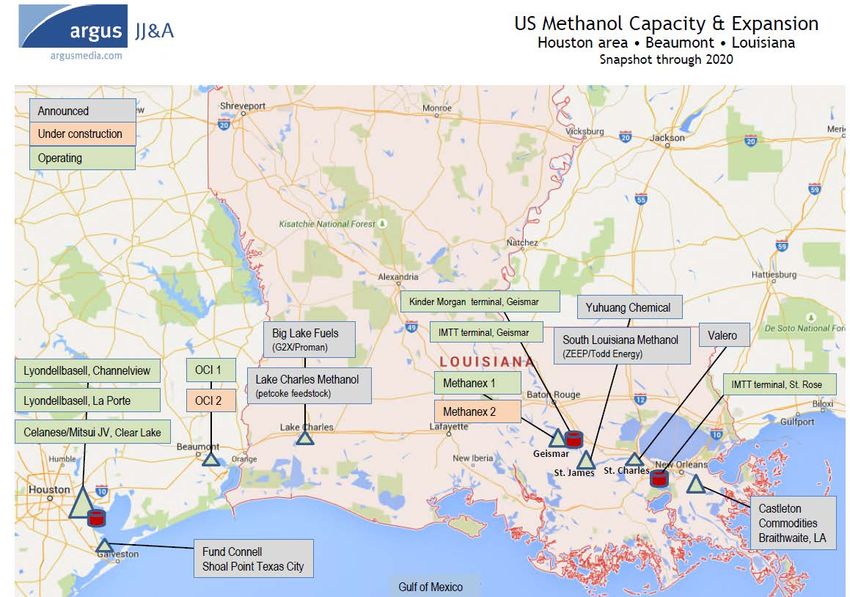
33Appendix
Gulf Methanol Capacity
___________________________________
(1) Source: Argus JJ&A
34Appendix
New Methanol Capacity
Production
Start Year Methanol Facility (1) Location Technology/EPC Status
Capacity (MTPA)
2015 Methanex – Geismar I Geismar, LA 1,000,000 Jacobs Engineering 1/24/15 Produced first methanol from Geismar 1
2015 Celanese – Fairway LLC Clear Lake, TX 1,300,000 WorleyParsons 10/16/15 Started production
ExxonMobil/Proman
2015 Pampa Fuels LLC Pampa, TX 65,000 6/1/15 Fully operational and completed first shipment of methanol
Group
2016 Methanex – Geismar II Geismar, LA 1,000,000 Jacobs Engineering 12/29/15 Successfully produced first methanol
2017 OCI – Natgasoline Beaumont, TX 1,650,000 Lurgi/OEC Construction began in November 2014
Lurgi/Amec Foster
2019 Yuhuang Chemical St. James Parish, LA 1,800,000 8/18/15 Yuhuang secures St. James site for methanol plant
Wheeler
Johnson
2019 G2X - Big Lake Fuels Lake Charles, LA 1,400,000 1/15/16 G2X hosted ground breaking ceremony for construction
Matthey/Proman Group
___________________________________
(1) Source: Argus JJ&A
35Appendix
New Ammonia Capacity
Production Sellable/Usable
Start Year Ammonia Facility (1) Location Technology/EPC Permitting Status
Capacity (STPA)* Capacity (STPA) (1)
8/16/14 Began construction in mid-September; project will be
2015 Koch Enid, OK +350,000 - KBR •
implemented over three years
2016 PotashCorp Lima, OH +110,000 - KBR • Expected start up in 2016
2016 OCI Wever, IA 850,000 100,000 KBR/OEC • On schedule to complete by 2016
Donaldsonville, ThyssenKrupp
2016 CF Industries 1,275,000 185,000 • Urea production began in November 2015
LA Uhde
ThyssenKrupp
2016 CF Industries Port Neal, IA 850,000 80,000 • On track for 2016 startup
Uhde
2016 Dyno-Cornerstone Waggaman, LA 850,000 850,000 KBR • 8/05/13 Cornerstone breaks ground on project
Leidos/SAIC (for
2016 LSB Industries El Dorado, AR 375,000 375,000 • Nitric acid plant expected start up in early 2016
Nitric Acid)
8/7/15 Urea project will be completed at end of 2016; cancelled
2016 Agrium Borger, TX +160,000 - KBR •
ammonia expansion
2017 Dakota Gasification Beulah, ND - - IHI E&C • 1/28/14 Urea plant scheduled for completion in early 2017
- Koch (Invista) Victoria, TX 400,000 400,000 1/31/14 Invista has put project on hold
5/02/15 Announces product list of UAN, urea, DEF, AN, ATS, and
- Northern Plains Grand Forks, ND 850,000 100,000
anhydrous ammonia; no construction progress to date
Ohio Valley 12/19/13 Signed MOU with TEQSA for development, and selected
- Rockport, IN 850,000 350,000 KBR/SEI •
Resources Sinopec (SEI) for FEED & EPC; no construction progress to date
6/24/14 Signed MOU with Maire Tecnimont; no construction
- MFC (Fatima) IN 850,000 50,000 •
progress to date
9/05/14 CHS approved final plans for construction of fertilizer plant;
- CHS Spiritwood, ND 850,000 - •
no construction progress to date
* Production capacity with “+” indicates additional capacity expansion on existing facility
___________________________________
(1) Source: Blue Johnson (2014).
36Appendix
Methanol and Ammonia Plant Closures
Year of Production Year of Production
Methanol Facility Location Ammonia Facility Location
Closure Capacity (MTPA) Closure Capacity (MTPA)
1998 Georgia Gulf Plaquemine, LA 480,000 1999 Potash Corp. Clinton, IA 281,000
1999 Methanex Fortier, LA 570,000 1999 Potash Corp. La Platte, NE 231,000
1999 Ashland Plaquemine, LA 450,000 1999 Solutia Lulling, LA 551,000
2000 Sterling Texas City, TX 450,000 2000 Borden Chemicals & Plastics Geismar, LA 468,000
2000 Borden Chemicals & Plastics Geismar, LA 990,000 2000 Diamond Shamrock Dumas, TX 83,000
2001 Delaware City Delaware City, DE 200,000 2001 Agrium Kennewick, WA 237,000
2001 Enron Pasadena, TX 375,000 2001 Cytec Fortier, LA 485,000
2003 Air Products Pace, FL 120,000 2001 DuPont Beaumont, TX 540,000
2003 El Paso Cheyenne, WY 180,000 2001 Farmland Lawrence, KS 518,000
2004 Lyondell Channelview, TX 770,000 2001 Vanguard Pollock, LA 568,000
2004 Celanese Clear Lake, TX 600,000 2003 Koch Sterlington, LA 1,213,000
2005 Beaumont Methanol * Beaumont, TX 730,000 2003 Simplot Pocatello, ID 116,000
2005 Celanese Bishop, TX 500,000 2003 Terra Yazoo City, MS 193,000
2004 Air Products Pace, FL 110,000
2004 Potash Corp. Memphis, TN 452,000
2004 Terra Blytheville, AR 496,000
2005 Agrium Kenai, AK 694,000
2005 Diamond Shamrock Dumas, TX 88,000
2005 Terra* Beaumont, TX 264,990
2007 Agrium Kenai, AK 777,000
___________________________________
* Represents current OCI Beaumont facility.
37You can also read