A clean COVID-19 recovery: UK - May 2021 Prepared by EY-Parthenon, funded by the European Climate Foundation
←
→
Page content transcription
If your browser does not render page correctly, please read the page content below
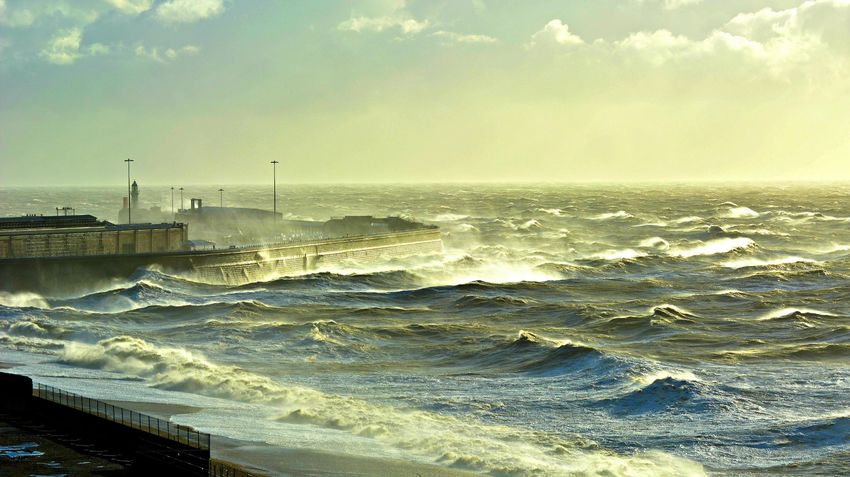
EMBARGOED UNTIL JULY 7th

A clean COVID-19
recovery: UK
668 projects for a green COVID-19 recovery and
resilience plan for the UK

May 2021

Prepared by EY-Parthenon,
funded by the European Climate Foundation

EMBARGOED UNTIL JULY 7th

    Agenda
► Executive summary
► Scale of the opportunity

► The UK’s renewables journey so far

► Key policy recommendations

► Appendix

                                                                  Page 2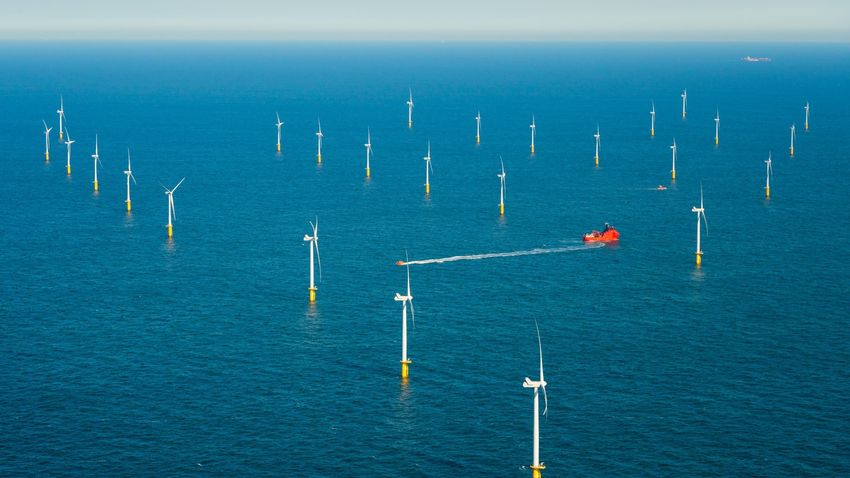
EMBARGOED UNTIL JULY 7th
Executive summary
A green recovery focused on renewable energy can kick-start economic growth,
reverse ca. 90% of job losses from the pandemic, and enable a step-change on climate
1
The UK has gained momentum towards decarbonisation, becoming a global leader in offshore wind
generation – but more work remains to be done to achieve its ambitious net zero and energy transition
targets
Contracts for difference (CfDs) have been the key policy enabler behind rapid deployment of renewables
capacity – the UK had 10.5GW of offshore wind in operation at the end of 2020, the highest of any country
globally.
2
A post-COVID-19 green economic recovery presents a significant opportunity to make further headway in We have identified a 43GW
realising the UK’s renewable energy potential and draw in billions of pounds in private capital to multiply pipeline of 668 ‘shovel ready’
the effect of economic stimulus spending. The UK has already made headway as an early mover on green
recovery, but more can be done
projects that will enable the
The UK has a $150bn+ pipeline of investible renewable energy projects, large enough to play a key role in
UK to meet its climate
a broader post-COVID-19 economic recovery and have a transformational impact on the UK energy sector. ambitions, create jobs and
Investment in renewable capacity deployment will be private-led, with only limited government expenditure drive economic growth
required to draw in large private capital investment. Previous CfD auction rounds have seen ca. £100 of through a green recovery
private investment for every £1 of government spending.
3
Targeting economic renewal through green energy offers enormous potential for sustained job creation
and economic growth, especially in Northern England and Scotland
The current project pipeline alone has the potential to create 625,000 jobs, mitigating 90% of job losses
from the COVID-19 pandemic.
Furthermore, the renewable energy investments enabled by the visible pipeline is a major opportunity to
advance regional development objectives as part of the ‘levelling up’ agenda.
Source: EY-Parthenon analysis. Page 3
EMBARGOED UNTIL JULY 7th
Executive summary
The visible project pipeline is large enough to contribute significantly to the UK’s
renewable energy and climate agenda, as well as economic growth
The visible pipeline of projects has the potential to unlock positive environmental value and contribute
significantly to the UK’s renewable energy and climate targets
668 projects in the pipeline
The deployment of the identified projects will contribute positively to progress towards the achievement
of the UK’s carbon budgets and net zero target by 2050.
82 metric tons of carbon dioxide The project pipeline is estimated to contribute a reduction in CO2 emissions of 82 MtCO2e per year
equivalent (MtCO2e) avoided reduction in CO2 emissions – this represents a 23% reduction in total UK emissions and contributes 34%
of the UK’s 2030 Nationally Determined Contributions (NDC) emissions reduction target.
Additional benefits include improved air quality and health outcomes, as well as improved gender
US $190bn of private-led equality – a 2019 International Renewable Energy Agency (IRENA) report found that representation of
investment women is 10% better in the renewables sector compared with traditional energy industries.
The projects identified represent US$190 billion opportunity for private-led investment, and have the
43GW of renewable generation potential to support an estimated 625,000 jobs
capacity Thelow-carbon projects identified may make a major contribution to a green economic recovery in the
UK, and job creation would cover the full extent of the job losses attributed to the COVID-19 pandemic in
the UK.
Up to 625,000 jobs created The625,000 potential jobs exceed the number of jobs in the UK oil and gas sector, which is estimated to
employ 269,000 people. The number of jobs created depends in large part on the UK’s ability to
strengthen its renewable energy supply chain: in particular, manufacturing for offshore wind.
US$5bn recurring Gross Roughly 80% of jobs require low-to-medium education, in vocational rather than academic skills.
Domestic Product (GDP) impact
Jobcreation has the potential to support regional levelling up in coastal towns and industrial clusters
such as the Humber and East Anglia.
Source: EY-Parthenon analysis. Page 4
EMBARGOED UNTIL JULY 7th
Executive summary
The UK has several policy levers that can be pulled to unlock the potential in the visible
renewable energy pipeline and accelerate broader renewables investment

          Set new, bold targets for capacity expansion that are specific to onshore wind and solar photovoltaic (PV), alongside the 40GW
 1        target for offshore wind (as the UK increases electrification across sectors such as transport and heating, this is a ‘no regrets’
          policy decision, which will enable the UK to meet its energy needs)

          Extend CfDs more ambitiously across onshore wind, solar PV and offshore wind, with price floors in place to secure developer and
 2
          investor confidence

          Expand and upgrade the grid network through infrastructure projects that are transformative in nature, such as the North Sea
 3
          offshore grid, and that have the potential to support and accelerate new renewables capacity deployment

          Actively use green investments as a means to strategically strengthen and build new industry clusters and level up UK regions,
 4
          with a particular focus on offshore wind

          Set the EU Emissions Trading System (ETS) cap in line with the Climate Change Committee (CCC) recommendation of 39 MtCO2e
 5        for the power sector in 2023, falling to 14 MtCO2e by 2030 (this will ensure the carbon price continues to help drive zero emission
          power investments)

          Pursue an ambitious ‘sector deal’ for hydrogen supported by both government and private investment, with an explicit ambition to
 6        make the UK a global leader in the development, production and use of this technology as a means to unlock the broader potential
          of a green economy

Source: EY-Parthenon analysis.                                                                                              Page 5
EMBARGOED UNTIL JULY 7th
Executive summary
This report is focused on shovel-ready renewable energy projects within the UK, and
the key enablers and policy recommendations that will help fulfil the pipeline
The objective of this report is to support the development of green recovery plans by
providing an overview of shovel-ready investment opportunities
EYteams have identified projects that can support jobs in the short term and Generation Storage
contribute to the UK’s renewable energy and climate objectives. Projects were Renewable
researched within four subsectors of renewable energy (generation, storage, energy
transmission and distribution), primarily using secondary research (e.g., databases), subsectors
and supplemented by interviews with local stakeholders (including project developers, Distribution Transmission
investors, public organisations and academics).
The668 shovel-ready opportunities all have the potential to create environmental,
economic and social value in the coming years. These opportunities are real, requiring
Findings within this paper feed into a wider
some stimulus in order to be realised (which could be additional financing or
international report focused on the green recovery
overcoming other barriers).
opportunity within 46 countries across six continents
The projects identified represent a subset of the green projects under development
in the UK
Thislist of projects uncovered has been collated over a short timeframe. It illustrates
an initial view of the size of the project pipeline that exists within the UK to underpin a
green and resilient recovery from the COVID-19 economic crisis.
Thelist can only be seen as a subset of all projects with climate benefits under
development in the UK at various levels of maturity, as we have primarily focused on
short-term opportunities, i.e., projects that will reach financial close in the next 24
months.
Furthermore, we have also only focused on renewable energy rather than other forms
of green projects such as electric vehicles or energy efficiency solutions.
Page 6
EMBARGOED UNTIL JULY 7th

Investment in renewable energy is a key
opportunity for future-proof local job
creation and regional revitalisation

                                                     Page 7
EMBARGOED UNTIL JULY 7th

    Agenda
► Executive summary
► Scale of the opportunity

► The UK’s renewables journey so far

► Key policy recommendations

► Appendix

                                                                  Page 8
EMBARGOED UNTIL JULY 7th
Scale of the opportunity
The visible pipeline of renewable energy projects in the UK contains 668 projects

                                              Country overview                                                          Breakdown of 668 projects identified by subsector

 GDP                                            US$2,722bn                  Other Hydro/marine
                                                                                                            Total capacity (MW)
                                                                                 6%          Solar
 Population                                           67mn                         2% 12%                  25,000
                                                                                                                                               22,954
 GDP per capita                                  US$40,642                       113GW
                                                                                installed   21%
 Electricity                                                                    capacity                   20,000
                                                                                                  Wind
 consumption per                                    4.8MWh                58%
 capita                                                                                                    15,000
 Emissions per capita                              5.1 t CO2         Non-renewable                                                 11,602
                                                                                                           10,000
                                      Net zero             by 2050
                                                                                                             5,000     4,501
    Key                                                    offshore wind capacity by                                                                      2,710
                                        40GW
  targets                                                  2030                                                                                                       N/A      N/A
                                                                                                                 0
                                                                                                                       Solar      Onshore      Offshore   Hydro    Storage Transmission
                                                           low-carbon hydrogen                                                     wind          wind                             &
                                         5GW                                                                                                                                Distribution
                                                           production capacity by 2030                                            Generation

                                                                                                            No.
                                                                                                                        294         213          23        10         62        66
                                                                                                          Projects

Source: IRENA, IEA, Oxford Economics, EY-Parthenon analysis.                                                                                                      Page 9
EMBARGOED UNTIL JULY 7th
Scale of the opportunity
A potential US$190bn of investment is required to fulfil the project pipeline identified,
spanning several regions of the UK

                    Breakdown of 668 projects by size of investment                               Breakdown of 668 projects by geography (units, projects)

          Investment requirement (US$bn)                                                 Note: additional 48 generation and
                                                                                         storage projects and 66 T&D
          150                                                                            projects are unspecified on map

                                                                                                                                      211      Scotland
                                             111

          100

                                                                                                                                                         19        North Sea

            50                                                                                                                                          11    North East England
                                                                           32               Northern Ireland        36
                                   22
                                                                                                                                                             14         Yorkshire & the Humber
                         10                            11                                                                      North West
                                                                5                                                                                  25
                                                                                                                                England
              0                                                                         Irish Sea, Celtic Sea and
                       Solar     Onshore   Offshore   Hydro   Storage      T&D                                           5                                        49         East Midlands
                                                                                          North Atlantic Ocean
                                  wind       wind                                                                   West Midlands             15
                                                                                                                                                                            41   East of England
                                    Generation
                                                                                                                             Wales   49
                                                                                                                                                                        1        London
  No.
                     294          213            23      10         62           66
Projects                                                                                                                                                     35        South East England
                                                                                                  South West England           41
   Avg.                                                                                                                                        English
                 US$3.5mn US$10.3mn US$491mn US$105mn US$86mn US$466mn                                                                    1
                                                                                                                                               Channel
   size

Source: EY-Parthenon analysis.                                                                                                                                         Page 10
EMBARGOED UNTIL JULY 7th
Scale of the opportunity
Private organisations are the primary driver behind the size of the project pipeline,
with the majority in the permitting stage
Breakdown of the developer type for 540 generation projects (%) Breakdown of the maturity level for 540 generation projects (%)
Public organisations / government Small and medium enterprises Launched / feasibility Other
2% 5%EMBARGOED UNTIL JULY 7th
Scale of the opportunity
A green post-COVID-19 economic recovery can have a massive positive impact on UK
jobs, emissions and economic growth
Potential impact from visible pipeline of renewable energy projects
People 625k Potential jobs created
Current emissions
Planet 82 MtCO2e avoided per 22% abated
annum
US$ US$
Prosperity Investment Annual GDP impact
1.90bn 5bn
Note: an additional 570,000 manufacturing jobs could be created in-country with a localised supply chain.
Source: EY-Parthenon analysis. Page 12EMBARGOED UNTIL JULY 7th
People
Up to 625,000 jobs created
Page 13EMBARGOED UNTIL JULY 7th
Scale of the opportunity People
The visible pipeline can create up to 625,000 jobs; realising the full Planet
potential depends on further strengthening local supply chains Prosperity
Job creation potential from visible pipeline Job creation potential from visible pipeline
vs. 2020 COVID-19 job losses vs. current employment in oil and gas
Jobs (000s) Jobs (000s)
750 750
700k 2.3X
625k 625k
500 500
Jobs in Jobs in
364k supply 364k supply
chain chain
269k
250 250
261k Local jobs 261k Local jobs
0 0
Job losses due to COVID-19 Potential jobs created Oil and Gas Potential jobs created
by projects in pipeline employment1 by projects in pipeline
1. Total employment supported by the offshore oil and gas industry.
Source: Oil & Gas UK, Office for National Statistics (ONS). Page 14EMBARGOED UNTIL JULY 7th
Scale of the opportunity People
The Humber offshore wind cluster shows how investment in Planet
renewables can be used to create jobs and level up targeted regions Prosperity
Case study: Humber Offshore Wind Cluster, UK
The Humber has been established Hull City Council1 reported that private
as a cluster for offshore wind in the investment into the city, including £310m
UK, with the objective of by Siemens Gamesa and ABP, has led to:
revitalising the region after a
period of economic decline, driven
improvement in local gross value
by loss of jobs in traditional 10% added (GVA)
industries.
The region is now home to six
The
Humber operational offshore windfarms
(including Hornsea One, the world’s 13% improvement in local employment
largest offshore windfarm) and is
set to become one of the key
drivers of the UK Government’s
commitment to 40GW offshore reduction in local unemployment
60% benefit claimants
energy capacity by 2030.
The Port of Hull is an integral part
of the region’s infrastructure and
has been a key supporting part of 30% growth in local enterprises
the economic recovery.
1. Hull is a large city located in Yorkshire & the Humber.
Source: Hull City Council, RenewableUK, EY-Parthenon analysis. Page 15EMBARGOED UNTIL JULY 7th
Planet
22% reduction in total
emissions
Page 16EMBARGOED UNTIL JULY 7th
Scale of the opportunity People
The visible project pipeline would allow the UK to continue shifting its Planet
energy mix towards renewables Prosperity
Potential emissions abatement from projects in pipeline
UK installed capacity, by technology (%, GW) vs. current total emissions (MtCO2e)
370
5% 100%
Other 7%
5% 5% -22%
Hydro 82
14% 14%
Solar
Wind 25% 61%
42% renewable
energy
Nuclear 9%
6%
Fossil fuel 40%
28%
Installed capacity Installed capacity Current emissions Potential abatement
(2020) (shovel ready from projects in pipeline
pipeline deployed)
The pipeline of shovel-ready projects could help increase the scale of wind, Deploying the visible renewable energy pipeline alone will enable up to a
solar and hydro capacity to 61% of the installed capacity. Bold government 22% reduction in the UK’s total emissions.
targets in offshore wind suggest a wind segment that comprises over 50% of
installed capacity by 2030.
Source: BMI, United Nations Framework Convention on Climate Change (UNFCCC), International Energy Agency (IEA), EY-Parthenon analysis. Page 17EMBARGOED UNTIL JULY 7th
Prosperity
$190bn of investment
opportunities
Page 18EMBARGOED UNTIL JULY 7th
Scale of the opportunity People
Beyond emissions mitigation, the visible renewable energy pipeline Planet
can generate a substantial positive impact on economic growth Prosperity
UK installed capacity, by technology (%, GW)
GDP within the UK declined by 10% in 2020, largely due to
US$311bn the economic impact of COVID-19.
The pipeline of shovel-ready projects in the UK could provide
an injection of US$156bn into the economy, which is
equivalent to half the GDP lost.
US$190bn
By deploying the pipeline, we estimate a permanent recurring
GDP contribution of £5bn per year through operations and
maintenance of assets. This represents a one-off 0.2 p.p.
additional increase in GDP – ca. 12% increase in the rate of
growth, assuming a continuation of 1.7% average GDP
growth from 2010 to 2019.
Net GDP loss Total investment
due to COVID-19 opportunity in
pipeline
% GDP (2020)1 5.6%
1. Oxford Economics GDP forecast 2020, fixed exchange rate and prices.
Source: Oxford Economics, EY-Parthenon analysis. Page 19EMBARGOED UNTIL JULY 7th
Scale of the opportunity
Some projects identified are of a scale that can have a potentially transformational
impact on the renewable energy sector in the UK and neighbouring countries
The two projects detailed below can have a transformative impact on the renewable energy sector in the UK, creating significant
transmission capacity and adding resilience to the national grid. They have the potential to further accelerate renewable energy
investment in the UK.
North Sea electricity super-highway Greenlink Interconnector
Name: Eastern Link project Name: Greenlink Interconnector
Location: Between Scotland and Location: Between Wales and the
North East England Republic of Ireland
Developer: SSE, ScottishPower Developer: Hudson Clean Energy
and National Grid Partners
The Eastern Link project includes the development of The Greenlink Interconnector involves the construction of a
underwater subsea high-voltage, direct current (HVDC) HVDC underwater subsea transmission link between the
cables between Scotland and North-East England. Republic of Ireland and Wales.
The project includes two 2GW cables that will provide enough The 200km interconnector will consist of 170km of
electricity transmission capacity to power around 4.5mn submarine cabling and 30km of cable on land linking
homes across the UK. substations of EirGrid with National Grid.
The project is expected to significantly increase the UK’s The 320kV bi-directional transmission link will be capable of
renewable energy transmission capacity, supporting further transmitting 500MW of electricity, enough to power 380,000
offshore wind development in the North Sea. homes.
Source: Secondary research, EY-Parthenon analysis. Page 20EMBARGOED UNTIL JULY 7th
Scale of the opportunity
Several hydrogen projects are already in their development stage, which could create
momentum for an established hydrogen economy in the UK
Gigastack hydrogen project Dolphyn hydrogen project
Name: Gigastack Name: Dolphyn project
Location: North Lincolnshire Location: Kincardine site
Capacity: 5MW Capacity: 2MW
Developer: Element Energy, Developer:Nel ASA and Doosan
Ørsted, Phillips 66 and ITM Power Corporation
Gigastack is a demonstration project in the UK for industrial- Dolphyn is a wind-to-hydrogen project and includes
scale, low-cost renewable hydrogen production through the deployment of a 2MW prototype system at the Kincardine
electrolysis process. floating offshore wind farm.
It received financial assistance from the BEIS Energy The project is backed by the UK Government and led by
Innovation Programme as well as aid from the UK consultancy firm ERM. It aims to desalinate seawater and use
Government during phase 1. it to produce hydrogen via electrolysis.
The project includes deployment of a 2MW electrolyser The project will demonstrate and test the potential to
system and plans further development of a 100MW system at produce green hydrogen offshore independently of the power
Humber refinery during phase 2. system and export gas rather than electricity. A 10MW facility
The demonstration will help identify the regulatory, technical is planned to follow by 2027.
and commercial challenges involved in the industrial-scale
application of renewable hydrogen systems.
Source: EY-Parthenon analysis. Page 21EMBARGOED UNTIL JULY 7th
Agenda
► Executive summary
► Scale of the opportunity
► The UK’s renewables journey so far
► Key policy recommendations
► Appendix
Page 22EMBARGOED UNTIL JULY 7th
The UK’s renewables journey so far
The UK’s energy transition has uncovered several policy learnings that could support a
global acceleration in energy transition
UK electricity generation, 1970 - 2019 (TWh)
216 284 333 282 259
100% 2% 2% 4% Renewables
11% 15% Nuclear
21% 17% 25%
Gas The UK has been successful in phasing out coal from
Thermal its energy mix through purposeful policy action.
75% 23%
Ember Climate’s ‘coal to clean’ energy policy advises
20%
32% that the UK is on track to completely phase out coal
by 2025, without having to build new large gas
50%
31% plants.
87%
77% UK success in rapidly deploying and growing
46%
renewable generation has been driven by policy
25% 47% success around CfDs and a sector deal with the
31% offshore wind industry.
10%
0%
1970 1990 2010 2015 2019
Source: BEIS, Ember Climate, EY-Parthenon analysis. Page 23EMBARGOED UNTIL JULY 7th
The UK’s renewables journey so far
The UK has been able to unlock mass deployment of private sector capital towards
renewables, with public sector spend at only a fraction of total investment
CfDs
US$50 Private-led investment since
2015 in projects awarded a CfD
bn
Sector deals
Estimated government budget
$0.5bn for CfD rounds one to three Investment in grid
infrastructure
US$50bn of investment in the renewables
sector since 2015 has been enabled through Regulatory sandboxes
inexpensive UK government policy.
Source: BEIS, EY-Parthenon analysis. Page 24EMBARGOED UNTIL JULY 7th
“
99% of investment in CFD-backed projects
since 2015 has come from the private sector
Page 25EMBARGOED UNTIL JULY 7th
The UK’s renewables journey so far CfDs
The CfD auction framework has been a critical policy driver behind Sector deals
Grid infrastructure
the UK’s offshore wind build-out Regulatory sandboxes
Overview Notable impact
The CfD scheme is the UK Government’s flagship mechanism for East Anglia 1 A 714MW offshore wind farm was developed by
supporting low-carbon electricity generation. (EA1) ScottishPower Renewables
Thescheme was launched in 2014 – three allocation rounds have been EA1 was the largest project to receive a CfD in the
completed to date, with the fourth planned for late 2021. £2.5bn first auction round
The purpose of CfDs is to incentivise investments in new low-carbon private The project was commissioned and began receiving
electricity generation in the UK by providing stability and predictability to investment CfD support in 2020
future revenue streams.
The Government has been able to provide more long-term visibility than
any other market globally through its commitment to holding CfD
auctions every two years and a £557mn budget to support the auctions.
Policy description International examples
CfD is a long-term contract between an electricity generator and the In2019, the Polish Government approved a new draft amendment to its
Low Carbon Contracts Company (LCCC). The contract enables the renewable energy source (RES) Act that will allow the development of
generator to stabilise its revenues at a pre-agreed level (the strike onshore wind farms or PVs under new CfD rules.
price) for the duration of the contract. In2020, Italy awarded a 20-year CfD contract to EDP Renewables for
Ifthe wholesale power price drops below the strike price, payments wind power plants via auction.
are made by the LCCC to the electricity producer to make up the
difference. If the wholesale price is above the strike price, the CfD
generator pays the difference back to the LCCC.
Source: BEIS, EY-Parthenon analysis. Page 26EMBARGOED UNTIL JULY 7th
The UK’s renewables journey so far CfDs
The sector deal has enabled rapid growth in offshore wind by enabling Sector deals
Grid infrastructure
long-term planning and collaboration across all stakeholders Regulatory sandboxes
Overview Notable impact
Launched in 2019, the Offshore Wind Sector Deal is a partnership InSeptember 2019, the Crown Estate launched a new seabed leasing
between the UK Government and the offshore wind industry. round that will provide opportunity for at least 7GW of new projects in
English and Welsh waters.
The government engaged with the private sector (e.g. developers),
industry bodies, educational institutions and several other key OWGP launched a £2mn fund in 2020 to support ten supply chain
stakeholders in the offshore wind industry to formalise a government companies over 12 months.
commitment to supporting the industry. Since the publication of the sector deal, the 2019 CfD auction achieved
Thedeal aims to tackle climate change whilst boosting productivity, record low prices – 65% lower than the 2015 auction.
employment, innovation and skills in the UK.
Thedeal is built on the foundations of the Industrial Strategy: Ideas,
people, infrastructure, business environment and places.
Policy description International examples
Crown Estate and Crown Estate Scotland has committed to undertake In 2020, Polish government representatives, investors and stakeholders
new seabed leasing to ensure a sustainable pipeline of new projects from the offshore wind supply chain signed a letter of intent to develop an
for the late 2020s and early 2030s. offshore wind sector deal.
The Offshore Industry Council Wind Investment in Talent Group has
been established to identify skills needs across the sector, and
develop curricula and accreditation to deepen the skills base.
The Offshore Wind Growth Partnership (OWGP) was established, with
sector commitment to contribute up to £250mn.
Source: BEIS, EY-Parthenon analysis. Page 27EMBARGOED UNTIL JULY 7th
The UK’s renewables journey so far CfDs
Sustained grid infrastructure investment has been critical to build-out Sector deals
Grid infrastructure
of renewables, enabling multidirectional flow and new supply centres Regulatory sandboxes
Overview Notable projects
The UK’s grid operators have proactively invested in upgrading the Exeteris a 400kV double busbar substation in South
country’s transmission network, as the development of large-scale West England.
renewables in coastal areas has created new supply centres. Itforms part of the National Grid’s investment into
TheNational Grid operates 7,200km of overhead lines, 1,580km of smart grid development.
underground lines and 346 substations.
Ithas helped provide resilience to South West’s
Robust transmission infrastructure is crucial for supporting the growth transmission network, which has a large amount of
of a renewables electricity sector, which relies on a multidirectional grid. onshore wind generation.
Thishas been a key enabler for renewables investments in the UK, whilst
supporting cost reduction for renewables over time.
National Grid capital investment, electricity transmission (£m) International examples
In2020, the German Government confirmed the development of the
£1,084mn SuedOstLink, a 500km 525kV underground cable.
£1,027mn £999mn £1,043mn
£925mn The transmission cable connects the north of Germany, which contains
high wind resource, to the south and west where Germany’s large
industrial operations are located.
2016 2017 2018 2019 2020
Source: National Grid, Statista, EY-Parthenon analysis. Page 28EMBARGOED UNTIL JULY 7th
The UK’s renewables journey so far CfDs
Regulatory sandboxes help drive innovation by enabling small-scale Sector deals
Grid infrastructure
policy and business model experimentation Regulatory sandboxes
Overview Notable impact
The UK’s energy markets regulator, Ofgem, has run several rounds of its A consortium led by EDF was granted a regulatory
energy regulation sandbox service, which was launched in 2017. sandbox to trial a peer-to-peer local energy trading
platform that allows residents in urban areas to
Regulatory sandboxes provide a safe space for innovators to test new
source their energy from local renewables and trade
ideas and business models that may be only partially compatible with
the existing legal and regulatory environment, with reduced uncertainty with their neighbours.
and risk. EDF was successful in piloting the technology in 2019.
The sandboxes have proved successful in driving entrepreneurship and
innovation in renewable energy.
Ofgem attracted over 50 applications for its sandbox trials, and
supported smaller players as well as larger incumbents such as BP and EDF.
Policy description International examples
Innovators benefit from guidance and support from energy market Regulatory sandboxes are a relatively new policy innovation for energy
regulators and industry bodies, as well as relaxation of rules around markets; aside from the UK, they have also been adopted by several
licencing, zoning, energy law, tariffs, etc. governments globally, including in Singapore, Austria and Germany.
Sandboxes allow regulators to learn about new ideas and the There is a high potential for replication, as regulatory sandboxes do not
challenges faced by innovators, in order to develop an often involve providing grant funding to participating entrepreneurs.
accommodating regulatory environment.
The UK’s renewables journey so far Page 29EMBARGOED UNTIL JULY 7th
Agenda
► Executive summary
► Scale of the opportunity
► The UK’s renewables journey so far
► Key policy recommendations
► Appendix
Page 30EMBARGOED UNTIL JULY 7th
Key policy recommendations
The bottlenecks for further investment in the UK are permitting, the scale and scope of
the CfDs and inadequate transmission infrastructure
National ambition and targets Availability of domestic capital
Strong will in government to achieve net neutrality has Deep domestic capital markets create relative ease of
been met by ambitious targets and detailed road maps for access to capital for developers.
energy transition. Banks are willing to provide project financing and debt
The CCC has been instrumental in guiding policy on carbon for developments.
budgets and targets.
Bolder targets might be required to achieve the required
run rate of renewable energy development to meet
Intergovernmental Panel on Climate Change (IPCC) targets.
Supporting policy and market framework Renewable energy Availability of international capital
The CfD mechanism has been a key driver of offshore enablers The UK’s position as a global financial centre is
wind deployment – CfD support for onshore wind, solar supportive of access to international capital for
and hydrogen remains insufficient. developers.
The carbon price floor, in conjunction with the EU ETS, There is strong interest from international financers to
has been crucial in creating a strong carbon price signal invest in UK developments.
in the power sector.
Cross-party commitment to coal phase-out by 2025 has
provided a greater level of market certainty.
Land allocation and permitting Transmission infrastructure
Permitting isthe main blocker of onshore deployment of renewable Gridinfrastructure is largely robust, but inadequate in its current
energy in the UK. form to support the pipeline of renewable energy projects.
A promising development is the Crown Estate showing willingness to Improvements are required to integrate the pipeline of renewable
engage with developers to improve the permitting process. energy developments.
Pipeline
impact: Supportive Major blocker
Page 31EMBARGOED UNTIL JULY 7th
Key policy recommendations
There are several policy levers that need to be pulled in order to overcome blockers
and unlock the vast potential of the identified project pipeline (1/3)
Policy Recommendations Enablers impacted
Develop bolder targets which are specific to offshore wind, onshore wind and solar PV (a no
Increase renewable regrets policy action, and that will help to increase power generation in the long term, to meet
1 energy ambition and
specify bold targets
increased needs arising from the electrification of adjacent sectors such as transport and
heating)
for onshore wind and
solar PV Set these bold, specified targets to help reduce uncertainty around long-term government
support for onshore wind and solar developments
Extend CfDs (the key driver of offshore wind investment and development) and more ambitiously
Extend CfDs more
2 ambitiously across
across onshore wind and solar PV in order to support the UK meeting its net zero ambition
onshore wind, solar
Put price floors in place to prevent a race to the bottom – and maintain developer and investor
PV and solar
confidence
Pipeline
impact: Supportive Major blocker
Page 32EMBARGOED UNTIL JULY 7th
Key policy recommendations
There are several policy levers that need to be pulled in order to overcome blockers
and unlock the vast potential of the identified project pipeline (2/3)
Policy Recommendations Enablers impacted
Expand and upgrade grid network through infrastructure projects that are transformative in
nature, such as the North Sea offshore grid, and that have the potential to support and
3 Expand and upgrade
accelerate new renewables capacity deployment
grid network
Stimulate sustained investment in smart grid development, to ensure the UK’s transmission and
distribution network is able to manage multiple sources of energy, which will be vital as the UK
moves to a more distributed generation model
Actively use green investments as a means to strategically strengthen and build new industry
clusters and level up UK regions, with a particular focus on offshore wind
4 Regional industry
Support the development of local supply chains to improve competitiveness and UK content on
projects (this has the potential to help drive job creation and cluster formation in regions such as
cluster investment
the Humber and East Anglia)
In consultation with local communities, consider mechanisms to accelerate land allocation and
permitting for onshore developments in specific areas
Pipeline
impact: Supportive Major blocker
Page 33EMBARGOED UNTIL JULY 7th
Key policy recommendations
There are several policy levers that need to be pulled in order to overcome blockers
and unlock the vast potential of the identified project pipeline (3/3)
Policy Recommendations Enablers impacted
5 EU ETS Cap at 39
Set the EU ETS cap in line with the CCC recommendation of 39 MtCO2e for the power sector in
2023, falling to 14 MtCO2e by 2030 (this will ensure the carbon price continues to help drive
MtCO2e
zero emission power investments)
Pursue an ambitious sector deal for hydrogen supported by both government and private
investment, with an explicit ambition to make the UK a global leader in the development,
6 Sector deal for
production and use of this technology as a means to unlock the broader potential of a green
economy
hydrogen
Establish a talent group as part of the sector deal to identify skills needs across the sector, and
develop curricula and accreditation to deepen the skills base
Pipeline
impact: Supportive Major blocker
Page 34EMBARGOED UNTIL JULY 7th
Agenda
► Executive summary
► Scale of the opportunity
► The UK’s renewables journey so far
► Key policy recommendations
► Appendix
Page 35EMBARGOED UNTIL JULY 7th
Appendix
Project pipeline summary — generation: offshore wind
Offshore wind-based projects are the main driver of the shovel-ready project pipeline in the UK in
terms of estimated capacity, investment required, full time employees (FTEs) created and MtCO2e
23 projects in the pipeline avoided
Project maturity
► The overall number of offshore wind generation projects is 23, accounting for 4% of the total number of
generation projects and 53% of total generation pipeline capacity.
► Of these 23 projects, the majority are in early stages of maturity – 48% (6.8GW) are in the ‘announced’
47 MtCO2e avoided stage, 39% (14.1GW) are in the ‘permitting’ stage, 9% (0.9GW) are in the ‘launched’ stage and 4%
(1.2GW) are in the ‘financing’ stage.
Investment size and developers
► The aggregated investment required amounts to US$111bn, accounting for 72% of the total investment
US$111bn investment required identified for generation projects.
► The average investment size of projects is US$4.8bn, ranging from multiple large scale projects over
$1bn down to small-scale projects requiring less than US$10mn funding.
► Project developers are mainly consortiums (50% of projects) and large corporations (40% of projects),
as well as some public entities and SMEs.
23GW of renewable generation
► The type of financing required has been identified as a mix of project debt and project equity.
capacity
Economic impact
► There is potential to create ca. 900k jobs which accounts for 70% of the total job creation potential
from generation projects.
55,000 local jobs Environmental impact
241,000 jobs in the supply chain ► There is potential for 47 MtCO2e to be avoided annually, which accounts for 57% of the total annual
generation emission abatement potential.
Note: an additional 330,000 manufacturing jobs could be created in-country with a localised supply chain.
Source: EY-Parthenon analysis. Page 36EMBARGOED UNTIL JULY 7th
Appendix
Project pipeline summary — generation: onshore wind
213 projects in the pipeline Onshore wind-based projects are a key driver of the shovel-ready pipeline in the UK in terms of
estimated capacity, investment required, FTEs created and MtCO2e avoided
Project maturity
► The overall number of onshore wind generation projects is 213 (including 8 with storage), accounting
for 39% of the total number of generation projects and 27% of total generation pipeline capacity.
21 MtCO2e avoided ► Of these 213 projects, the majority are in early stages of maturity – 89% (9GW) are in the ‘permitting”
stage, 7% (1.8GW) are in the ‘announced’ stage and 4% (0.8GW) are in the ‘launched’ stage.
Investment size and developers
► The aggregated investment required amounts to US$22bn, accounting for 14% of the total investment
identified for generation projects.
US$5.1bn investment required
► The average investment size of projects is US$103mn, ranging from large-scale projects over US$1bn
down to small-scale projects requiring less than US$5mn funding.
► Project developers are mostly large corporations (68% of projects and 64% of investment), international
consortiums (18% of projects / 23% of investment) and local consortiums (10% of projects / 9% of
11.5GW of renewable generation investment), as well as some public entities and SMEs.
capacity ► The type of financing required has been identified as a mix of project debt, project equity and support
subsidy.
Environmental impact
38,000 local jobs ► There is potential for 21 MtCO2e to be avoided annually, which accounts for 25% of the total annual
pipeline emission abatement potential.
19,000 jobs in the supply chain
Note: an additional 65,000 manufacturing jobs could be created in-country with a localised supply chain.
Source: EY-Parthenon analysis. Page 37EMBARGOED UNTIL JULY 7th
Appendix
Project pipeline summary — generation: solar
294 projects in the pipeline Solar-based projects are the main driver of the shovel-ready pipeline, and play an important role in
terms of estimated capacity, investment required, FTEs created and MtCO2e avoided
Project Maturity
► The overall number of solar generation projects is 294 (including 18 solar and PV projects), accounting
for 54% of the total number of generation projects and 14% of total generation pipeline capacity.
294 projects in the pipeline
► Of these 294 projects, the majority are in early stages of maturity – 82% (3.5GW) are in the ‘permitting’
stage, 13% (1.9GW) are in the ‘announced’ stage and 5% (0.6GW) are in the ‘launched’ stage.
Investment size and developers
► The aggregated investment required amounts to US$10bn, accounting for 7% of the total investment
US$10bn investment required identified for generation projects.
► The average investment size of projects is US$36mn, ranging from larger-scale projects over
US$400mn down to many small-scale projects requiring less than US$5mn funding.
► Project developers are mostly large corporations (91% of projects) as well as some public entities, SMEs
6GW of renewable generation and local consortiums.
capacity ► The type of financing required has been identified as a mix of project debt, project equity and support
subsidy.
Environmental impact
► There is potential for 9 MtCO2e to be avoided annually which accounts for 11% of the total annual
28,000 local jobs generation emission abatement potential.
51,000 jobs in the supply chain
Note: an additional 31,000 manufacturing jobs could be created in-country with a localised supply chain.
Source: EY-Parthenon analysis. Page 38EMBARGOED UNTIL JULY 7th
Appendix
Project pipeline summary — storage
62 projects in the pipeline
Storage projects are split across battery and hydrogen technologies
Project maturity
► Of the 62 projects, the majority are in early stages of maturity – 63% are in the ‘planned’ stage, 35%
are in the ‘announced’ stage and 2% are in the ‘under procurement’ stage.
US$5bn investment required Investment size and developers
► The total estimated investment required amounts to US$5bn, accounting for 3% of the total investment
identified for projects.
► The average investment size of projects is US$86mn, ranging from US$1mn to US$900mn.
10,000 local jobs
16,000 jobs in the supply chain
Note: an additional 15,000 manufacturing jobs could be created in-country with a localised supply chain.
Source: EY-Parthenon analysis. Page 39EMBARGOED UNTIL JULY 7th
Appendix
Project pipeline summary — transmission and distribution
66 projects in the pipeline
T&D projects connect to a number of plant types including: substations, wind and solar plants
Project maturity
► Of the 66 projects, the majority are in early stages of maturity – 59% are in the ‘planned” stage and the
remaining 41% are in the ‘proposed’ stage.
US$32 bn investment required ► The voltage levels of projects vary from 33kV through to 400kV.
Investment size and developers
► The estimated total investment required amounts to US$32bn, accounting for 17% of the total
investment identified for projects in the pipeline.
► The average investment size of projects is US$490mn, ranging from US$1mn to US$11bn.
110,000 local jobs
51,000 jobs in the supply chain
Note: an additional 95,000 manufacturing jobs could be created in-country with a localised supply chain.
Source: EY-Parthenon analysis. Page 40EMBARGOED UNTIL JULY 7th
Appendix
Project pipeline summary — notable projects identified
Sub-Sector Technology Project name Developer Capacity / Voltage
Firth of Forth (Berwick Bank and Marr
Generation Offshore wind Seagreen Wind Energy 4,150MW
Bank)
Norfolk Boreas /
Generation Offshore wind East Anglia offshore wind – Vattenfall 3,600MW
Vattenfall
Generation Offshore wind Hornsea Three Ørsted Hornsea Project Three 2,400MW
Generation Hydro Coire Glas SSE 1,500MW
PS Renewables /
Generation Solar PV Sunnica Energy Farm 500MW
Tribus Clean Energy
Hydrogen energy Element Energy / Ørsted / Phillips 66 /
Storage Gigastack 5MW
storage ITM Power
Hydrogen energy
Storage Dolphyn Project Nel ASA / Doosan Corporation 2MW
storage
Transmission and
Offshore wind Killingholme - Hornsea Platform 2A Line National Grid 400kV
distribution
Transmission and
Offshore wind Killingholme - Hornsea Platform 2B Line National Grid 400kV
distribution
Page 41EMBARGOED UNTIL JULY 7th
Appendix
Climate policy overview
Key national targets Major policy
Climate Change Act (2008)
GHG emissions reduction by 2030,
68% compared with 1990 levels Sets in legislation the UK's approach to tackling and responding to climate change
Long-term legally binding 2050 target to reduce greenhouse gas emissions to net zero –
Net this target was made more ambitious in 2019, replacing the previous target of an 80%
by 2050
zero reduction relative to 1990 levels
The CCC’s recommended target carbon budgets covering the period from 2008 to 2032
40GW offshore wind capacity by 2030 have been established in law, with the sixth carbon budget of 78% recommended for 2037
Ten Point Plan for a Green Industrial Revolution (2020)
£12 billion of government investment
low-carbon hydrogen production capacity
5GW by 2030 Stated RE targets of 40GW for offshore wind and 5GW for hydrogen
CfDs (launched in 2015)
Generation
PPA scheme that pays developers a flat (indexed) rate for the electricity they produce over
Other Hydro/marine
a 15-year period
6% Currently supports 49 renewable electricity projects across a range of technologies,
Solar
2% 12% totalling 15.5GW – with plans for the next allocation round in 2021 to support up to 12GW
Energy White Paper (2020)
21%
Sets out the Government’s policies and commitments that will enable the UK to become
Wind
58%
net zero by 2050
Non-renewable
Source: EY-Parthenon analysis. Page 42EMBARGOED UNTIL JULY 7th
Appendix
COVID-19 recovery and resilience plan
COVID-19 recovery plan Key figures
As a result of the COVID-19 pandemic, the UK economy is expected to
contract by 10%. The UK Government put in place a £280bn recovery
package to stabilise the economy. Included in the recovery plan are policies to
£280bn recovery package
‘build back greener’, supporting the transition to net zero by 2050.
Key long-term actions
£1 billion Net Zero Innovation Programme to accelerate the £1bn net zero Innovation Programme
commercialisation of innovative low-carbon technologies, systems and
processes in power; priority areas include hydrogen and floating offshore
wind
funding for green hydrogen projects
£134m sustainable innovation fund (SIF) to help businesses build back £240m announced in Ten Point Plan
greener
£240m funding for green hydrogen projects announced in the Ten Point
Plan in 2020, to support economic recovery and the Government’s 5GW funding to support offshore wind
target for 2030 £160m manufacturing infrastructure
£160 million scheme to support the development of offshore wind
manufacturing infrastructure
Renewed ambition to create four low-carbon clusters by 2030, and one net sustainable innovation fund to help
zero cluster by 2040 (these will be focused on areas such as the North East,
£134m businesses build back greener
the Humber, North West, Scotland and Wales)
Source: EY-Parthenon analysis, BEIS Page 43EMBARGOED UNTIL JULY 7th EY | Building a better working world EY exists to build a better working world, helping to create long-term value for clients, people and society and build trust in the capital markets. Enabled by data and technology, diverse EY teams in over 150 countries provide trust through assurance and help clients grow, transform and operate. Working across assurance, consulting, law, strategy, tax and transactions, EY teams ask better questions to find new answers for the complex issues facing our world today. EY refers to the global organization, and may refer to one or more, of the member firms of Ernst & Young Global Limited, each of which is a separate legal entity. Ernst & Young Global Limited, a UK company limited by guarantee, does not provide services to clients. Information about how EY collects and uses personal data and a description of the rights individuals have under data protection legislation are available via ey.com/privacy. EY member firms do not practice law where prohibited by local laws. For more information about our organization, please visit ey.com. About EY-Parthenon EY-Parthenon teams work with clients to navigate complexity by helping them to reimagine their eco-systems, reshape their portfolios and reinvent themselves for a better future. With global connectivity and scale, EY-Parthenon teams focus on Strategy Realized — helping CEOs design and deliver strategies to better manage challenges while maximizing opportunities as they look to transform their businesses. From idea to implementation, EY-Parthenon teams help organizations to build a better working world by fostering long-term value. EY-Parthenon is a brand under which a number of EY member firms across the globe provide strategy consulting services. For more information, please visit ey.com/parthenon. © 2021 EYGM Limited. All Rights Reserved. EYG no. 005156-21Gbl This material has been prepared for general informational purposes only and is not intended to be relied upon as accounting, tax or other professional advice. Please refer to your advisors for specific advice. ey.com
You can also read


