Energy outlook 2021 - ING Think
←
→
Page content transcription
If your browser does not render page correctly, please read the page content below
Energy Outlook 2021 January 2021
                                     THINK Economic & Financial Analysis
                                                             12 January 2021

                                     Energy outlook 2021

Gerben Hieminga
Senior Economist
Amsterdam +31 6 8364 0072
gerben.hieminga@ing.com

Nadège Tillier
Head of Corporates Sector Strategy
Amsterdam +31 20 563 8967
nadege.tillier@ing.com

Warren Patterson
Head of Commodities Strategy
Singapore +65 6232 6011
warren.patterson@asia.ing.com

www.ing.com/THINK                                                          1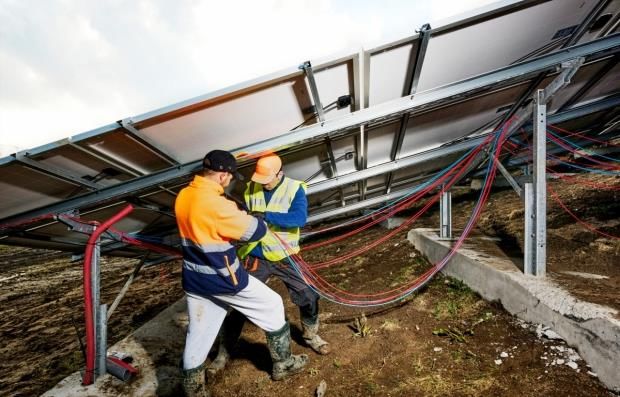
Energy Outlook 2021 January 2021
Contents
Executive summary 3
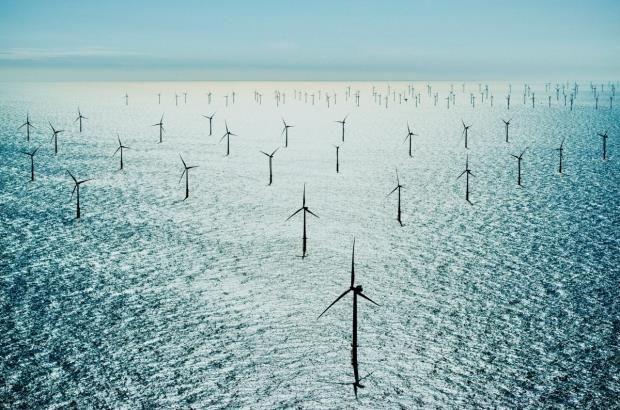
Solid growth for wind and solar 4
Wind and solar get increasingly cheaper 8
Rise in investments increase capital needs for utilities 12
Asian LNG drags the gas complex higher 16
Oil market set to continue tightening over 2021 19
Disclaimer 22
2
Energy Outlook 2021 January 2021

                                   Executive summary
                                     The pandemic reduced energy demand in 2020, but the energy markets will bounce
                                     back in 2021 as the global economy recovers. Covid-19 has had little impact on the
                                     growth prospects for wind and solar, the oil market continues to tighten and LNG is
                                     boosting the gas market. On the back of these market trends, European utilities will
                                     likely increase investment by +5.5%.

                                   The European wind and solar markets are expected to provide solid growth of 8% and
                                   13% in 2021 in terms of capacity additions, which require €90 billion of investment. On
                                   the supply side, wind and solar continue to benefit from policy support for green local
                                   power systems. On the demand side, we expect power demand to increase by 3% in
                                   2021, although the extension of lockdown periods and delays to the vaccine rollout
                                   could lead to stagnation.

                                   Wind and solar energy are expected to gain cost competitiveness over fossil fuel and
                                   nuclear power in 2021. It's getting increasingly cheaper to add new wind and solar
                                   capacity compared to new fossil fuel power plants or nuclear power plants. The
                                   anticipated 35 GW addition of wind and solar capacity is likely to add to price volatility in
                                   European power markets in 2021 as large scale power storage facilities, such as
                                   batteries and electrolysis, remain relatively small.

                                   European utilities showed resilience in 2020 on the back of the Covid-19 pandemic,
                                   however they were not immune from declines in power and gas consumption and
                                   company financials felt the impact. European utilities should be able to return to growth
                                   in 2021 and many are maintaining their ambitious capital expenditure plans. Overall, we
                                   anticipate a +5.5% increase in investment from utilities. This will lead to additional needs
                                   for financing as the sector’s cash flow generation in 2021 will not be sufficient to cover
                                   the higher level of investment. We expect utilities to be printing €40bn of bonds in 2021
                                   of which €20bn will be green bonds.

                                   Gas markets had a volatile 2020, with prices initially coming under pressure from both
                                   the hit to demand and ramping up of LNG capacity. However, a rallying Asian LNG
                                   market has dragged the whole natural gas complex higher. We believe that the spread
                                   between Asian LNG and European prices will continue to support spot cargoes to flow
                                   into Asia rather than Europe.

                                   The tightening in the oil market is expected to continue over 2021, which suggests
                                   further upside for oil prices. Bear in mind though, that there is still plenty of uncertainty
                                   due to Covid-19, the rollout of vaccines and future supply cuts from OPEC+.

                                                                                                                                   3
Energy Outlook 2021 January 2021

                                      Solid growth for wind and solar
                                      Covid-19 has had little impact on the growth prospects for wind and solar. The
Gerben Hieminga                       European wind and solar markets are expected to provide solid growth of 8% and
Senior Economist                      13% in 2021 in terms of capacity additions, which will require €90bn of investment
Amsterdam +31 6 8364 0072
gerben.hieminga@ing.com

                                      On the supply side, wind and solar continue to benefit from policy support for green
                                      local power systems. On the demand side, we expect power demand to increase by 3%
                                      in 2021, although the extension of lockdown periods and delays to the vaccine rollout
                                      could lead to stagnation.

                                      Power demand: on the rise again
                                      Eurozone power demand took a hit of c.5% in 2020 as a result of the lockdown
                                      measures. Heavy power users in manufacturing, transportation (notably railways) and
                                      commercial real estate (offices) required less power as a result. Increased power
                                      demand from working from home could only partially compensate for these declines.

                                      The shape of the economic recovery will determine power demand in 2021. Economic
                                      growth depends critically on the evolution of the coronavirus and the vaccine rollout.
                                      ING’s base case scenario assumes that lockdowns are alleviated in 1Q21, but social
                                      distancing remains the norm for much longer in 2021. We believe a handful of vaccines
                                      will be available and rolled out in 1H21. In this scenario the eurozone economy is
                                      expected to grow by 3.5% in 2021 and power demand by c.3%, mostly driven by the
                                      manufacturing sector. Currently, downward risk is mounting with the emergence of a
                                      virus mutation in the UK that is more contagious. If the virus lengthens the current
                                      lockdown period, reignites a third lockdown later this year, or if the vaccine rollout takes
                                      longer, the eurozone economy could shrink by -0.5% in 2021. In that case, power
                                      demand would be flat in 2021. On the upside, rapid testing capability and faster vaccine
                                      availability could boost economic growth to 6.1%, resulting in power demand growth of
                                      c.4%-5% in 2021.

                                      Power demand increasingly decoupled from economic growth in the years before the
                                      outbreak of the Covid-19 pandemic. In 2018-2019, power demand fell while the

                                                                                                                                 4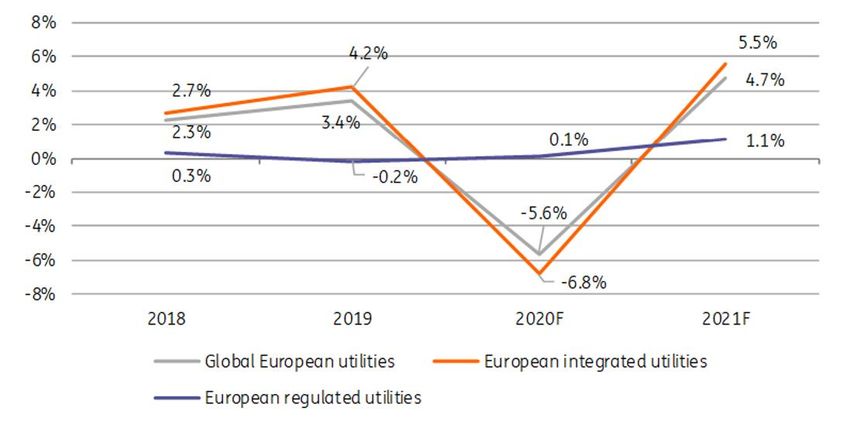
Energy Outlook 2021 January 2021

                                   eurozone economy grew by 1.3 to 1.9%. Increased energy efficiency and the large share
                                   of services in the economy made the economy less power dependent. And
                                   electrification of energy-intensive sectors, such as manufacturing and the built
                                   environment, is not expected to lift power demand considerably before 2025. Covid-19
                                   has temporarily put a brake on this decoupling process. Lockdowns, and the resulting
                                   recovery phase, are causing power demand and economic growth to move in tandem
                                   again.

                                   Economic recovery lifts power demand in 2021
                                   Year on year change in Eurozone economic growth and power demand

                                   Source: Eurostat, ING Research

                                   Power supply: Ireland, the Iberian region, UK and Germany are most
                                   dependent on wind and solar
                                   Over the year, up to a third of power comes from wind and solar in Ireland, Spain and
                                   Portugal (the Iberian region), the UK and in Germany. During the year, on a daily or
                                   hourly basis, shares can range from almost zero to over 100% depending on local
                                   weather conditions and power demand.

                                   Ireland and Iberia region most dependent on wind and solar, France
                                   and Benelux least
                                   Expected power mix in 2020 based on power generation

                                   *Mostly biomass and geothermal energy
                                   Source: Eurostat, BNEF, ING Research

                                                                                                                           5
Energy Outlook 2021 January 2021

                                   Wind is big in the larger Eurozone countries, solar in the Benelux
                                   countries and Ireland
                                   Expected division between wind and solar in power generation in 2020

                                   Source: Eurostat, BNEF, ING Research

                                   Countries so far have taken different strategies regarding wind and solar. In the Benelux
                                   countries and Ireland, much more power comes from solar panels than from wind
                                   turbines. In the Nordics and the UK - and even in sunny countries like France, Spain and
                                   Portugal - more power is generated with wind turbines compared to solar panels.

                                   Globally, the wind market is an onshore market, as around 80% of wind power is
                                   generated on land, but again this varies from country to country. In Europe, onshore
                                   wind power dominates in Germany, France, Italy, Ireland and the Iberian and Nordic
                                   regions. In the UK and the Netherlands, wind comes equally from on- and offshore
                                   windfarms, whereas in Belgium, almost all the wind power is generated offshore.

                                   €60bn investment in wind and solar anticipated for 2021
                                   The European wind and solar markets are expected to provide solid growth of 8% and
                                   13% in 2021 in terms of capacity additions. In absolute terms, capacity additions are
                                   largest in the onshore wind sector (13 GW) and for small scale solar projects (12 GW). In
                                   the offshore wind sector c.2GW of capacity will be added in 2021. That is relatively small
                                   compared to the other segments, but policymakers in the Nordics, UK, Ireland, Germany
                                   and the Netherlands continue to work on special planning for offshore wind farms and
                                   grid infrastructure. So more is about to happen in the coming years for offshore wind
                                   farms. All in all, we expect to see c.35 GW growth in the combined wind and solar
                                   market, which will require €60bn of investment.

                                                                                                                              6
Energy Outlook 2021 January 2021

                                   Growth in solar outpaces growth in wind
                                   Yearly growth in installed capacity for solar and wind energy in Europe

                                   Source: BNEF, ING Research.

                                   Most capacity is added in onshore wind and small-scale solar projects
                                   Added capacity in Europe in GW

                                   Source: BNEF, ING Research.

                                                                                                             7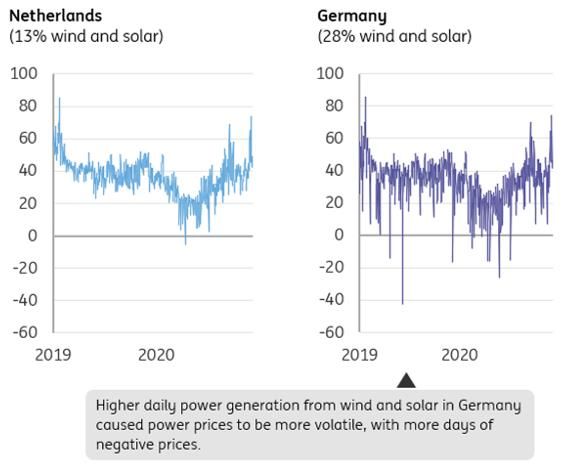
Energy Outlook 2021 January 2021

                                      Wind and solar get increasingly
                                      cheaper
Gerben Hieminga
Senior Economist                      Wind and solar energy are expected to gain cost competitiveness over fossil fuel and
Amsterdam +31 6 8364 0072
                                      nuclear power in 2021. Increasingly, it is becoming cheaper to add new wind and solar
gerben.hieminga@ing.com
                                      capacity compared to new fossil fuel power plants or nuclear power plants

                                      The anticipated 35 GW addition of wind and solar capacity will likely add to price
                                      volatility in European power markets in 2021, as large scale power storage facilities,
                                      such as batteries and electrolysis, remain relatively small.

                                      First tipping point: gifts of nature
                                      The price development of wind and solar is marked by three important tipping points
                                      (see table). First, wind and solar power have always benefited from close to zero
                                      marginal costs. Once the panels and turbines are in place they are the cheapest
                                      technology to produce an extra MWh of electricity, as wind and sun are freely available
                                      whereas fossil power plants need to pay for gas or coal. In short, existing wind and solar
                                      projects outcompete existing coal and gas power plants. Renewables drive out fossil fuel
                                      production once they enter the power mix.

                                                                                                                                8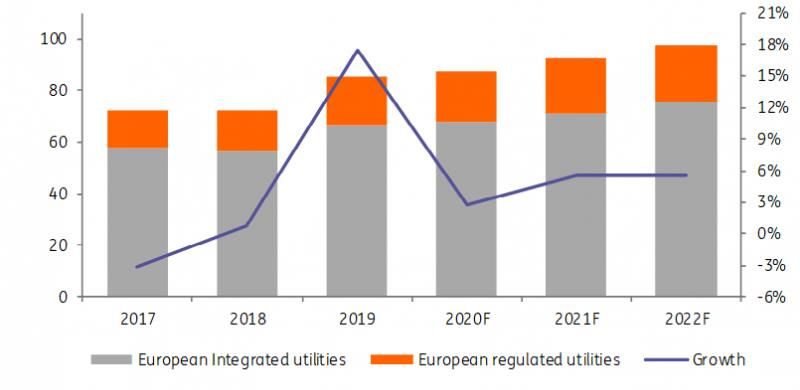
Energy Outlook 2021 January 2021

                                   Overview of renewable energy price tipping points: competition
                                   continues in 2021
                                   Indicative ranking for the cost competitiveness of wind and solar (renewables) versus
                                   fossil and nuclear power (non-renewables.

                                   *In economic terms: the Life Cycle cost OF Electricity of solar and wind are lower than the marginal costs for coal
                                   and gas fired power plants. A distinction between a) to d) also applies to this third tipping point, but none of them
                                   is valid for renewables in 2021 and therefore left out.
                                   Source: ING Research

                                   Second tipping point: new-build wind and solar cheaper than new-
                                   build coal, gas and nuclear plants
                                   For investment decisions, one must also include the initial investment through capital
                                   costs and the maintenance costs to keep the technology running. The Life Cycle cost Of
                                   Electricity (LCOE) does just that and can be viewed as the total cost to produce a MWh of
                                   electricity during the lifespan of the asset. Nowadays, even new-build renewables are,
                                   on average, cheaper than new-build fossil fuel or nuclear power plants (see graph). We
                                   expect this gap to widen further in 2021. First, solar panels and wind turbines continue
                                   to get cheaper and experience favourable tender conditions in the current economic
                                   environment. Second, we expect upward pressure on fossil and carbon prices in 2021.
                                   Lastly, an estimated 35 GW of solar and wind capacity is expected to enter European
                                   power systems, which will lead to lower utilisation rates of fossil fuel power plants.

                                   Wind and solar are cheapest ways of power generation
                                   Average Life Cycle cost OF Electricity (LCOE) for major power technologies in Europe
                                   in 2019 in euro/MWh

                                   *Combined Cycle Gas Turbines or CCGT power plants. The LCOE for gas peaker plants is much higher.
                                   Source: IEA World Energy Outlook 2020, ING Research

                                                                                                                                                       9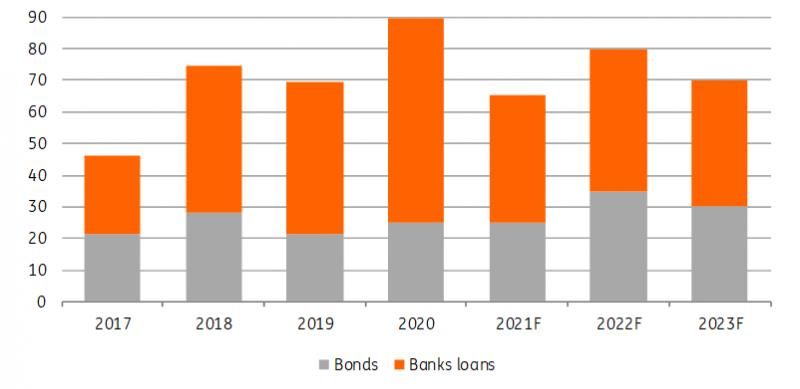
Energy Outlook 2021 January 2021

                                   This tipping point of new-build wind and solar projects being cheaper compared to new-
                                   build fossil fuel power plants is likely to get more nuanced in 2021 and the years
                                   beyond. It holds in most cases if the cost for investment in the power grid are not taken
                                   into account. But power grids are increasingly showing their limitations to
                                   accommodate renewables in areas with a high supply of renewables (e.g. large wind
                                   and solar farms in rural areas) or strong growth in power demand (e.g. new data centres
                                   in urban areas).

                                   Furthermore, this tipping point needs to factor in the production profile of renewables
                                   during the day. For example, power generation from solar and wind has a strong peak at
                                   noon, especially on sunny days. Production needs to be shut down (curtailed) in case
                                   supply exceeds demand or if prices are negative and the plant is penalised for power
                                   generation1. In 2021, new-build renewables could be cheaper compared to new build
                                   fossil fuel plants even if a couple of days of curtailment per year are factored in.

                                   Curtailment could be technically avoided by adding storage facilities to solar and wind
                                   projects so that electricity can be stored during times that supply exceeds demand or
                                   when prices are too low to cover costs. However, new-build wind and solar projects
                                   combined with large scale battery storage or hydrogen electrolysis is not yet cost
                                   competitive with new-build fossil fuel plants.

                                   Third tipping point: new-build wind and solar cheaper than existing,
                                   gas and nuclear plants
                                   Finally, a third and even more disruptive tipping point would emerge if the costs of
                                   building new solar and wind projects are lower than running existing coal or gas fired
                                   power plants. In that case, it would be economically viable to replace fossil fuel power
                                   generation with wind and solar energy. A considerable part of fossil fuel generation is
                                   still needed though to act as a back-up facility at times when the sun and wind are not
                                   strong enough, especially in the absence of large scale storage facilities. This third
                                   tipping point does not hold in 2021 and power market structures are likely to change
                                   once markets reach this tipping point in order to guarantee the reliability of power
                                   systems at all times.

                                   Renewables and power prices: a comparison between Germany and
                                   the Netherlands
                                   The impact of renewables on European power prices is likely to increase. Research shows
                                   that power prices get more volatile as wind and solar leave their mark on the power
                                   mix2. In that respect it is interesting to compare the German and Dutch power markets.
                                   These markets are quite similar but differ in the degree of wind and solar power
                                   generation. First, the similarities. In both countries the majority of power is little market
                                   risk and produce as much power as possible, irrespective of the power price. In Germany,
                                   however, the share of wind and solar in the power mix is twice the share of wind and
                                   solar in the Dutch power mix (28% vs 13%). That is a major difference that sets these
                                   markets apart.

                                   1
                                       This is the case for subsidy free wind and solar projects where the owners run merchant risk.
                                   2
                                       See for example the energy outlooks by Aurora Energy Research, DNV-GL and Bloomberg New Energy Finance.

                                                                                                                                             10
Energy Outlook 2021 January 2021
More wind and solar add to volatility in power prices
Daily spot prices of baseload power in euro/MWh
Source: IEA World Energy Outlook 2020, ING Research
Higher shares of renewables make German power markets more
volatile
The higher share of renewables in Germany has two major implications for power prices
(see graph). First, German power prices are more volatile as wind and solar push down
the power price on sunny and windy days much further than in the Netherlands3.
Second, with the lack of large storage facilities for surplus power, and with most wind
and solar assets producing as much power as possible (subsidy-based renewables), the
higher share of wind and solar in Germany results in more days with near zero or even
negative power prices. We expect this situation to continue in 2021 for two reasons.
First, more renewables will enter European power markets in 2021. Second, the vast
majority of power generation from renewables will be subsidy-based in 2021 despite the
early trend of subsidy-free tender bids for renewables. Therefore, owners of wind farms
and solar panels have little incentive to cut back on production when prices are low or
negative.
In Germany, the average power price in the 2019-2020 period is €2 lower compared to
the Netherlands (34 vs 36 euro/MWh). Volatility is €4 higher (standard deviation 15 vs 11
euro/MWh).
3
In Germany, the average power price in the 2019-2020 period is €2 lower compared to the Netherlands (34 vs 36
euro/MWh). Volatility is €4 higher (standard deviation 15 vs 11 euro/MWh).
11Energy Outlook 2021 January 2021
Rise in investments increases
capital needs for utilities
Nadège Tillier
Head of Corporates Sector Strategy A recovery in power demand of 3% on average for the European Union, coupled with a
Amsterdam +31 20 563 8967
recovery in power prices, should bring European utilities back to growth in 2021
nadege.tillier@ing.com
Across Europe, power demand fell 4.3% in 2020, according to ENTSO-E’s statistics.
Depending on the severity of the Covid-19 pandemic and lockdown measures
implemented by governments, some countries were more severely impacted than
others. The consumption of natural gas also drastically slumped and its price on the
markets reached all-time lows. A recovery in power demand of 3% on average for the
European Union (according to Eurostat’s expectations) coupled with a recovery in power
prices should bring European utilities back to growth.
On aggregate, based on a panel of 38 utilities4, we estimate that European utilities’
EBITDA will be 5.6% lower in 2020 vs. 2019. While regulated utilities’ EBITDA should come
in flat (+0.1% in 2020 vs. 2019), integrated utilities bear most of the impact from the
Covid-19 pandemic with an aggregate EBITDA down 6.8%, according to our estimates.
4.7% European utility sector’s EBITDA to grow by this amount on
average in 2021 vs. 2020
4
38 utilities: A2A, Acea, Alliander, Centrica, CEZ, EDF, EDP, Elia Belgium, Enagas, EnBW, Enel, Enexis, Engie,
E.ON/Innogy, Eurogrid, Fluvius, Fortum, Hera, Iberdrola, Italgas, National Grid, Naturgy, Nederlandse Gasunie,
Orsted, Red Electrica, REN, RTE, RWE, Snam, SSE, Stedin, Suez, TenneT, Terna, Vattenfall, Veolia, Viergas.
12Energy Outlook 2021 January 2021
European integrated and regulated utilities – sector EBITDA 2018-2021F
Source: Company data, ING
Earnings growth in 2021
While a number of grid utilities will see their remuneration reduced by (new) regulatory
packages, their strong capital expenditure plans will preserve cash flow generation
growth thanks to inflated regulated assets bases. In 2021, we expect European
regulated utilities’ EBITDA to grow 1.1% vs. 2020. With power and gas prices as well as
consumption up in 2021, integrated utilities should be able to catch-up with a sector
EBITDA growth estimated at 5.5%, based on updated strategic plans and our
assumptions. All in all, we estimate that the overall sector (integrated utilities and
regulated) will grow earnings before interest, depreciation and amortisation by 4.7%.
Although it will not erase completely the 5.6% reduction in 2020, we consider this
number to be very supportive for the sector.
Contrary to oil & gas majors, European utilities are maintaining their ambitious capital
expenditure plans. A number of utilities have even posted new strategic plans including
bigger investments in 2021 and beyond, in comparison with their initial intentions last
year and two years ago. Total investment in 2021 is expected to surpass 2020 by 5.5%
with a strong focus once again on renewable capacity development and upgrade, as
well as the expansion of power networks. We expect a similar expansion of investment
in 2022, with growth of 5.6%, according to companies’ information and our estimates.
5.5% Increase in investments in 2021
Total investment (€bn) and growth for the European sector (selection of 38 utilities)
Source: Company data, ING
13Energy Outlook 2021 January 2021
Financing capex plans
The expansion of capital expenditure, which started in 2019 and will go on in 2021 and
beyond, suggests that cash flow generation (represented by cash flow from operations)
will not be enough to fully finance investments. This is particularly true for regulated
utilities, whose capital expenditure is expanding even more strongly than for integrated
utilities. Taking our panel of 38 utilities altogether, we expect cash flow from operations
to cover 94% of investment expenditures in 2021. Taking expected dividend payments
into consideration, this ratio falls to 80%, according to our estimates.
Cash flow from operations/investment ratio
Source: Company data, ING estimates
Bond issuance
With cash flow generation too short to cover the capital expenditure in full, additional
debt via bond or bank loan issuance, will translate into higher debt and pressure on
credit ratios.
As far as the current debt burden is concerned, the utility sector has a relatively low
bond and bank loan redemption schedule in 2021. While bond and bank loan
redemptions reached almost €90bn in 2020, this number falls to €65bn in 2021. Total
redemptions will step up again in 2022, reaching €80bn.
€ bonds and bank loans redemption schedule 2017-2023 (in €bn)
Source: Dealogic, ING
With ambitious capital expenditure plans and dividends payouts not fully covered by
cash flow generation, we expect utilities to be printing c.€40bn of bonds this year. The
Utility sector will continue to support global green bond issuance. Among all the
14Energy Outlook 2021 January 2021
corporate sectors (excluding Financials), utilities have been the most active in green
bonds in the last few years due to the sector’s major role in energy transition plans.
In 2020, the markets, all currencies included, issued an equivalent of c.€380bn of
sustainable bonds including green, social, sustainability and SDG-linked bonds. As far as
euro-denominated bonds are concerned, some €230bn of bonds equal to or above
€250m were printed in 2020. We forecast total euro-denominated sustainability bonds
to reach €315bn in 2021.
20bn € denominated green bonds in 2021 for the utility sector
2020 and 2021F € denominated bond sustainable issuance (in €bn)
45
35
32
30
175
130
Source: Eikon, Informa, Company info, ING estimates
While we believe sovereigns and agencies will continue to dominate green, social and
sustainable bond issuance in 2021, we expect the corporate sectors (excluding
financials) to issue €45bn, with utilities accounting for €20bn of green bonds. Among the
€45bn, we also expect more SDG-linked bonds (€12bn in 2021 against €3.1bn in 2020) as
the format becomes more popular. A number of European oil & gas majors and utilities
announced they were contemplating the issuance of SDG-linked (Sustainable
Development Goals) bonds in 2021 that would allow the companies to target specific
sustainability goals.
15Energy Outlook 2021 January 2021
Asian LNG drags the gas complex
higher
Warren Patterson
Head of Commodities Strategy Gas markets had a volatile 2020, with prices initially coming under pressure with not
Singapore +65 6232 6011
only a demand hit, but a ramping up in LNG capacity. However, a rallying Asian LNG
warren.patterson@asia.ing.com
market more recently has dragged the whole natural gas complex higher. In fact, LNG
turned out to be the best performing commodity in 2020, and has made record highs
at the start of 2021
Soggy demand and growing capacity
As seen with most markets in 2020, LNG was unable to escape the Covid-19 related
demand hit, with industrial gas demand weighed down by lockdowns. This saw LNG
prices in Asia trading to record lows, which also weighed on regional gas hub pricing
around the globe, and in particular Europe. This only added to what was already set to
be a bearish year for LNG markets, following a mild winter, along with the fact that
around 24mtpa of LNG export capacity was scheduled to start up over the course of
2020, with the bulk of this capacity coming online in the US.
Therefore the market witnessed a large number of US LNG cargo cancellations over the
summer, with the price collapse in Asia and Europe making it uneconomical for buyers
in the region to take delivery of cargoes. Nearly 175 LNG cargoes were cancelled
between March and October of 2020, with the majority of these cancellations taking
place in June-August 2020, a seasonally softer period for gas demand.
If we look at export data from the US, volumes collapsed over the summer months as a
result of these cancellations. Volumes hit a low of below 1.9mt in August, which is the
lowest monthly number seen since 2018, and well below the roughly 5.5mt exported in
February. However since then, and with cancellations easing, we have started to see
volumes pick up once again. Due to the recovery we are seeing, along with strong export
volumes at the start of 2020, total exports from the US over the first 11 months of 2020
are still up around 32% year-on-year, according to IHS Markit, and full year exports will
still see very impressive growth.
16Energy Outlook 2021 January 2021
In Asia, while LNG imports over April and May fell YoY as a result of lockdowns across the
region, we have seen quite the recovery in demand since then. Data from IHS Markit
shows that LNG imports into Asia over the first 11 months of 2020 totalled a little over
233mt, which is still up almost 7% YoY.
As for Europe, the region continued to see strong growth in LNG imports through until
the end of May. Since then though, volumes have come under pressure as a result of
cancellations, while more recently given the premium that the Asian market is trading
at to Europe, any spot cargoes will likely make their way to Asia rather than Europe.
However, over the first 11 months of 2020, imports total a little over 82mt, up 2% YoY,
according to IHS Markit data.
US LNG cargo cancellations in 2020
Source: Various media reports
The market roars back
LNG cargo cancellations certainly helped in rebalancing regional markets, which has
been more supportive for prices in recent months. A number of unplanned outages in
the US as a result of hurricane activity, along with extended maintenance at some LNG
plants in Australia, has only provided further support. In addition, colder than usual
weather in North Asia has been a bullish driver, while a delay in shipments through the
Panama canal, along with rallying freight rates has only helped to push the market even
higher. Spot Asian LNG prices have reached record levels in early January, with JKM
trading above US$20/MMBtu. While these very high prices may see some buyers taking
a step back, with cold weather expected to continue, prices are likely to remain well
supported in the near term.
The spread between Asian LNG prices and Henry Hub in the US is wider than
US$17/MMBtu, suggesting very little chance of seeing further cancellations anytime
soon, in fact a spread of that level should see LNG plants in the US maximising
throughput. Meanwhile, the spread between Asian LNG and European prices (TTF) is
almost US$13/MMBtu, and so there is a clear incentive for spot cargoes to flow into Asia
rather than Europe.
Looking further ahead, and in terms of liquefaction capacity, we do appear to be behind
the bulk of capacity additions, at least for the next several years. In 2021, only about
8mtpa of capacity is expected to come online, which should be much more manageable
for the market to absorb, particularly with demand expected to grow at a healthy pace.
This all suggests that regional gas markets will be better supported over 2021, and it
looks increasingly unlikely that we will see a repeat of cargo cancellations this year.
Clearly, Covid-19 remains a risk if we were to see further waves over the course of the
year.
17Energy Outlook 2021 January 2021
Limited US LNG export capacity set to come online over the next two years (mtpa)
Source: EIA, ING Research
ING natural gas forecasts
1Q21 2Q21 3Q21 4Q21 FY21
ICE NBP (GBp/therm) 45 32 34 40 36
TTF (EUR/Mwh) 16 12 13 15 14
Henry Hub (US$/MMBtu) 2.8 2.6 2.7 3.1 2.8
Source: ING estimates
18Energy Outlook 2021 January 2021
Oil market set to continue
tightening over 2021
Warren Patterson
Head of Commodities Strategy While there is still plenty of uncertainty over 2021 due to Covid-19, the roll out of
Singapore +65 6232 6011
vaccines and continued supply cuts from OPEC+ mean that the market should
warren.patterson@asia.ing.com
continue to tighten over the course of the year, which suggests further upside for oil
prices
OPEC+ to continue with cuts
2020 was a year which saw OPEC+ having to take extraordinary action in order to try
stabilising the oil market. The unprecedented fall in oil demand last year, and in
particular over 2Q20, left the market drowning in supply. Covid-19 meant that OPEC+
members had to put aside their differences in April, and agree on historic record
production cuts. The group agreed to cut by 9.7MMbbls/d over May and June, and this
was eased as we moved through the year. Under the original deal the group was set to
ease further starting in January 2021, reducing the level of cuts to 5.8MMbbls/d, which
would then be in place until April 2022. However, with the demand recovery this year
taking longer than initially expected, coupled with a surge in Libyan supply, the group
has been forced to revisit this plan, given the risk that easing too much at the beginning
of 2021 could push the market back into surplus.
Instead, OPEC+ will ease output less than originally planned. For January 2021, the
group eased cuts by 500Mbbls/d, leaving the level of cuts at 7.2MMbbls/d. From there,
OPEC+ will assess the market on a monthly basis and decide whether to ease further.
Under the revised deal, the group will ease by a maximum of 500Mbbls/d per month.
This approach does create more uncertainty around what OPEC+ may decide every
month, and so the potential for increased volatility in the first few months of 2021. We
have already witnessed this during the first week, with Saudi Arabia announcing that it
would make additional voluntary cuts of 1MMbbls/d over February and March, following
the last OPEC+ meeting.
We believe that the changes the group made to the deal will be enough to ensure that
the market does not return to surplus in 1Q21 while for the remainder of the year, we
would expect the market to continue drawing down stocks. Clearly, much will depend on
how Covid-19 develops over the course of this year.
19Energy Outlook 2021 January 2021
Quarterly oil balance (MMbbls/d)
Source: IEA, EIA, Rystad Energy, ING Research
Limited non-OPEC supply growth
OPEC+ was not the only one to respond to the weaker price environment that we saw in
2020. Non-OPEC+ producers were also quick to shut in production in 1H20 due to the
build up in stock, and the weak price environment. At its peak over May, we saw
somewhere in the region of 2.7MMbbls/d of non-OPEC+ production shut, with the US
standing out, having shut in a little over 1MMbbls/d of production in May.
However, what has been even more surprising is that with the fairly quick recovery in oil
prices from the April lows, producers have been quick to bring back this shut-in
production. The US has basically brought back all shut-in production, while Norway
seems to be the only meaningful producer to have still shut-in production, although that
is due to mandated production cuts put in place earlier in 2020.
We saw a large decline in non-OPEC supply over 2020 and this year growth is expected
to be limited, with less than a 500Mbbls/d increase year-on-year, which still leaves non-
OPEC supply in 2021 well below 2019 levels.
In the US, while we have seen a pick-up in rig activity in recent months, it is still well
below pre-Covid-19 levels, with the number of active rigs in the US standing at 267,
down around 61% since mid-March. Therefore, it is difficult to see the US returning to
growth anytime soon. We would need to see a further pick up in prices before producers
are willing to increase spending, and as a result, a significant pick up in drilling activity.
Producers will likely rely on drilled but uncompleted wells (DUCs) in order to try to
sustain production levels, although these DUCs have only been declining at a fairly
modest pace in recent months. For 2021, US production is expected to fall by a further
300Mbbls/d YoY to leave output averaging 11.1MMbbls/d. This compares to an estimated
850Mbbls/d YoY decline in 2020.
Demand uncertainty
The biggest uncertainty and risk for the market remains the demand outlook. While
recent vaccine developments are positive for the demand outlook in the medium term,
there are still plenty of uncertainties over demand in the short term, with it likely to take
some time before a vaccine becomes widely available, allowing us to all return to a
more normal life. Before that comes, there are risks of further Covid-19 waves and
lockdowns, and international air travel is likely to remain very limited until governments
feel comfortable easing border restrictions and quarantine requirements. Assuming that
we see an effective vaccine becoming widely available from spring into summer, we
believe that we will see a robust demand recovery over the second part of 2021.
However, we are still unlikely to return to pre-Covid-19 levels in 2021. We are currently
assuming that demand will grow by around 6.7MMbbls/d this year, after having fallen by
20Energy Outlook 2021 January 2021
around 10MMbbls/d in 2020. It appears we will have to wait until at least 2022 to reach
pre-Covid-19 demand levels once again.
Iranian supply risk
While demand is a big uncertainty for the market, another key downside risk for the
market is Iran. Following the outcome of the US election, it is looking more likely that the
US will return to the Iranian nuclear deal, and with that the potential for the removal of
sanctions. Such action could bring anywhere between 1.5-2MMbbls/d of supply back
onto the market. However, the big unknown is around timing, as it's not clear how high
Iran is on Biden’s priority list. If we were to see a fairly quick return of Iranian supply over
1H21, this could put some pressure on the market, with the market likely finding it
difficult to absorb additional barrels. However, if we only see Iranian supply starting to
come back in the latter part of next year, the market should be able to digest this oil
more easily, given expectations of demand continuing to recover as we move through
the year.
Stronger prices through the year
We expect that the oil market will draw down inventories throughout 2021, as demand
continues to make a recovery. The key risk was around 1Q21, but OPEC+ have addressed
this with its recently revised deal. We forecast that ICE Brent will average US$55/bbl over
2021 and likely end 2021 in the region of US$60/bbl. This view is dependent on a vaccine
allowing demand to continue to recover, along with the OPEC+ deal holding through the
whole of 2021.
ING oil forecasts
1Q21 2Q21 3Q21 4Q21 FY21
ICE Brent (US$/bbl) 48 55 58 60 55
NYMEX WTI (US$/bbl) 46 53 56 58 53
Source: ING estimates
21Energy Outlook 2021 January 2021
Disclaimer
This publication has been prepared by the Economic and Financial Analysis Division of ING Bank N.V. (“ING”) solely for
information purposes without regard to any particular user's investment objectives, financial situation, or means. ING forms
part of ING Group (being for this purpose ING Group N.V. and its subsidiary and affiliated companies). The information in the
publication is not an investment recommendation and it is not investment, legal or tax advice or an offer or solicitation to
purchase or sell any financial instrument. Reasonable care has been taken to ensure that this publication is not untrue or
misleading when published, but ING does not represent that it is accurate or complete. ING does not accept any liability for
any direct, indirect or consequential loss arising from any use of this publication. Unless otherwise stated, any views,
forecasts, or estimates are solely those of the author(s), as of the date of the publication and are subject to change without
notice.
The distribution of this publication may be restricted by law or regulation in different jurisdictions and persons into whose
possession this publication comes should inform themselves about, and observe, such restrictions.
Copyright and database rights protection exists in this report and it may not be reproduced, distributed or published by any
person for any purpose without the prior express consent of ING. All rights are reserved. ING Bank N.V. is authorised by the
Dutch Central Bank and supervised by the European Central Bank (ECB), the Dutch Central Bank (DNB) and the Dutch
Authority for the Financial Markets (AFM). ING Bank N.V. is incorporated in the Netherlands (Trade Register no. 33031431
Amsterdam). In the United Kingdom this information is approved and/or communicated by ING Bank N.V., London Branch.
ING Bank N.V., London Branch is subject to limited regulation by the Financial Conduct Authority (FCA). ING Bank N.V., London
branch is registered in England (Registration number BR000341) at 8-10 Moorgate, London EC2 6DA. For US Investors: Any
person wishing to discuss this report or effect transactions in any security discussed herein should contact ING Financial
Markets LLC, which is a member of the NYSE, FINRA and SIPC and part of ING, and which has accepted responsibility for the
distribution of this report in the United States under applicable requirements.
Additional information is available on request. For more information about ING Group, please visit https://www.ing.com.
22You can also read