Center für Flexible Elektrische Netze FEN - Gleichstromversorgung im Niederund Mittelspannungsnetz - VDE Thüringen
←
→
Page content transcription
If your browser does not render page correctly, please read the page content below
Gleichstromversorgung im Nieder- und Mittelspannungsnetz
 Center für Flexible Elektrische Netze FEN
Wo macht was Sinn?

VDE Thüringen

 Prof. Dr. ir. Dr. h.c. R. W. De Doncker
 12.11.2020
Outline

■ Introduction – RWTH Aachen University
 □ E.ON ERC
 □ ISEA and PGS
 □ Research CAMPUS Flexible Electrical Networks

■ Background – Energy Transition and Flexible Grids
 □ Renewables and decentralized power generation impact grid structures
 □ Flexible DC Distribution grids and sector coupling
 □ eMobility impact on distribution grids

■ Conclusions
 □ Use cases where DC technology makes a lot of sense
 □ DC technology never went away
 □ Standardization activities
 □ Urgency to drive the DC (r)evolution
2

RWTH Aachen University

¡ Founded in 1870; one of the largest technical
 universities in Europe
¡ 157 degree courses
 – 45,377 students (57% Engineering)

 – 7,165 graduates, 9,651 international students

¡ 9,264 employees
 – 547 professors (89 Junior Prof.)

 – 5,564 research associates

 – 2,786 non-scientific staff

 – 599 apprentices and interns

¡ 1.0 B€ Budget 2019
 – 500 M€ external project funds for R&D

¡ 4,833 Scientific Publications
¡ 25% of all Dr.-Ing. in Germany are from RWTH

E.ON ERC leads the RWTH CAMPUS Cluster Sustainable Energy
to accelerate innovation with industry partners

 4
Production of
 Project space for SMEs
Prototype EVs

Research and
 Training
Development
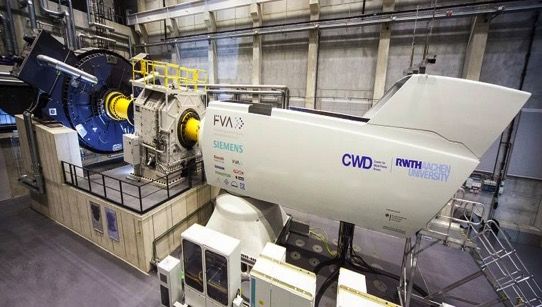
I3 Research Center for Wind Power Drives

 CWD – Center for Wind Power Drives
 4 MW test bench for mechanical and electrical research and
 characterization of wind turbines

 Prof. Abel

 Prof. Brecher

 Prof. De Doncker

 Prof. Hameyer

 Prof. Jacobs

 Prof. Monti

 Prof. Schröder
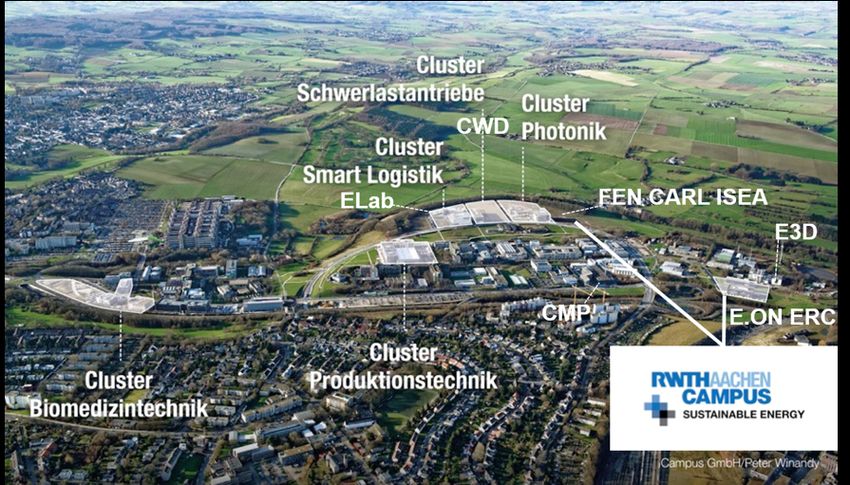
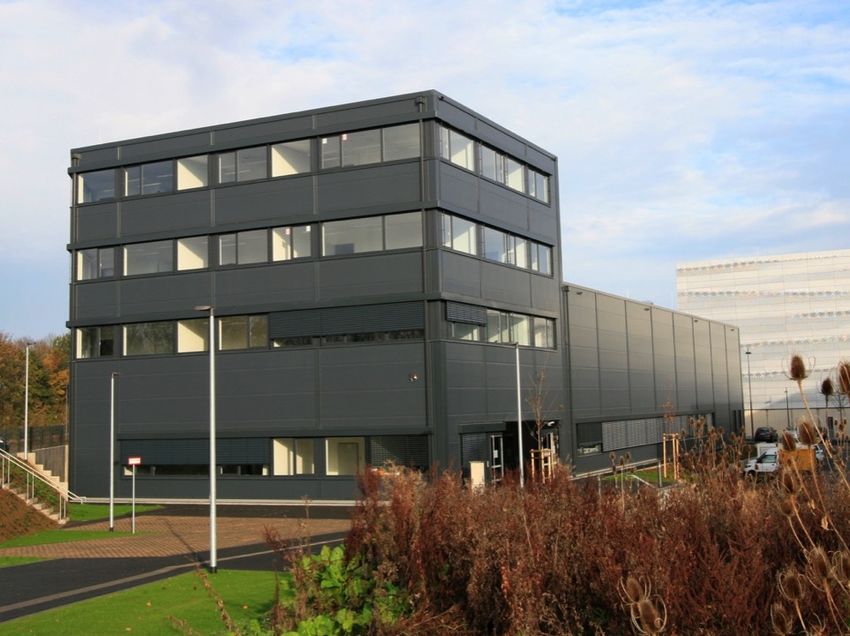
CARL
 Center–forCenter for Aging,
 Aging Reliability Reliability
 and Life and Life
 Cycle Prediction Cycle
 of Electrochemical and
 Power Electronic Systems in Aufbau (Nov. 2021).
Prediction of Electrochemical and Power Electronic
Systems

 Geplantes FEN Gebäude

 7
E.ON ERC at RWTH Aachen University
Energy savings, energy efficiency and sustainable energy supply in the
urban environment
Two chairs – two institutes ISEA and PGS

 Chair for Power
 Electronics and
 Electrical Drives Power electronics and Power electronics and
 – LEA/PED drives systems with a drives systems with a voltage
 voltage < 1000 V > 1000 V

 Prof. De Doncker
 Chair for
 Electrochemical Energy
 Mobile energy storage Stationary energy storage
 Conversion and
 systems systems
 Storage Systems
 – ESS
 Prof. Sauer

 9
Research areas and staff at ISEA and PGS
 Univ.-Prof. Dr. ir. Dr. h. c. Rik De Doncker
 Power Electronics
 Electrical Drives
 Electronic Devices, Switched Mode Power Supplies

 Univ.-Prof. Dr. rer. nat. Dirk Uwe Sauer
 Electrochemical Energy Conversion and
 Storage Systems
 Student projects

 Univ.-Prof. Dr. rer. nat. Egbert Figgemeier
 Ageing Processes and Lifetime Prediction of
 Batteries (Helmholtz - FZJ)

 14 Chief Engineers
 1 Adjunct Professor, 2 Lecturers
 Scientific staff
 102 Research Associates
 ca. 90 Student Co-Workers
 ca. 150 Graduate Students per Year
 30 Permanent Staff
 9 Apprentices

10
Power Electronics and Drives Division

 Device & Component
 Modeling Demonstrator System
 Component & Converter
 & Control Development Integration
 Analysis Design

 3.5
 Output capacitors
 Input capacitors
 3 IGBTs (switching losses)
 IGBTs (conduction losses)
 Diodes (reverse recovery)
 2.5 Diodes (conduction losses)
 Dissipated Power / kW

 Winding inductor
 Core inductor
 2 Core Transformer
 Winding Transformer

 1.5

 1

 0.5

 0
 10 20 30 40 50 60 70 80 90
 Output Power / kW

11
PGS|E.ONERC - Electrochemical Storage Systems Division

 Modeling &
 Battery Laboratory System Monitoring &
 Lifetime
 Testing Analysis Integration Management
 Prediction

 -2.0

 -1.5 1 kHz 10 Hz 0.1 Hz 0.01 Hz
 100 Hz 1 Hz
 Im(Z) / mW

 -1.0

 -0.5

 0.0

 0.5
 0.5 1.0 1.5 2.0 2.5 3.0 3.5
 Re(Z) / mW
 ZARC 1 ZARC 2

 RSEI Rct
 L Rser ZW
 CSEI Cdl

12
High Power Electronics and Drives (PGS)

 Device & Component
 Modelling Demonstrator System
 Component & Converter
 & Control Development Integration
 Analysis Design

13
System Integration
MVDC Collector Grid for Offshore Wind Farms

 Classical topology Future topology

■ Increased efficiency ■ Reduced costs
 ≡ 2% higher compared ≡ Smaller off-shore
 to AC systems platforms
 ≡ Simple more reliable ≡ Reduced LCC
 wind turbines ≡ Reduced installation, transportation
■ Smaller and lighter transformers and investment cost
 ≡ Weight reduced to 30 % ≡ Improved reliability

14
Key Enabling Component for DC Intelligent Substations
Dual Active Bridge DC-DC Converter

DC Solid-State Transformer Initially Invented for Space Station
■ Bidirectional dc-dc conversion
■ Galvanic isolation with medium-to-high
 frequency transformer
■ High step-up/down ratio possible
■ Buck and boost operation
■ Inherent zero-voltage switching capability
■ Simple control of power flow similar to
 a synchronous machine connected to ac grid
■ So many variants
 First-order harmonic model
 ≡ Single-phase
 ≡ Three-phase
 ≡ Multi-level
 ≡ Multi-port
 ≡ Resonant

15
Three-Phase Dual-Active-Bridge Converter in Block-mode Operation

 Dual-Active-Bridge-DC-DC-Converter with IGBTs Equivalent circuit diagram with voltage sources

 First-order harmonic model

16
Three-Phase Dual-Active-Bridge Converter in Block-mode Operation

 d 1
 = ⋅ ⇔ = ∫ d mit = !" + $#"
 d Waveforms of Dual Active Bridge

17
Three-Phase Dual-Active-Bridge Converter in Block-mode Operation

 &

 '

 (
 !

 ′"
 ⃗!

 ! = !" + j !#

 $% = $" + j $#
 ⃗! = !" + j !#

18
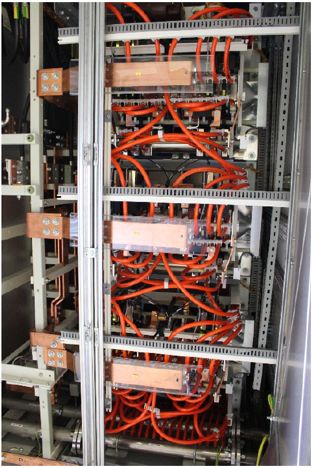
Demonstrator Development
E.ON gGmbH High Power DC-DC Converter

■ P = 7 MW, VDC = 5 kV ±10 %
■ Efficiency up to 99.2 %
■ Calculation based on synthetic tests:
 ≡ Measured losses of semiconductor switches
 ≡ Measured transformer losses (300 kVA)
■ Ultimately air-cooled devices are an option
 R. Lenke, Doctoral Thesis, A Contribution to the Design of Isolated DC-
 DC Converters for Utility Applications, 2012, PGS

N. Soltau, H. Stagge, R. W. De Doncker and O. Apeldoorn, "Development and demonstration of a
medium-voltage high-power DC-DC converter for DC distribution systems," 2014 IEEE 5th Int.
Symposium on Power Electronics for Distributed Generation Systems (PEDG), Galway, 2014

19
Center für Flexible
 Forschungscampus
 Elektrische Netze FEN
 Flexible Elektrische Netze FEN
Partners of FEN Research Campus accelerate Innovation

 Status: Oktober 2020
 Flexible Electrical Networks
 (FEN) Research Campus

 Commercial Partners

 Scientific Partners
 ACS FCN
 PGS EBC
 GGE

 Under Negotiation

 21
FEN Fachbereiche

 Prof. Albert Moser (IAEW, RWTH)
 Robert Heiliger (E.ON)

 Prof. Rik W. De Doncker (PGS, RWTH)
 Netze & Dr. Peter Friedrichs (Infineon)
 Systeme

 Prof. Antonello Monti (ACS, RWTH)
 Jörgen von Bodenhausen (Eaton)
 Komponenten

 Prof. Eva-Maria Jakobs (HCIC, RWTH) Sozio-
 Dr. Jochen von Bloh (AixControl) ökonomische Digitalisierung
 Forschung

 Prof. Stephan Rupp (Maschinenfabrik Reinhausen) Technologieforschung
 Standardi-
 Dr. Peter Lürkens (PGS, RWTH) sierung Sozio-ökonomische
 Forschung,
 Standardisierung

§ Integrieren und koordinieren technische, soziale und ökonomische Perspektiven
§ Sind paritätisch besetzt
§ Die Leitungen der Fachbereiche bilden den FEN-Vorstand

 22
Motivation

§ Verteilung der elektrischen Energie wird eine entscheidende Aufgabe.

§ Aktuell 40% regenerativer Anteil im deutschen Stromsektor*1)
§ Bis 2024 weltweites Wachstum der erneuerbaren Energien um 50% *2)
§ Verkehrswende durch e-Mobilität mit 1 Mio. Ladepunkten in Deutschland bis
 2030*3)

 Die Energiewende findet in den Verteilnetzen statt!

*1) EEG v. 01.04.2000 nach dem „Aachener Modell“; „Erneuerbare Energie in Zahlen“, BMU 23.10.2019
*2) International Energy Agency 2019 23
*3) Bundesregierung 05.11.2019
FEN Medium-voltage (5 kV) DC CAMPUS grid

 Rated current of
 power cables Icabel 680 A

 1.07 kV

 ≈ 300 m
 ca. 1.6 MVA
 ≈ 900 m
 Icabel Icabel

 +2.5 kV Icabel
5 kV 5 kV
 -2.5 kV IN

 Icabel
 ca. 3.5 MVA ≈1.3 km ca. 2.5 MVA

 M. Stieneker, J. Butz, S. Rabiee, H. Stagge and R. W. D. Doncker, "Medium-Voltage DC Research Grid Aachen," International ETG Congress 2015; Die
 Energiewende - Blueprints for the new energy age; Proceedings of, Bonn, Germany, 2015, pp. 1-7.

 24
FEN-MVDC- Grid at RWTH Campus Melaten
Official start operation 5 kV MVDC-Grid 19.11.2019

 25
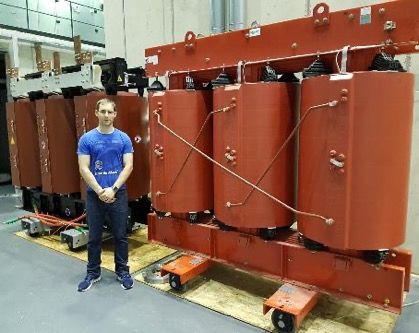
DC Transition
Higher Efficiency, Saving Materials, Digital, Flexible, but also more Ecological!

 4,5 MVA, 50 Hz Transformator 5,0 MVA, 1.000 Hz Transformator
 11.500 kg (2,5 kg/kVA) 675 kg (0,14 kg/kVA)

 Solid State DC transformers reduce significantly our CO2-foot print
 Estimated Transformer use; AC@50 Hz >25,000 ton/GVA, DC@1 kHz Grid < 1,500 ton/GW

 26
150 kW Multiport DC/DC Converter

§ Coupling of MV to LV DC grids
§ 150 kW
§ SiC MOSFETs
§ Sophisticated dynamic control for
 stable operation

 10 kV SiC MOSFETs and drivers of the
 medium-voltage port

 27
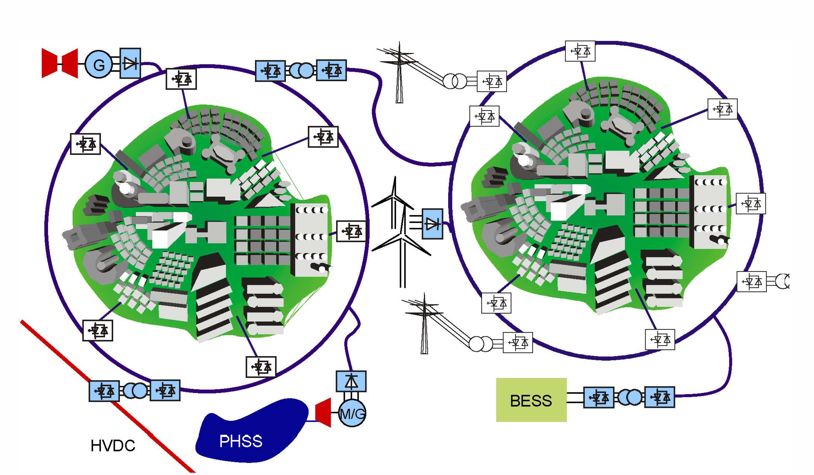
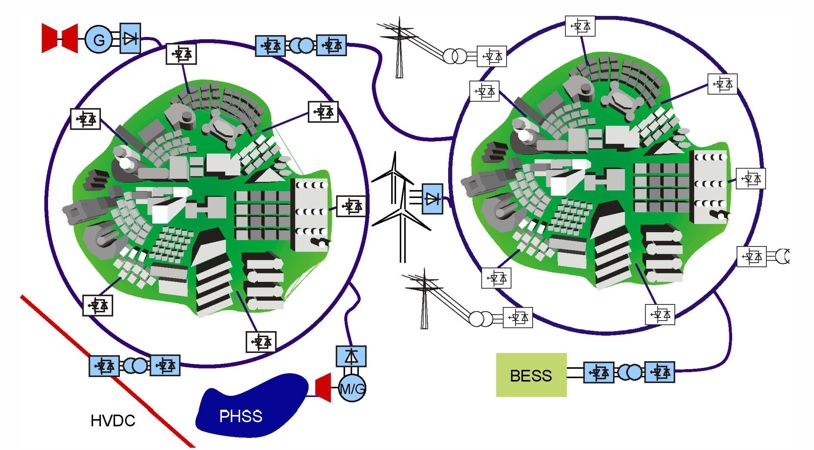
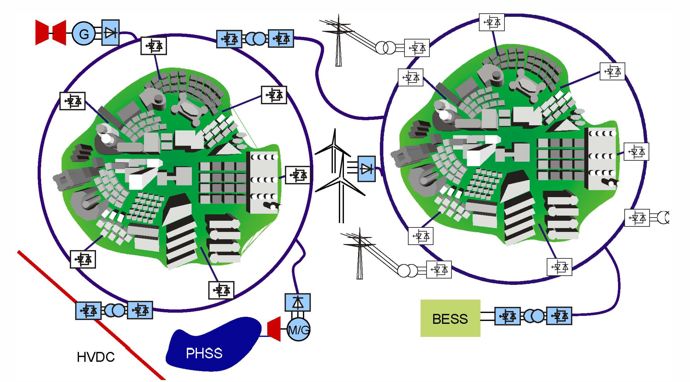
Flexible Grids for Decentralized Power Generation
Cellular Grid Topologies, Sector Coupling and DC Intelligent Substations

 MVDC-MVDC
 LVDC-MVDC
 LVDC-MVDC

 LVDC-MVDC

 HVDC-MVDC
 LVDC-MVDC
 © R.W . De Doncker, J. von Bloh

 28
Technological Vision on DC Intelligent Substations

 LVDC-MVDC MVDC-MVDC MVDC-HVDC

 § IPOS DAB converter § IPOS DAB converter § MMC + DAB
 § Modular, scalable § Multi-level topology or § Insulation requirement for
 § IGBT, SiC Mosfet device series connection IPOS tranformer is too high
 § IGBT, IGCT § Multi-level topology or
 device series connection
 on MV side
 29
 § IGBT, IGCT

 29
MVDC-HVDC Converters – Combining MMC and DAB
Comparison with State-of-the-Art Solution - ±25 kV / ±200 kV, 400 MW System

 MMC-FTF Converter (Conventional) TLC-MMC Converter (Proposed)
Converter on HV side Identical Identical
Semiconductors on the HV side 2400× 4.5 kV, 1.2 kA IGBTs 2400× 4.5 kV, 1.2 kA IGBTs
Number of converters on MV side 8 2
Semiconductors on the MV side 2400× 4.5 kV, 1.2 kA IGBTs 300× 4.5 kV, 1.4 kA IGCTs
Capacitive energy on the MV side 3.28 MJ 49 kJ (1.5 % of the conv.)

 -30% -39%
 -29% -36%

 S. Cui, PhD thesis, “Modular multilevel DC-DC converters interconnecting high-voltage and medium-voltage DC grids”, Dissertation, RWTH Aachen University,
 2019, DOI: 10.18154/RWTH-2019-05892

 S. Cui, N. Soltau and R. W. De Doncker, "Dynamic performance and fault-tolerant capability of a TLC-MMC hybrid DC-DC converter for interconnection of MVDC
 and HVDC grids," 2017 IEEE Energy Conversion Congress and Exposition (ECCE), Cincinnati, OH, 2017, pp. 1622-1628, doi: 10.1109/ECCE.2017.8095986.

 30
Outline

■ Introduction – RWTH Aachen University
 □ E.ON ERC
 □ ISEA and PGS
 □ Research CAMPUS Flexible Electrical Networks

■ Background – Energy Transition and Flexible Grids
 □ Renewables and decentralized power generation impact grid structures
 □ Flexible DC Distribution grids and sector coupling
 □ eMobility impact on distribution grids

■ Conclusions
 □ Use cases where DC technology makes a lot of sense
 □ DC technology never went away
 □ Standardization
 □ Urgency to drive the DC (r)evolution
31
Background
Energy market mechanisms that enabled more decentralized power production

Market changes that were introduced stepwise (EU):

 1. Market liberalization allowed decentralized power generation, creating
 prosumers, typically small scale power generation (CHP) and REN sources
 (mostly volatile sources, such as PV and wind)

 2. CO2 certificates, Emission Regulations

 3. Unbundling of power generation and grid operation

 4. Unbundling of TSO and DSO

Engineering challenges:

 Need to find technical solutions that are socially and economically viable
 within these new markets and regulations

 32
Global installed capacity of wind

 Source: PowerWeb

 720 GWpeak installed capacity by the end of 2020 – assuming 50% DFG,
 this translates in approximately 1,080 GVA of power electronic converters

 Multi-megawatt power electronic converters are becoming a mass product.
 During the past 25 years a major cost reduction of voltage source inverters
 took place; from 500 €/kVA down to 20 €/kVA

 33
Global installed capacity of PV is accelerating

 Source: PowerWeb

 • 789 GWpeak of PV installed by 2020

 • About 870 GVA of PV (string and central)
 inverters are installed by 2020

 • LCE of PV in some countries is lower
 than that of wind or coal power plants

 34
Price of silicon cells and power electronics inter-twined?

 50
 Netztransformator
 Hz Transformer Wechselrichter
 3-phase Inverter
 100,0

 80,0

 €/kVA
 60,0

 40,0

 20,0
 In 2018
 $ 0.113 0,0
 Jan. 04 Mär. 06 Jun. 08 Aug. 10 Okt. 12 Dez. 14 Mär. 17 Mai. 19

 Silicon is made of SiO2 (i.e. sand, an abundant material) and energy
 Energy is produced by PV
 PV energy is controlled and converted by power electronics made of silicon

 35
Driving Factor
Power electronic inverters are progressively having lower costs than 50 Hz transformers

 50
 Netztransformator
 Hz Transformer Wechselrichter
 3-phase Inverter
 100,0

 80,0

 €/kVA
 60,0

 40,0

 20,0

 0,0
 Jan. 04 Mär. 06 Jun. 08 Aug. 10 Okt. 12 Dez. 14 Mär. 17 Mai. 19

 Estimated cost for 2020

 36
 Automotive inverter 3 €/kVA
 DC Solid-State Transformer 9 €/kVA

 36
Renewable Energy Supplies can Cover all Electricity Needs
(example Germany)

 Hamburg
 Bremen

 Berlin

 Area for Area for
 100% PV 100% Wind

 Köln
 K

 Landfläche BRD: 357.186 km2
 QuelleDWD: 1050 kWh/m2.a à 15% Wirkungsgrad à157 GWh/km2.a
 Quelle BMWi: Bruttostromerzeugung 2015: 627,8 TWh,
 eq. PV-Fläche 3993 km2 (1,1%, ca, 63 km x 63 km)

 Quelle: BWE Studie Potenzial
 München Windenergienutzung an Land (Kurzfassung)
 (2% f. 390 TWh)

 37
Fall and Winter – mostly Wind Energy
Massive Power transfer needed from South to North – Overlay HVDC

 Hamburg
 Bremen

 Berlin

 Köln

 München

 38
Spring and Summer – mostly PV
Massive Power transfer needed from South to North – Overlay HVDC

 Hamburg
 Bremen

 Berlin

 Köln

 München

 39
Distributed Installation of REN - Underlay Grid
Exchange of energy via cellular, interconnected medium-voltage distribution grid

 Underlay
 distribution grid Hamburg
 is an interesting Bremen
 business
 proposition from Berlin

 DSO
 perspective
 Köln

 München

 40
Urban Regional, Flexible, Multi-terminal MVDC Distribution Grid

 © R.W. De Doncker, J. von Bloh

 41
Concepts for a CO2-neutral Energy Supply System
Digitalization and Electrification linking Sectors to make the transition economically viable

 HVDC transmission Large scale
 use of
 renewables,
 i.e. hydro,
 wind and PV
 as primary
 MVDC distribution energy
 sources.
 Sources are
 far distance
 LVDC distribution and local in
 buildings, city
 quarters.

 42
Concepts for a CO2-neutral Energy Supply System
Digitalization and Electrification linking Sectors to make the transition economically viable

 Linking e-grid
 to heat sector
 for short term
 and seasonal
 energy
 storage.

 Small scale
 CHP power
 back-up
 sources.

 Heat pumps
 for full
 electrification
 of HVAC of
 buildings.

 43
Concepts for a CO2-neutral Energy Supply System
Digitalization and Electrification linking Sectors to make the transition economically viable

 Linking e-grid
 to e-Mobility
 sector.

 Providing DMS
 and short term
 grid stability.

 Full
 electrification
 of mobility in
 the urban
 environment

 44
Concepts for a CO2-neutral Energy Supply System
Digitalization and Electrification linking Sectors to make the transition economically viable

 Linking e-grid
 and heat grid
 with
 electrolysers
 to gas and
 synthetic fuels
 sector for long
 term strategic
 energy
 storage.

 Reuse of
 existing
 infrastructure

 45
Concepts for a CO2-neutral Energy Supply System
Digitalization and Electrification linking Sectors to make the transition economically viable

 Digital

 Virtual Storage
 Systems

 Virtual power
 plant

 Home appliances gateway

 E-mobility gateway

 46
Concepts for a CO2-neutral Energy Supply System
Digitalization and Electrification linking Sectors to make the transition economically viable

 Digital

 Virtual Storage
 Systems
 PEBB PEBB
 PEBB

 PEBB

 Virtual power
 PEBB plant
 PEBB

 PEBB PEBB

 PEBB Home appliances gateway

 PEBB PEBB
 E-mobility gateway

 47
RWTH Centers, JARA Institutes with Fraunhofer have all expertise needed to build a
sustainable energy system

 Digital

 IAEW
 Virtual Storage
 Systems
 PEBB PEBB
 PEBB
 FZJ
 CWD
 KESS Fraunhofer
 PEBB
 FEN Digital
 Energy
 Virtual power
 PEBB plant
 PEBB

 PEBB PEBB

 E.ON
 PEBB ERC ISEA
 Home appliances gateway

 PEBB PEBB ELAB
 CMPE-mobility gateway
 e3D

 48
Electrical Grids for a CO2 Neutral Electrical Energy Supply System
About 1/3 in HV, 1/3 in MV, 1/3 in Low-Voltage Distribution Grid

 Interesting
 observation:
 The transmission
 grid requires just
 minimal
 extension with
 HVDC.
 ETG Task Force
 expects less cost
 for DC
 integration in
 infrastructure.
 The MV
 distribution grid
 will become
 bottleneck.

 49
The “1/3 rule” already applies to the German installed capacities
What are requirements for massive charging and fast charging EVs?

 Conventional power sources Bi-directional, interconnected grid structure Renewable power sources

 Offshore-
 Central power
 54,2 GW 3,4 GW
 wind parks
 stations High voltage
 22,2 GW
 from 100 kV 25,6 GW
 Industrial power Large solar and
 plants wind parks

 Municipal power 4,5 GW 40,7 GW Solar and
 Medium voltage wind parks
 plants

 … ? GW

 - 23,2 GW PV-systems in local
 Local distribution Low voltage Distribution grids
 grids
 Daten: Bundesnetzagentur - Daten und Informationen zum
 EEG (31.12.2015) , Kraftwerksliste und Zahlen
 (5 GW not associated) (10.06.2016, Status 2015)

 Future grids cannot ignore the energy feed-in in medium- and low-voltage distribution grids
 and e-Mobility and must become interconnected

 50
Additional installed capacity of 100% e-Mobility is huge

 Conventional power sources Bi-directional, interconnected grid structure Renewable power sources

 Offshore-
 Central power
 54,2 GW 3,4 GW
 wind parks
 stations High voltage
 22,2 GW
 from 100 kV 25,6 GW
 Industrial power Large solar and
 plants wind parks

 Municipal power 4,5 GW 40,7 GW Solar and
 Medium voltage wind parks
 plants
 2.4/1800 GW

 - 23,2 GW PV-systems in local
 Local distribution Low voltage Distribution grids
 grids
 Daten: Bundesnetzagentur - Daten und Informationen zum
 EEG (31.12.2015) , Kraftwerksliste und Zahlen
 (5 GW not associated) (10.06.2016, Status 2015)

 Future grids cannot ignore the energy feed-in in medium- and low-voltage distribution grids
 and e-Mobility and must become interconnected

 51
Technology Drivers - Price Development of Power
Electronics

■ Specific cost for drive inverters
 □ 1995: $50/kVA1
 □ 2015: $5/kVA2
 □ 2020 R&D target: $3.3/kVA

 8
 7
 cost in $/kW

 6
 5
 4
 3
 2010 2012 2014 2016 2018 2020
 year
 1 Source: Data provided by R. De Doncker, based on DOE projects
 2 Source: U.S. Department of Energy, Vehicle Technologies Office

52
Modular drivetrain concepts
More integrated inverter & machine

■ Modular drive systems
■ Competing drivetrain concept:
 □ Optimization of individual components,
 i.e. Inverter and machine
 □ Full integration of inverter in machine

 Level of integration

 Smart stator tooth
 Tooth electronics

 Stator tooth

 Connection to
 Power electronic DC bus and capacitor
 module

[ISEA, e performance, 2012] [ISEA, e performance, 2012] [ISEA, eMoSys, 2014] [ISEA, EMiLE, 2016]

53
Technology Drivers - Price Development of Lithium-Ion
Batteries (only cells)

■ World-wide target for costs (€/kWh) for large-scale automotive LIB cells,
 published by the end of 2012

 Cost in €/kWh
 Source: „Technologie-
 Roadmap Energiespeicher
 South Korea (MKE)
 für die Elektromobilität 2030“

 Germany (BMBF/ISI)

ISEA forecast (2010):
Prices decreased faster
than predicted by NEDO

Consumer cell are even
cheaper (e.g. TESLA)

54
Example - eTron
Modular Electric Drive Train

55
E-Mobility is coming
Demand for Ultra Fast Charging is coming with it, regardless if it is realistic!

e performance developed at RWTH/ISEA - predecessor of the Audi Q6 , production
at AUDI Plant Brussels

• Demonstrator • Audi Q6 e-tron quattro
 - 280 kW - 370 kW (three motors)
 - 2x 115 kW ASM - Max. speed 210 km/h
 - 1x 50 kW PMSM - 95 kWh LiIon, 500 km driving range
 - 2 LiIon batteries - DC charging with 150 kW
 - 144 V and 216 V - 400 km in 30 min, 100 km in 8 min
 - 38,4 kWh

 56
Definition of Fast Charging

■ Definition from Elektromobilität NRW1
 □ Fast charging: P > 22 kW

■ Connectors are standardized in the EU
 www.cleantechnica.com
■ Charging voltage up to 400 Vac or 800 Vdc
 Household Normal Charging AC Fast-Charging DC Fast-Charging
 Installation Plug socket Wallbox/ Charge Power stick Power stick
 stick
 Socket SchuKo-socket Typ-2-socket Typ-2-socket Combo-2-socket

 Voltage AC 230 V AV 400 V AC 400 V DC < 800 V

 Power < 3.7 kW < 22 kW < 44 kW < 170 kW

 Charging Time (for > 10 h 1-5 h 30 min. < 30 min
 22 kWh battery)2
 2Linear assumption. In reality a 22 kWh ist charged within 90 min. by a
 1Source:
 charging power of 22 kW due to chemical issues www.elektromobilitaet.nrw.de

57
Number of public charging stations for electric vehicles in
2019

 Slow Charging Fast Charging

58
View of (French) OEMs and first Tier Suppliers
When is Ultra Fast Charging Infrastructure Required?

 120 kWh
 Battery capacity

 100 kWh
 80 kWh
 60 kWh 60 kWh
 40 kWh
 20 kWh Premium class vehicles need Standard class vehicle may
 ultra fast charging (>300 kW) not need charging power
 soon! higher than 200 kW

 2015 2017 2020 2022 2030
 Year
 Source: J.B. Moreau. „The EV charging market: present & future outlook“. APE Conference 2017. Paris

59
View of (French) OEMs and first Tier Suppliers
When is Ultra Fast Charging Infrastructure Required?

 Required charging
 power
 * Required power to charge up to 80% SOC within 15
 minutes. Constant power during charging process is
 assumed

 385 kW Majority of consumers accept 15 minutes of 120 kWh
 maximum charging time (study by ING Bank, July
 2017)

 320 kW 100 kWh
 80 kWh
 195 kW 60 kWh 60 kWh
 40 kWh
 20 kWh Premium class vehicles need Standard class vehicle may
 ultra fast charging (>300 kW) not need charging power
 soon! higher than 200 kW

 2015 2017 2020 2022 2030
 Year
 Source: J.B. Moreau. „The EV charging market: present & future outlook“. APE Conference 2017. Paris

60
Long-Distance driving using fast-charging with EV having 240
km range

§ Assumptions 200 1´ 10
 3

 - Minimum SOC 10% Fahrleistung
 Engine [kW]
 power [kW]

 - After fast charge SOC 80%

 kWh]
 Ladeleistung
 power [kW]

 [kW,[kWh]
 Charging [kW]
 Restenergie
 Residual energy[kWh]
 [kWh]
 - Charging power 100 kW 150
 Nennenergie
 Nominal [kWh]
 energy [kWh]
 750

 Ladezustand[kW],
 - Consumption Fahrstrecke
 Trip [km]
 distance [km]

 Distanz [km]
 16 kWh/ 100 km

 State-of-charge
 •
 100 500

 Trip distance [km]
 • At 100 km/h

 Leistung,
§ Result 50 250

 - Achieved distance after 8 hrs
 Power,
 • 700 km 0 0
 0 2 4 6 8
 - 3 Recharge stops Time [hrs]
 Zeit [h]

 A diesel car, with a 30 min break, can drive 750 km in 8 hours

 It is all in our mind and ultra fast charging (>100 kW) seems unnecessary

 61
100% E-Mobility is it a grid problem?
For example 100% E-Mobility in Germany
§ Net electricity consumption DE 2016 1): 525 TWh
§ Grid peak load 2016 2): 83.75 GW*)

§ 44.6 Mio. registered cars, with 38 km/car and day
§ Only 2% drive more than 100 km on a given day

§ 16 kWh/100 km (conservative driving Renault Zoe I)
 - Annual fleet energy consumption: 100 TWh, 19% of annual electrical energy
 - On-board storage 40 kWh/250 km: 1,78 TWh, 30 hrs of average grid load

§ Installed Charging Power
 - 44.6 Mill. Cars, 4…40 kW on-board charger: 180-1800 GW, 2.1x … 21x grid peak load
 - Average fleet power (day, 24 hrs): 11 GW, 13% of grid peak load
1) https://de.statista.com/statistik/daten/studie/164149/umfrage/netto-stromverbrauch-in-deutschland-seit-1999/
2) https://www.agora-energiewende.de/de/themen/-agothem-/Produkt/produkt/76/Agorameter/
3) http://www.kba.de/DE/Statistik/Kraftverkehr/VerkehrKilometer/verkehr_in_kilometern_node.html

 On-board storage sufficient for primary reserve and possibly day-night balance.
 The grid control power is distributed.

 62
Distribution Grid
Typical Urban AC Grid Structure

Branch A
 - 21 households, max. total power: 98 kW
 - Length: 461 m
Branch B
 - 34 households, max. total power : 129 kW
 - Length : 715 m
Branch C
 - 10 households, max. total power : 68 kW
 - Length : 185 m M. Stieneker and R. W. De Doncker,
Connection to transmission grid "Medium-voltage DC distribution grids in
 urban areas," 2016 IEEE 7th International
 - Max. total power : 250 kVA Symposium on Power Electronics for
 Distributed Generation Systems (PEDG),
 - Average apparent power per household 3,85 kVA Vancouver, 2016

 63
Distribution Grid – Challenge with 5 kW EV Chargers
Typical Urban Grid Structure with e-Mobility slow charging, 6 EVs

Branch A
 - 21 households, max. total power: 98 kW à 108 kW (2 veh.)
 - Length: 461 m
Branch B
 - 34 households, max. total power : 129 kW à 144 kW (3 veh.)
 - Length : 715 m
Branch C
 - 10 households, max. total power : 68 kW à 73 kW (1 veh.)
 - Length : 185 m M. Stieneker and R. W. De Doncker,
Connection to transmission grid "Medium-voltage DC distribution grids in
 urban areas," 2016 IEEE 7th International
 - Max. total power : 250 kVA à 325 kW (worst case) Symposium on Power Electronics for
 Distributed Generation Systems (PEDG),
 Vancouver, 2016

 64
Distribution Grid – Challenge with 5 kW EV Chargers
Typical Urban Grid Structure with e-Mobility slow charging, 12 EVs

Branch A
 - 21 households, max. total power: 98 kW à 118 kW (4 veh.)
 - Length: 461 m
Branch B
 - 34 households, max. total power : 129 kW à 159 kW (6 veh.)
 - Length : 715 m
Branch C
 - 10 households, max. total power : 68 kW à 78 kW (2 veh.)
 - Length : 185 m M. Stieneker and R. W. De Doncker,
Connection to transmission grid "Medium-voltage DC distribution grids in
 urban areas," 2016 IEEE 7th International
 - Max. total power : 250 kVA à 355 kW (worst case) Symposium on Power Electronics for
 Distributed Generation Systems (PEDG),
 Vancouver, 2016

 65
Distribution Grid – Major Problem with 150 kW EV Charging
Typical Urban Grid Structure with e-Mobility fast charging, 6 EVs

Branch A
 - 21 households, max. total power: 98 kW à 398 kW (2 veh.)
 - Length: 461 m
Branch B
 - 34 households, max. total power : 129 kW à 479 kW (3 veh.)
 - Length : 715 m
Branch C
 - 10 households, max. total power : 68 kW à 218 kW (1 veh.)
 - Length : 185 m M. Stieneker and R. W. De Doncker,
Connection to transmission grid "Medium-voltage DC distribution grids in
 urban areas," 2016 IEEE 7th International
 - Max. total power : 250 kVA à 1.1 MW (worst case) Symposium on Power Electronics for
 Distributed Generation Systems (PEDG),
 Vancouver, 2016

 66
Low voltage distribution grid cannot reliably support
 e-Vehicles at higher power (40 kW, Segment “B”)

 450
 129 kW, evening 300 450 -109 kW, day 300
 110% 110%
 [V]

 Spannung [V]
 Voltage [V]

 400 200 400 Voltage distribution 200

 Strom [A]

 [A]
 Strom [A]
 Line current
Spannung

 Current
 Load current
 90% 90%
 350 100 350 Feed-in current 100

 300 0 300 0
 0 200 400 600 0 200 400 600

 450 +Entfernung
 2 e-Vehicles
 [m]
 300 450 +Entfernung
 2 e-Vehicles
 [m] 300
 110% 110%

 Under-

 Spannung [V]
 [V]

 voltage

 [A]
 Voltage [V]

 400 200 400 200

 Strom [A]
 Strom [A]
Spannung

 Current
 90% 90%
 350 100 350 100
 Chargers

 300 0 300 0
 0 200 400 600 0 200 400 600

 Distance [m][m]
 Entfernung Entfernung[m]
 Distance [m]

 67
Classical Distribution Grids are radial
Integration of decentralized supplies. renewables, storage and e-Mobility is difficult

 HV
 50% 50%

 MV MV

 25% 25% 25% 25%

 LV LV LV LV

 3~
 ~ =

 68
Classical Distribution Grids are radial and massively oversized
Integration of decentralized supplies. renewables, storage and e-Mobility is difficult

 HV
 100 %

 MV MV

 25% 25% 25% 25%

 LV LV LV LV

 3~
 ~ =

 69
Hybrid Approach to Maximize Capacity of Distribution Grids
Integration of e-Mobility, PV, Wind, Storage … by MVDC-Backbone

 HV
 100% 100%

 MV MV

 25% 3~ MVDC 3~ 25%
 = = = =
 25% 25%
 50 % 50 %
 LV LV LV LV

 MVDC MVDC

 = = = = = = = =
 = = = = = = = =
 3xFCS 3xFCS

 70
Hybrid Approach to Maximize Capacity of Distribution Grids
Integration of e-Mobility, PV, Wind, Storage … by MVDC-Backbone

 HV
 100% 100%

 MV MV

 25% 3~ MVDC 3~ 25%
 = = = =
 25% 25%
 50 % 50 %
 LV LV LV LV

 MVDC MVDC

 = = = = = = = =
 = = = = = = = =
 N x (F)CS N x (F)CS

 71
Outline

■ Introduction – RWTH Aachen University
 □ E.ON ERC
 □ ISEA and PGS
 □ Research CAMPUS Flexible Electrical Networks

■ Background – Energy Transition and Flexible Grids
 □ Renewables and decentralized power generation impact grid structures
 □ Flexible DC Distribution grids and sector coupling
 □ eMobility impact on distribution grids

■ Conclusions
 □ Use cases where DC technology makes a lot of sense
 □ DC technology never went away
 □ Standardization
 □ Urgency to drive the DC (r)evolution
72
FEN Innovation
Zellulare Netzstruktur und Sektorenkopplung

 © R.W. De Doncker, J. von Bloh

 73
Aus der Nische mittelfristig realistische Anwendungsszenarien

 Kommerzielle Gebäude

 © R.W. De Doncker, J. von Bloh

 74
Aus der Nische mittelfristig realistische Anwendungsszenarien

 Integration Speichersysteme

 © R.W. De Doncker, J. von Bloh

 75
Aus der Nische mittelfristig realistische Anwendungsszenarien

 DC-Ladeinfrastruktur

 © R.W. De Doncker, J. von Bloh

 76
Aus der Nische mittelfristig realistische Anwendungsszenarien

 Punkt-zu-Punkt

 © R.W. De Doncker, J. von Bloh

 77
Aus der Nische mittelfristig realistische Anwendungsszenarien

 Punkt-zu-Punkt
 Industrielle DC-Netze

 © R.W. De Doncker, J. von Bloh

 78
Aus der Nische mittelfristig realistische Anwendungsszenarien

 Punkt-zu-Punkt
 Industrielle DC-Netze

 Sammelnetze für
 PV & Windkraftanlagen

 © R.W. De Doncker, J. von Bloh

 79
Aus der Nische mittelfristig realistische Anwendungsszenarien

 DC-Stadtviertel
 und
 Regionale Netze

 © R.W. De Doncker, J. von Bloh

 80
Commercial DC Building and Factories

• Building infrastructure with DC
 - HVAC with heat pumps
 - Heat/cold storage
 - Lighting M

 - ICT
 =

 - Elevators/escalators
 - E-mobility parking lots (dual use of batteries)
 - Local generation and storage

• AC-branch for legacy devices

• Local hybrid AC/DC substation

 LVAC
 AC AC
 DC DC

 BAT
 DC
 DC
 DC
 DC LVDC
 MVDC
 Clipart: Openclipart.org
 Source: Forschungscampus FEN

 81
Fast-Charging Infrastructure
Dual Use of Railway and Light Rail Infrastructure

• Low utilization of large capacity railway infrastructure (12%)
• Existing capacities can be used for fast charging (85 GWh per day in Germany)
• Railway and light-rail grids are available in cities
 - Light rail typically 750 Vdc
 - Belgium, Spain, Italy, Russia use 3000 Vdc
 - France, NL use 1500 Vdc

 Source: Müller-Hellmann

 82
Fast-Charging Infrastructure linked to light-rail

• Research project „BOB“ (Solingen)
 - Double use of Trolley bus infrastructure
 - Catenary power used for charging of
 on-board batteries during operation
 - Possible electrification of lines without
 catenary
 - Integration of renewable energies
 - Services for feeding ac grid
 Source: Uni Wuppertal

• 4 GW (750 Vdc) installed capacity in German cities alone (VDV)
 - Average use is 12%
 - Each day about 85 GWh is available to charge EV
 - 1.4 million EVs with 60 kWh battery
 - 420 million km range (@20 kWh/100 km)

 83
Newly Approved Research Project – ALigN
Project Overview ALigN
§ High NOx emissions in the city of Aachen (49 µg/m3) and the surrounding area
 - Commercial vehicles cause 53,9 % (438 t) of the overall NOx emissions in Aachen (AC)
 à Electrification of fleets (and commuters) offers great potential to reduce NOx emissions
§ Main challenges of electrification
 - Grid stability and expansion of the grid
 - Hesitant user acceptance
§ Goals of ALigN
 - Implementation of 500 - 1000 charging points in AC
 - Implementation of intelligent fleet management,
 local monitoring and load management concepts
 - Development of demand-oriented charging concepts and business models
 - Optimization of stakeholder-specific communication and decision paths
 - Reducing grid constraints / enabling the grid
 • Development of intelligent load-management algorithms generalization of concepts
 • Implementation of Solid-State-Transformers (dc underlay grid) by real-time simulation
 • Implementation of energy storage elements

 84
Newly Approved Research Project – ALigN
Concept Overview ALigN

 85
Forschungscampus FEN in Standardisierung

§ VDE/DKE
 - Gleichspannung in der elektrischen Energieverteilung (2015-2019)
 • R.W. De Doncker, M. Stieneker (FEN-PGS-RWTH)
 • A. Moser, J. Priebe (FEN-IAEW-RWTH)
 - Normungsroadmap Gleichstrom im Niederspannungsbereich (2015-2019)
 • C. Loef/FEN-ISEA-RWTH
§ CIGRÉ
 - Working Group C6 SC 6.31
 • Medium voltage direct current (MVDC) grid feasibility study (2015-2019)
 • Technical Brochure TB793 (M. Stieneker/FEN-PGS-RWTH, P. Lürkens/FEN-PGS-RWTH)
 - Joint Working Group C6/B4.37 Medium Voltage DC Distribution Systems (since 2018)
 • In Arbeit (S. Rupp/MR, P. Luerkens/FEN-PGS-RWTH)
 - Working group B4.89
 • Condition Health Monitoring and predictive maintenance of HVDC Converter Stations
 • In Arbeit (P. Joebges/FEN-PGS-RWTH)
§ IEC/DKE
 - TS 8B-61
 • Guideline for the planning and design of the decentralized direct current distribution systems
 • C. Loef (FEN-ISEA-RWTH)
 • In Vorbereitung

 86
Normative Aspekte beim Übergang zum Gleichspannungsnetz

§ Ziel der Normung
 - Bereitstellung von Regeln zur interoperablen Funktion der Netzkomponenten
 - Sicherstellung der einwandfreien Funktion des Gleichstromnetzes
 - Sicherstellung des Personenschutzes

 https://de.wikipedia.org/wiki/Elektricit%C3%A4ts-Werke_Reichenhall
§ Historisches : Normung Wechselspannungsnetz

 - Erste WS-Generatoren ca. 1890
 • f = 62,5 Hz, 198 kW, 2 kV, Bad Reichenhall)

 - Standardisierung der Netzfrequenz in DE 50 Hz ca. 1930, in Summe ca. 40 Jahre !
 • 1930 Erste 220kV-Übertragungsleitung vom Montafon/AT zum Ruhrgebiet zur Stabilisierung der
 der 50 Hz-Dampfkraftwerke mit Wasserkraft aus Speichersee (Vermuntwerk)

 - In USA 60 Hz
 - Heutige Situation : Teilweise Übernahme/Anpassung der WS-Normen für GS-Netze

Christoph Loef

 87
Normative Aspekte beim Übergang zum Gleichspannungsnetz

Normierungs/Validierungsbedarfe Interaktion mit dem WS-Netz
 § Schutz vor Überlast § Schittstellendefinition
 - Selektivität der Schutzorgane - Galvanische Trennung
 - Kurzschlussbehandlung - Schutz/Erdungsmaßnahmen

 § Netzform Netzführung
 - Verwendbarkeit von Netzformen - Spannungsregelung DC-Netz
 - Potentialausgleich, Ausgleichs/Ableitströme - Kurzschlußmanagement

 § Personenschutz
 - Art der anwendbaren Schutzmaßnahmen
 - Netzform Vorgehensweise
 - Identifikation der Normen im Ac-Netz
 § Spannungsqualität - Validierung bzgl. Anwendung im DC-Netz
 - Spannungsbereiche, Nennspannungen - Identifikation von Normen, welche im
 - Spannungswelligkeiten, Spannungsspitzen DC-Netz obsolet sind
 - Störspannungen - Harmonisierung der Normungsvorschläge
 Emissionen (EMV), Immisionsfestigkeit (EMI) auf internationaler Ebene (IEC)

Christoph Loef

 88
Urgency to develop/demonstrate DC Intelligent Substations

§ Saving material resources using power electronics and higher frequencies in DC
 solid state transformers is needed to reach climate goals
 - Recycling
 - New technologies Copper Alliance,based on Global
 copper reserves are estimated at 830
 million tonnes (United States
 Geological Survey [USGS], 2019)
 https://copperalliance.org/about-
 copper/long-term-availability/

§ EU leading companies are selling key technologies as transition is too slow
§ Electrification
 89 of developing countries must be our goal for geopolitical stability
§ China State Grid is deploying soon this technology and is considering an
 “Electrical Silk Route” of more than +/- 1 MV.

 89
Xing.FENaachen.net

 Linkedin.FENaachen.net

 @FENaachen

Thank you for your attention.

Contact:

Prof. Rik W. De Doncker

 Image sources (banner)
Flexible Electrical Networks FEN Research Campus • Exterior view of building – ©FEN GmbH
 • Landscape with wind turbine – ©DDM Company
Campus-Boulevard 79 • DC-DC converter – ©E.ON ERC
52074 Aachen • Network – iStockphoto.com/studiovision
 • Aerial view – ©Peter Winandy
 • Energiewende – ©stockWERK/fotolia.com
Tel. : +49 241 80 224 71 •
 •
 Puzzle – ©vege/fotolia.com
 Power grid/Wind turbine/Solar plant –
info@FENaachen.net ©PhotographyByMK/fotolia.com
You can also read