Welcome to the world of Encavis - Interim Statement Q3/9M 2020 dominated by strong operating Cash Flow - Encavis AG, Interim Statement Q3/9M 2020 ...
←
→
Page content transcription
If your browser does not render page correctly, please read the page content below
Welcome to the world of Encavis –
Interim Statement Q3/9M 2020
dominated by strong operating Cash Flow
Encavis AG, Interim Statement Q3/9M 2020, Conference Call, November 16th, 2020
2

ENCAVIS: Improving efficiency and cost reduction through Economies of Scale and Economies of Scope

ENergy
Energy forms the basis of our
collective activity and work                                                              Encavis Technical
                                                                                             Services /

CApital
                                                                                            Stern Energy
                                               Encavis Asset
                                               Management
We invest capital to acquire
wind farms and solar parks
to generate attractive returns                                      ENCAVIS AG

VISion
We are working towards a future
with decentralised power generation
from wind power and solar energy
3

Highlights from July to November 2020

 1   ENCAVIS set a clear commitment to sustainability and responsible action            Share        Wind farms and
     and published first insights into its sustainability strategy on its homepage                    Solar parks
     at: www.encavis.com/en/sustainability/

 2   Warburg Research re-initiated active coverage of Encavis AG on Sep 7th
     with “BUY” recommendation and a target price of EUR 17.20

 3   HSBC Germany initiated active coverage of Encavis AG on Sep 28th                Encavis Asset
                                                                                     Management         Finance
     with “BUY” recommendation and a target price of EUR 21.00

 4   BlackRock increased their shareholdings in Encavis AG
     from 3.51% to 4.07% to 5.76%
4

Highlights from July to November 2020

 1   ENCAVIS expands its participation in its solar park portfolio in France            Share            Wind farms and
     and now owns 100% of all its French solar parks and 95% of all solar parks                           Solar parks
     in the portfolio

 2   Encavis Asset Management AG acquires additional wind farms in France
     for special fund 'Encavis Infrastructure Fund II’ as well as a floating solar
     park in The Netherlands
                                                                                     Encavis Asset

                                                                                                     v
                                                                                     Management             Finance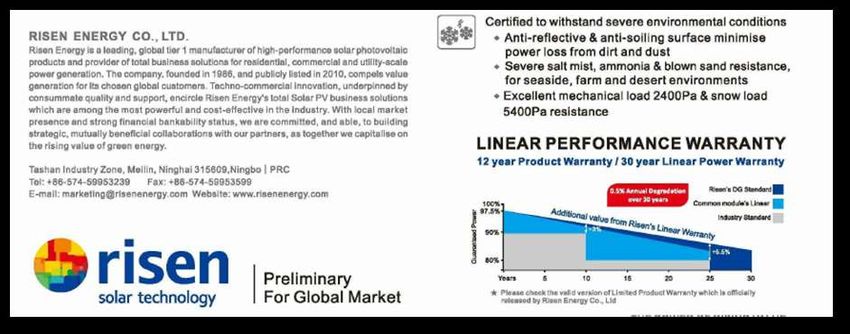
5

Highlights from July to November 2020

     ENCAVIS successfully secured a EUR 63.8 million non-recourse project      Share            Wind farms and
 1
     refinancing for a portfolio of 10 ground-mounted photovoltaic plants                        Solar parks
     located in Italy with a total capacity of 29.1 megawatts (MW)

     SCOPE Ratings affirms its investment grade issuer rating BBB- with
 2
     stable outlook on Encavis AG and Encavis Finance BV in an updated
     analysis in October 2020
                                                                            Encavis Asset

                                                                                            v
                                                                            Management             Finance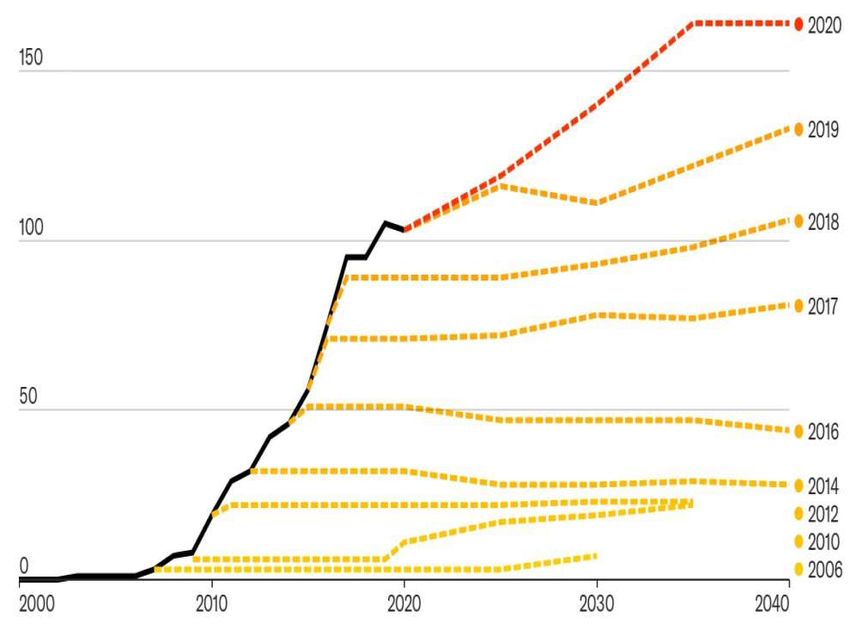
6
                                                                                                                La Cabrera

200 MW PV park “La Cabrera” is already connected to the grid

> The High Voltage section (substation and transmission line)   Required as per EPC contract
  is grid connected and energized since August 2020.
> The power plant is fully built up and achieved to start        Grid Connection                          Date for Completion
  partial operations on September 3rd, while all sections        08/18/2020                               10/20/2020
  were in operations since October 1st.                                            Planned Key Dates

> At the end of October the cumulated actual production
  of energy was approximately 30,000 MWh despite the fact
  that the plant was still in commissioning phase.                                 Date for Commissioning
                                                                                   08/25/2020
> First invoices of energy production for the months of
  September and October were sent to AWS amazon web
  service in Spain.
                                                                > PV plant is connected to the grid already.
                                                                > The agreed extra costs due to CoVid-19 are equal to
                                                                  TEUR 240 as of end of October.
7
                                                                                                             Talayuela

Construction of 300 MW PV park “Talayuela” well underway

> All components and materials are on site.                  Required as per EPC contract
> The whole HV section is finished off currently the cold
  commissioning activities are going on. The HV section is    Grid Connection                         Date for Completion
  expected to be grid connected by end of November 2020.      11/23/2020                              01/25/2021
                                                                                Planned Key Dates
> In the photovoltaic section:
   > 100% of the posts are installed,
   > 100% of the tracker are assembled,                                         Date for Commissioning
   > 97.3% of the modules are installed.                                        11/30/2020 (latest on 01/10/2021)
   The modules installation is expected to be finalized
   by end of November.                                       > Grid connection is expected to occur during second half
                                                               of December and the subsequent hot commissioning is
> The electrical works (installation of cables, inverters,
                                                               expected to start first week of January.
  transformers, switches, security system and SCADA)
  are expected to be completed by end of November.           > Expected delay due to CoVid-19 outbreak in the range of
                                                               four weeks.
                                                             > Agreed extra costs due to Covid pandemic in spring are
                                                               equal to TEUR 250.
8

Strong growing PPA markets – ENCAVIS is a European first mover in solar

                                                      Pillars of the Encavis
                                            Growth Strategy >> Fast Forward 2025

          Encavis has secured       Leveraging knowledge and          Strong Balance Sheet        Access to early stage
       preferred access to know-      network as experienced          with equity ratio > 24%    projects without taking
      how for PPA by establishing   investor based on recently           giving corporates      direct development risk
          a dedicated in-house            signed PPAs with               adequate comfort         by signing numerous
         competence team and         a leading European Utility        to handle risks from     partnership agreements
         by investing in market      and Amazon for in total of      long-term PPA contracts     with exclusive rights in
     leading competence platform     500 MW of Spanish solar                                       Italy, France, Spain,
             Pexapark (CH)                     parks                                                 The Netherlands,
                                                                                                Denmark and Germany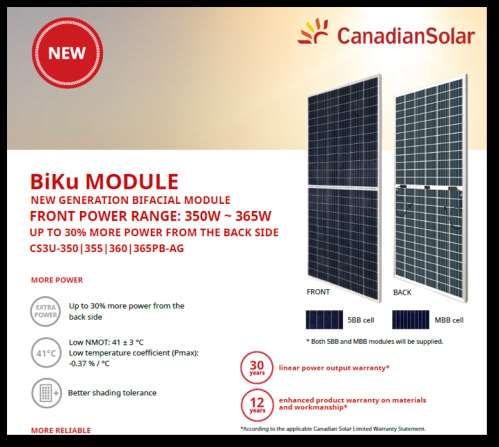
9

Again strong 9M 2020 in line with guidance besides some one-time effects from disposal of minorities,
meteorological effects and the virtual Stock Option Programme (SOP)

 Operating figures   Q1 2019     Q1 2020     Q2 2019         Q2 2020   Q3 2019   Q3 2020   9M 2019      9M 2020
  (in EUR million)

 Revenue                 59.5        65.2         84.5          89.6      79.5      79.5     223.4        234.3

 Oper. EBITDA            44.7        50.6         76.1          69.0      65.0      61.4     185.8        181.0

 Oper. EBIT              23.4        28.1         54.8          46.4      43.6      38.7     121.8        113.2

 Oper. Cashflow          15.9        50.8         60.5          64.4      56.4      51.4     132.8        166.6

 Oper. EPS (EUR)         0.05        0.08         0.25          0.19      0.19      0.15       0.49        0.42

   !    Detailed explanations on the following pages . . .
10

However, timing effects and the increase in the stock price reduced the improvement of key figures

Operating figures               9M 2019               9M 2020              Change
(in EUR million)                                                     6M 2020/2019

Revenue                             223.4                234.3                 +5%
Oper. EBITDA                        185.8                181.0                  -3%
Oper. EBIT                          121.8                113.2                  -7%
Oper. EPS in EUR                     0.49                 0.42                - 14 %
Oper. Cash Flow                     132.8                166.6                + 25 %

 > Positive meteorological effect after 9M 2019 of EUR 12.9 m compared to 9M 2020 of EUR 7.1 m (EUR -5.8 m)
 > Profit from disposal of participations after 9M 2019 of EUR 5.9 m comp. to 9M 2020 of EUR 1.9 m (EUR -4 m)
 > Provisions for the virtual Stock Option Programme for the Management due to strong stock price development:
   after 9M 2019 EUR -1.1 m compared to 9M 2020 EUR -4.0 m (EUR -2.9 m)
11

Significant revenue and cash flow increases after 9M 2020 vs. 9M 2019

Operating figures              9M 2019              9M 2020              Change
(in EUR million)                                                   9M 2020/2019

Revenue                           223.4                234.3                +5%
Oper. EBITDA                      185.8                181.0                 -3%
Oper. EBIT                        121.8                113.2                 -7%
Oper. EPS in EUR                    0.49                0.42               - 14 %
Oper. Cash Flow                   132.8                166.6              + 25 %

 > Enlarged portfolio due to newly acquired (Q4/2019) Danish wind farms (EUR +9.1 million)
 > Positive swing of Encavis Asset Management (EUR +8.7 million)
 > Planned payment of capital gain taxes (EUR 9 million) in Q1/2019 instead of Q4/2018 – Reimbursement from
   the tax office was expected during the year 2019 but happened in Q1/2020 (total effect: EUR +18 million)
12

9M 2020 vs 9M 2019 – adjusted for weather effects (wa)
Again significant positive weather effects after 9M 2020: EUR + 7.1 million (9M 2019: EUR + 12.9 million)

 Operating figures         9M 2019           Weather             9M 2020           Weather             Change
  (in EUR million)                           adjusted                              adjusted      9M 2020 (wa)/
                                         9M 2019 (wa)                          9M 2020 (wa)       9M 2019 (wa)

 Revenue                      223.4              210.5              234.3              227.2                +8%

 Oper. EBITDA                 185.8              172.9              181.0              173.9                +1%

 Oper. EBIT                    121.8             108.9              113.2              106.1                -3%

   !     Improved earnings development post weather adjustments
13
Higher SOP allocations (AM), not yet realised minority sale (wind) and less favourable weather effects (solar)
result in Q3 margin decreases
Operating Solar Parks Wind Parks Technical Asset HQ
P&L Services (PV) Management
(in EUR
million)
9M‘19 9M‘20 9M’19 9M‘20 9M‘19 9M‘20 9M‘19 9M‘20 9M‘19 9M‘20
Revenue 174.9 172.2 44.1 55.6 3.5 3.5 5.4 6.3 - -
EBITDA 151.1 143.7 38.2 40.8 1.1 3.1 1.6 0.8 - 6.2 - 7.4
EBITDA
86% 83% 86% 73% 31% 87% 29% 13% - -
margin
EBIT 104.5 96.0 22.1 21.5 1.0 3.1 1.1 0.4 - 6.9 - 7.9
EBIT margin 60% 56% 50% 39% 30% 87% 20% 6% - -
! Operating expenses distributed among Business Segments14
Weather adjusted operating results after 9M 2020 vs 9M 2019 by wind and solar
Operating Solar Parks Wind Parks
P&L
(weather
adjusted)
(in EUR million) 9M‘19 (wa) 9M‘20 (wa) Change 9M‘19 (wa) 9M‘20 (wa) Change
9M‘20 (wa) vs. 9M‘20 (wa) vs.
9M‘19 (wa) 9M‘19 (wa)
Revenue 159.8 163.1 +2% 46.3 57.6 + 24 %
Oper. EBITDA 136.0 134.6 - 1% 40.4 42.8 +6%
Oper. EBIT 89.4 86.9 - 3% 24.3 23.5 - 3%
Strong revenue growth in wind (due to acquired wind farms) & small revenue growth even in solar (due to
!
improved performance) but declining margins due to minority sales in 2019 & stock option programme15
Securing growth capital (2015 – 2020) while keeping a strong equity ratio
Financing measures implemented (in EUR million)
2020 35 10
2019 48 105 60
2018 50 28
2017 97 44
2016 49 20 25
2015 23
(small) Capital Increase Bilateral Debt, Bonded and "Green" Loans Hybrid Convertible Credit Lines16
ENCAVIS #1 among the top 50 Western European solar PV portfolio owners
is paving the way for attractive growth financing in the future
New ESG investors Investment grade issuer rating confirmed in 2020
First „Green Schuldscheindarlehen“ Encavis received Investment Grade issuer rating by
of EUR 50 million sucessfully placed in 2018 Scope Ratings (BBB-) initiated in 2019
Bond certified by Climate Bond Standard Rating reflects Encavis' risk-adjusted business model,
Executive Board regional diversification as well as the high proportion
of non-recourse financing
Encavis got a Primel-Label by ISS ESG (former ISS-oekom)
and an A-Level by MSCI ESG Ratings Strong creditworthiness revealed
Positive impact on financing conditions realized17
ENCAVIS Analysts’ Consensus on the five corporate KPIs for Q3/2020e and 9M/2020e as of Nov 11th, 2020
→ Average Analysts’ Consensus for Q3/2020 and for 9M/2020 in general in line with ENCAVIS’ results /
Operating EBITDA mainly burdened by higher expenses for the Stock Option Programme (SOP) as planned
Operating Cash Flow benefitted from growth in business
Analysts' Consensus Analysts' Consensus
Average Extrema Average Extrema
(in EUR ‘000) Q3 2019 Q3 2020 Q3 2020e Top Bottom 9M 2019 9M 2020 9M 2020e Top Bottom
Revenues 79,492 79,516 81,026 84,790 73,210 223,406 234,292 235,805 239,550 227,980
Oper. EBITDA 64,979 61,349 65,232 68,200 60,748 185,794 180,964 184,839 187,790 180,360
Oper. EBIT 43,613 38,633 42,505 44,960 38,218 121,781 113,168 117,025 119,460 112,753
Oper. Cash Flow 56,415 51,399 56,010 60,700 52,851 132,775 166,582 171,002 175,900 168,030
Oper. EPS (in EUR) 0.19 0.15 0.180 0.280 0.130 0.49 0.42 0.455 0.550 0.40018
ENCAVIS Analysts’ Consensus on the five corporate KPIs for Q3/2020e and 9M/2020e as of Nov 11th, 2020
→ Average Analysts’ Consensus for FY 2020e is slightly above ENCAVIS’ earnings guidance,
whereas Analysts’ Consensus of Operating Cash Flow is below ENCAVIS’ guidance for FY 2020e
Analysts' Consensus Analysts' Consensus
Average Extrema Guidance Average Extrema
(in EUR ‘000) 9M 2019 9M 2020 9M 2020e Top Bottom FY 2020e FY 2020e Top Bottom
Revenues 223,406 234,292 235,805 239,550 227,980 > 280,000 286,345 295,000 280,000
Oper. EBITDA 185,794 180,964 184,839 187,790 180,360 > 220,000 223,726 240,000 220,500
Oper. EBIT 121,781 113,168 117,025 119,460 112,753 > 130,000 133,886 138,786 131,700
Oper. Cash Flow 132,775 166,582 171,002 175,900 168,030 > 200,000 195,775 212,500 151,400
Oper. EPS (in EUR) 0.49 0.42 0.455 0.550 0.400 0.41 0.438 0.500 0.41019
Moderate growth expected for FY 2020e vs FY 2019 (wa = adjusted for weather effects)
2020e will be a year of transition in which the acquired PPA parks in Spain will have COD in Q3 and in Q4
and new acquisitions don‘t contribute to 2020e P&L – but step-up in 2021e
Operating figures FY 2019 Weather Guidance Change Show case
(in EUR million) adjusted FY 2020e Guidance FY 2021e /
FY 2019 (wa) FY 2020e / Change vs.
FY 2019 (wa) Guidance FY 2020e
Revenue 273.8 263.3 > 280.0 + 6.3% up to 320.0 / + 14%
Oper. EBITDA 217.6 210.6 > 220.0 + 4.5%
Oper. EBIT 132.2 125.2 > 130.0 + 3.8%
Oper. EPS 0.43 0.40 0.41 + 2.5%
Oper. Cash flow 189.3 > 200.0
Large Spanish projects Talayuela and La Cabrera will be connected to the grid late in 2020
!
and distribute significant FY revenue and operating cash flow to the Group in 202120
Guidance FY 2020e by Business Segments
Operating Solar Parks Technical Wind Parks Asset HQ
P&L Services Management
(in EUR
million)
FY FY 2019 Guidance FY Guidance FY FY 2019 Guidance FY Guidance FY Guidance
2019 (wa) 2020e 2019 2020e 2019 (wa) 2020e 2019 2020e 2019 2020e
Revenue 200.1 186.0 > 190 4.7 >4 63.1 66.7 > 74 11.6 > 12 - -
EBITDA 167.3 156.7 > 159 1.5 >2 51.9 55.4 > 62 5.6 >5 - 8.6 95 1.4 >2 23.8 34.0 > 38 5.0 >5 - 9.5 < - 10
Guidance based on average meteorological conditions and the already secured solar park and
!
wind farm portfolio21
Agenda
1 USP of Encavis business model 21
2 Encavis at a glance with record high results in FY 2019 27
3 The future is bright for renewables 27
4 New era - The growing PPA market 36
5 NO impact of CoVid-19 on our business model 41
6 FY 2019: Guidance fulfilled/ FY 2020e: The year of transition 49
7 Strategic outlook: >> Fast Forward 2025 52
8 Appendix: Operational excellence 65
9Strategic outlook:
Supportive meteorological effects 71
10 Battery storage 75
11>> Fast Forward 2025
The Management 79
12 The Encavis share 8022
Encavis Growth Programme: >> Fast Forward 2025
Growth Initiative Economies of Scale and Scope
> Investment in RTB and securing early-stage
projects primarily focused on PPA markets
> Ongoing opportunistic acquisitions in FiT markets Optimisation of Optimisation of
O&M cost SPV-financing
> European focus for the time being
> Disposal of minority participations in projects
(mainly wind farms) to diversify local wind risk
and to recycle cash
Cash pooling23
Encavis Growth Strategy: >> Fast Forward 2025
Increasing oper. EPS (wa)
from EUR 0.40 to 0.70
Increasing operating and CAGR of 10%
EBITDA (wa) from
EUR 210 to 330 million
and CAGR of 8%
Doubling of signed Solid equity
own capacity of ratio of 24%
Operating
1.7 GW (2019) to or more
EBITDA margin
3.4 GW and CAGR
of 75%
of 12%
Increasing revenue
(wa) from EUR 260 to
EUR 440 million and
CAGR of 9%24
Selected measures to fulfill: >> Fast Forward 2025
Pipeline Capacity Growth
> Currently> strategic partnerships signed25
Sustainable business model – Outlook 2025 of Encavis Asset Management
+ 1.5 to 2.5 bn
+ 200 to 300 EUR Investment
+ 15 to 20 new Megawatt p.a.
Power Plants p.a.
+ 150 to 200 million
EUR Equity p.a.
+ 3 to 5 new
Infrastructure Funds26
Growth strategy based on 2019 fundamentals only
Profitable growth outside Europe
Profitable business models in storage technology
Potential reserves in equity capital market transactions
and dividend policy post 2021
Further opportunities in
Mergers & Acquisitions
Base case scenario:
>> Fast Forward 202527
Agenda
1 USP of Encavis businessmodel
business model 4
21
2 Encavis at a glance with record high results in FY 2019 17
27
3 The use of
The future is bright for renewables 35
27
4
4 New
New era
era -- The
The growing
growing PPA
PPA market
market 40
36
5
5 NO infinite resources –
NO impact
impact ofof CoVid-19
CoVid-19 on
on our
our business
business model
model 57
41
6
6 FY this is our future
FY 2019:
2019: Guidance
Guidance fulfilled/
fulfilled/ FY
FY 2020e:
2020e: The
The year
year of
of transition
transition 59
49
7
7 Strategic
Strategic outlook:
outlook: >>
>> Fast
Fast Forward
Forward 2025
2025 67
52
8
8 Appendix: Operational excellence
Appendix: Operational excellence 73
65
9 Supportive meteorlogical effects 76
9 Supportive meteorological effects 71
10 Battery storage 80
10 Battery storage 75
11 The Management 86
11 The Management 79
12 The Encavis share 89
12 The Encavis share 8028
The „golden end“ of ENCAVIS‘ power plants
Illustration of the different cash flows of a solar park (PV)
“golden end“
In EUR Assumptions
000’ Closing of
Financial Obligation debt Solar-park connected to the grid
(loan) reserve in 2010 with FIT for 20 years
accounts (t20)
Park was bought in Q2 2011,
Interest 2012 first full year of operation
End of FIT
EBT (t2)
Non-recourse project financing
will be serviced and paid-off
CF to Equity
by the park
t2 t3 t4 t5 t6 t7 t8 t9 t10 t11 t12 t13 t14 t15 t16 t17 t18 t19 t20 Time (t)
! As the loan is paid-off during the FIT-period, parks are very profitable in the “golden end”29
“golden end“ - PV parks are still with high efficiencies and lowest marginal costs
Performance of PV-modules after 20-years Example: Cash flow for one solar park
Module
performance Costs do not exist in golden end
in % 100 or are under Encavis’ discretion
17,779
95
Do not incur
in golden end
90
16,096
58,082
85
40,303 5,579
1,826
Observed Expected future performance
80
performance of our PV parks according to 16,802
at our parks observations
75
0 10 20 years in service Revenues OPEX Operating Loan Interest Tax Cash Flow
Adjusted expectation
Performance of solar modules (EUR) Cash Flow repay-
ment30
Lifetime assumptions of PV parks differ nowadays substantially from IFRS accounting standards
Historical accounting rules Todays business reality
As the technology has proven to be mature, investors are increasingly extending their
valuation period (up to 50 years) and land lease agreements are currently being renegotiated
According to all GAAP/IFRS or extended to allow a longer operation of the plants.
it is mandatory to indicate 30 years can be taken for granted:
a useful life for an asset Performance warranties of 30 years for new modules is currently a “de facto” industry standard
that is capitalized. Due to as confirmed by the extracts from official data sheets on the following pages
the lack of historical data
(utility-scale plants have been 30 years ++ can be assumed due to following reasons: *)
built from 2005 onwards) Consistently dropping technology costs will allow operators to either . . .
+ Ongoing optimizations of the portfolio at very low replacement costs or
accountants and investors + Increase the power of the plants once the subsidy schemes are faded out
have focused on the duration
of the subsidy schemes There is also an increasing portion of already acquired land as well as strategic ambitions
(usually 20 years) and/or to acquire the land on which solar plants are operating or are being developed.
of the land leases
Encavis’ land leases/acquisitions allow long useful life / Extension . . .
(usually 25 to 30 years)
to estimate the useful life. . . . to 30 years in 45% of Portfolio (PF) in NL
. . . to 30 years or longer in > 60% of PF in FRA / in 50% of PF in IT / in 30% of PF in UK
. . . up to 2050 plus unlimited number of extensions of 5-year-periods in ES / an evergreen contract
*) https://www.pv-magazine.com/2018/12/17/revamping-and-repowering-the-size-of-the-opportunity/31
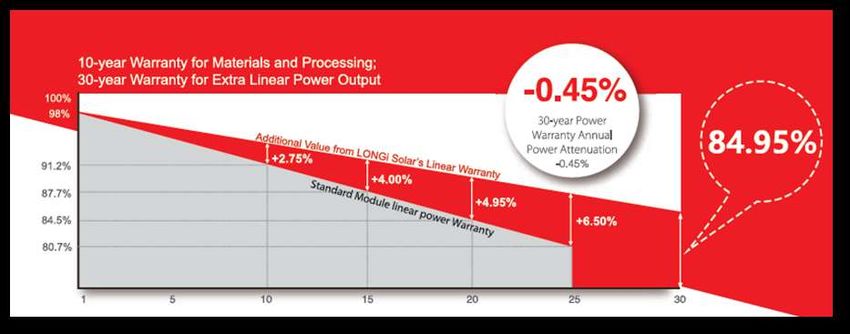
PV module warranties of 30 years are current standard (I)
Longi32
PV module warranties of 30 years are current standard (II)
RISEN ENERGY
Jinko Solar33
National shutdown plans of nuclear and coal driven generating capacities
COUNTRY Coal driven Power Plants Nuclear Power Plants
Germany Until 2038 47.0 GW Until 2022 8.1 GW
Poland ---- 29.5 GW ---- 0.0 GW
Czech Republic Until 2040*) 8.4 GW ---- 3.9 GW
Austria Today already 0.0 GW Today already 0.0 GW
Italy Until 2025 8.5 GW ---- 0.0 GW
Spain Until 2030 5.1 GW Until 2035 7.1 GW
France Until 2022 3.1 GW ---- 63.1 GW No plan
United Kingdom Until 2024 6.3 GW ---- 8.9 GW
Belgium Today already 0.0 GW Until 2025 5.9 GW
The Netherlands Until 2029 4.5 GW ---- 0.5 GW
Denmark Until 2030 2.2 GW ---- 0.0 GW
Sweden Today already 0.0 GW Until 2040 7.6 GW
Finland Until 2029 1.8 GW ---- 2.8 GW
Fixed plan
TOTAL 116.6 GW 107.9 GW
Plans in progress
*) Replace 2/3 of capacity34 The World is changing: Significant decline in coal-driven energy production Mind changer in fossil energy production (Annual coal-driven energy production) TWh Source: IEA / Forecasted consumption acc. to ‚Stated Policies‘ scenario of the corresponding years (gray) and real data (black) for 2020
35

Surprisingly increasing share of Photovoltaic capacities

 Solar Power totally underestimated
 (Annual addition       GW
  of PV capacities )

Source: IEA / Forecasted addition acc. to ‚Stated Policies‘ scenario of the corresponding years (yellow) and real data (black)
36

The future is bright
 1 USP of Encavis businessmodel                                      21
for renewables
 2 Encavis                   . . . high results in FY 2019
           at a glance with record                                   27
 3   The future is bright for renewables                             27
 The future is
 4   New era - The growing PPA market                                36
 5   NO impact of CoVid-19 on our business model                     41
 bright.for
 6       . . resulting in growing
     FY 2019: Guidance fulfilled/ FY 2020e: The year of transition   49
 7
 8
       demand for Green Energy
 renewables
     Strategic outlook: >> Fast Forward 2025
     Appendix: Operational excellence
                                                                     52
                                                                     65
 9   Supportive meteorlogical effects                                71
10   Battery storage                                                 75
11   The Management                                                  79
12   The Encavis share                                               80
37
Worldwide growth in generating capacity of renewables by technology
Capacity growth 82% Percentage of
in GW PV/Wind of total
1000 68% 44
45 119
800
45%
215 Others
600
28% 438 Hydropower
400 31 260 Solar PV
176 Wind
200 14 36 285 321
92 134
0 39
1994-2004 2005-2010 2011-2016 2017-2022
Source: International Energy Agency 201738
Development of Renewable energy proportion in power generation, 2006-2016
Canada UK Germany
6% 25% 29%
5% 2% 9% China
10%
6%
Japan
12%
Spain
US 7%
30% Italy
9%
13% 25%
3%
12%
India
Highest 6%
4%
Mid / High Australia
Mid 12%
Mid / Low 3%
Brazil
Lowest
18% South Africa
6% 3%
Note: Excludes large hydro; 1%
Source: Bloomberg New Energy Finance39
Entering the Century of Renewable Power Generation
Gross capacity additions by technology group Global utility PV and onshore wind capacity
Share in annual capacity additions In GW
100% 5.500
5.090
90% 5.000
80% 4.500
4.000
70% 3.485
3.500
60% CAGR +8%
3.000
50%
2.500
2.119
40%
2.000
1.503
30% 1.500 1.134
20% 1.000
566
10% 500 211
0% 0
2015 2020 2025 2030 2035 2040 2010 2015 2020 2025 2030 2035 2040
Renewables Nuclear Fossil Fuels Large-scale PV Onshore Wind40
Demand for power from renewables from two strong players: public & private sector
Public Sector: Goal to limit global warming
> COP 21 Paris: 196 countries united to limit global warming below 2°C
> Europe 20-20-20 targets
> China: largest installed renewables fleets
> Denuclearization in Germany and Japan
> Creation of low-carb economies
Demand via FIT-schemes and competitive auctions
Private sector: Sustainability goals and long-term supply security
> Private companies create global initiatives in order to take action on climate change.
> Multinational companies such as Google, Facebook and Microsoft go ahead with ambitious targets
> 100% renewable targets help to create a positive brand awareness
> Furthermore, direct Power Purchase Agreements between companies and power producers
from renewable energy resources offer long-term supply at fixed rates
Demand via PPAs and purchase of green certificates41
Agenda
1 USP of Encavis business model 21
2 Encavis at a glance with record high results in FY 2019 27
3 The future is bright for renewables 27
4 New era - The growing PPA market 36
5 NO impact of CoVid-19 on our business model 41
6 FY 2019: Guidance fulfilled/ FY 2020e: The year of transition 49
7 Strategic outlook: >> Fast Forward 2025 52
8 Appendix: Operational excellence 65
9 Supportive
Encavismeteorological effects
is a European first mover 71
10 Battery storage 75
11 The Management 79
12 The Encavis share 8042
Competitive generation costs of PV & wind projects opens new business opportunities
Development of global Levelized Costs Of Energy (LCOE) Forecasted generation costs for large-scale PV
(USD real 2018 /MWh) and 2021 Forward Prices1 (EUR/MWh)
350 52 Merchant PPA
opportunity
300 50 45 44
250 46
40
200 40
38
30
150
100 20
50 10
0
2010 2012 2014 2016 2018 2019 0
Spain Italy France
1H 1H 1H 1H 1H 1H
2020 expected generations cost for PV
Solar-PV Onshore wind 2021 Electricity Forward Price (Feb)
In Southern-European markets the generation costs of renewables are already below prices of 2019
!
Electricity Forwards. This boosts PPA-Markets in countries such as Spain and Italy.
Source: BNEF, Fraunhofer ISE, Fraunhofer ISE Energy Charts, Goldman Sachs Global Investment Research, 1. Baseload Futures Year Ahead last price as of Feb 14, 202043
Solar PV utility scale with comparably low Levelized Costs Of Energy (LCOE) Production
The cost of energy production
from conventional sources
is set to increase, as prices for
CO2 emissions in the EU rise
with the application of taxes
and certificates
Encavis‘ (2nd phase of the EU CO2 certificate
focus trading scheme and additional
national legislations)
Securing the
cost advantage for
renewable energy
in the long term.
Source: CM-CIC Research on „Renewable Energies“ covering Albioma, Encavis and Voltalia, June 5th, 202044
LCOE/Levelized Costs Of Energy Production continue to fall for PV/solar and wind power technologies
Today, plant construction costs (including components and materials)
in utility scale (10 MW and above) in Europe vary between EUR 0.4m/
MWp and EUR 0.475 m/MWp, including 30 years warranty on key
components such as modules. Common expectations are further
decreases in the near, mid and long term.
Current O&M prices are at around 3.5 to 7 EUR/KW according to
the age and size of the plant. The termination of old contracts and
renegotiation of the terms will lead to a substantial reduction in the
average O&M expenditures.
We expect additional reduction in O&M costs due to consolidation in
the O&M market and increase of professionalization in the market.
Encavis’ strategic move: Participation in Stern Energy
(O&M company with 1+GW under management) and
standardization of all O&M activities.
Source: IRENA, International Renewable Energy Agency, Renewable Power Generation Costs in 201945
Strong decline in LCOE/Levelized Costs Of Energy Production for PV/solar is mainly driven by PV module prices
Price development for PV modules (USD real 2,000/Wp)
This cost decrease applies to park maintenance,
lease payments and interest rates as well.
Source: BNEF, Warburg Research on SDAX, Renewables, Encavis, 07.09.202046
Electricity price fluctuations due to the Merit Order Effect
In the very conservative assumption of an energy only
market, thus a market in which only the produced
power is compensated, without any compensation for
the mere readiness for power production (capacity
market), the power price would be determined by the
“merit order” – the sequence in which power stations
contribute power to the market, with the cheapest offer
made by the power station with the smallest operating
costs setting the starting point – and not by the LCOE.
While it is true that renewables lower the entrance price
due to their low operating costs and push more
expensive conventional producers down the merit order
(see chart to the left), it is also true that the price for
the energy is set by the plant with the highest operating
cost that is still necessary to be activated in order to
meet the demand.
Source: https://www.cleanenergywire.org/factsheets/setting-power-price-merit-order-effect47
Positive development of PPA power prices are seen by all leading energy price forecasters
> All major forecasters of energy
prices do see positive
Liquid Market Horizon Illiquid Market Horizon development of energy prices
in the future.
Long-term PPAs > Main drivers for energy prices
are: CO2 certificate prices,
Standard products
capacity additions of
renewables acompanied with
Baseload Power Price
cut down of capacities of
conventional power plants.
> Even the most conservative
LCOE for Solar PV as of June 2020…
forecaster (#3) sees energy
market prices which are fairly
...are expected to decrease further
above current (and, obviously,
future) LCOEs enabeling
2021 2026 2031 2036
additional investments into
Forecast 1 Forecast 2 Forecast 3
renewables.48 ENCAVIS manages uncertainties in power demand, power supply and corresponding pricing risks Sophisticated Energy risk management as key value leaver short to mid term: > Traded products in liquid markets (1-5 years ahead) > PPAs for non-liquid markets (5 years ++) > Matching inherent energy risks by portfolio optimization European goal for CO2 free power production will either lead to . . . > a CO2 price regime as part of power prices in order to stimulate investments in Renewable Energy > the introduction of capacity markets for Renewable Energy (REE) in order to allow for new build > a self-regulated energy only market where power prices incentivize enough new build capacities in REE Long-term price curves*) observation as well as introduction of proprietary energy pricing model > Captured prices for solar and wind (accounting for the expected cannibalization effect) > Introduction of storage as appropriate *) from various reknowed 3rd party providers
49

Agenda

 1
 2
         The Management
     USP of Encavis business model
     Encavis at a glance with record high results in FY 2019
                                                                     21
                                                                     27
 3   The future is bright for renewables                             27
 4   New era - The growing PPA market                                36
 5   NO impact of CoVid-19 on our business model                     41
 6   FY 2019: Guidance fulfilled/ FY 2020e: The year of transition   49
 7   Strategic outlook: >> Fast Forward 2025                         52
 8   Appendix: Operational excellence                                65
 9   Supportive meteorological effects                               71
10   Battery storage                                                 75
11   The Management                                                  79
12   The Encavis share                                               80
50
Management team with great industry expertise and strong passion for renewables
Dr Dierk Paskert Dr Christoph Husmann
Chief Executive Officer Chief Financial Officer
CEO since Sep 2017 CFO since Oct 2014
Reappointed until Aug 2025 Reappointed until Sep 2025
CEO Rohstoffallianz GmbH Member (CFO) and later CEO of the Management Board of
Member of the Management Board of E.ON-Energie AG HOCHTIEF Projekt Entwicklung GmbH
SVP Corporate Development of E.ON AG Head of Corporate Controlling and M&A of STINNES AG and HOCHTIEF AG
Member of the Management Board of Schenker AG Controlling of VEBA AG51
Supervisory Board
Dr Manfred Krüper (Chairman) Alexander Stuhlmann (Dep. Ch.) Albert Büll (dependent)
Member of the Board of Directors CEO at HSH Nordbank (until Dec 2006) Entrepreneur and co-owner of the B&L Group
at E.ON AG (until Nov 2006) and thereafter CEO at WestLB AG Advisory Council (a.o.):
(until April 2008) BRUSS Sealing Systems GmbH,
Supervisory Board (a.o.):
Power Plus Communication AG, Supervisory Board (a.o.): Euro-Aviation noventic GmbH
EQT Partners Beteiligungsberatung GmbH; Versicherungs-AG, Ernst Russ AG, GEV Gesell-
EEW Energy from Waste GmbH schaft für Entwicklung und Vermarktung AG,
M.M. Warburg & CO Hypothekenbank AG
Peter Heidecker (dependent) Dr Henning Kreke (dependent) Dr Cornelius Liedtke (dependent)
Chairman of the Supervisory Board at Previously CEO at Douglas Holding AG Entrepreneur and co-owner of the B&L Group
CHORUS Clean Energy AG (until Oct 2016) for 15 years
Supervisory Board (a.o.):
Founder of the CHORUS GmbH in 1998
Supervisory Board (a.o.): Deutsche BRUSS Sealing Systems GmbH,
EuroShop AG; Douglas GmbH, Thalia SUMTEQ GmbH
Supervisory Board (a.o.):
Bücher GmbH
Auszeit Hotel & Resort AG
Christine Scheel Dr Marcus Schenck Prof Fritz Vahrenholt
Member of the Supervisory Board at Partner of Perella Weinberg Partners Chairman of the Supervisory Board
CHORUS Clean Energy AG (until Oct 2016) (until January 2014) at RWE Innogy GmbH
Former Member of the German Parliament Independent Advisory Council(a.o.): (previously CEO)
EQT Infrastructure
Supervisory Board (a.o.): Supervisory Board (a.o.):
NATURSTROM AG Aurubis AG52
Agenda
1 USP of Encavis business model 21
2 Encavis at a glance with record high results in FY 2019 27
3 The future is bright for renewables 27
4 New era - The growing PPA market The Encavis share 36
5 NO impact of CoVid-19 on our business model 41
6 An attractive Investment
FY 2019: Guidance fulfilled/ FY 2020e: The year of transition 49
7 Strategic outlook: >> Fast Forward 2025 52
8 Appendix: Operational excellence 65
9 Supportive meteorological effects 71
10 Battery storage 75
11 The Management 79
12 The Encavis share 8053
Dividend of EUR 0.26 per share for FY 2019 fully in line with dividend target 2021
Significant majority (61.5 %) of shareholders Nominal dividend to increase by 50% (base-year 2016)
preferred new ENCAVIS shares to cash dividend to 30 EUR cent in 2021
for FY 2019 0.30
Dividend policy reflects increasing cashflows 0.26
from PV/Wind parks over time 0.24
0.22
0.20
50% increase of nominal dividend 0.18
until 2021 (compared to 2016) 0.15
based on the existing PV/Wind park
portfolio as of March 31, 2017 0.10
0.08
Further acquisitions of PV/Wind 0.05
parks will positively contribute
to the dividend potential
Dividend (EUR cent/share)
2011 2012 2013 2014 2015 2016 2017 2018 2019 2020 202154
Entrepreneurial shareholder structure – strong and long-term anchor investors
Market Cap: # shares: 138,437,234
> 2.4 billion EUR (post scrip dividend of 2019)
Major investors within the free float: 26.7% Pool of
AMCO Service GmbH (Büll Family) with
5.8% BlackRock Fund Managers Limited Dr Liedtke Vermögensverwaltung GmbH
4.0% Versicherungskammer Bayern (Liedtke Family)
3.5% Lobelia Beteiligungsgesellschaft/
Kreke Immobilien KG
Free float
3.1% DWS Investment GmbH, Frankfurt/Main 73.3%
2.3% PELABA Vermögensverwaltungs GmbH & Co. KG
0.4% Management of Encavis AG55
ENCAVIS share – Twelve active coverages with seven “buy” recommendations out of eleven
Coverage institution Updated Ratings Date Target Price (EUR)
Reduce Nov 06, 2020 13.00
Buy Oct 14, 2020 20.80
Buy Sep 28, 2020 21.00
Buy Sep 07, 2020 17.20
Hold Sep 02, 2020 15.00
Buy Aug 28, 2020 18.50
Buy Aug 28, 2020 16.90
Buy Aug 26, 2020 18.30
Neutral Aug 26, 2020 15.00
Hold Aug 26, 2020 13.50
(Buy) Aug 26, 2020 14.60
Consensus Further Ratings Date 16.71
Jan 24, 2020
! Further coverages of the ENCAVIS share are initiated . . .56
ENCAVIS share with strong upward trend got a dip from capital market panic also
210
ENCAVIS DAX 30 SDAX OEKODAX
200
190
180
170
160
150
140
130
120
110
100
90
80
70
60
12.11.19 12.12.19 12.01.20 12.02.20 12.03.20 12.04.20 12.05.20 12.06.20 12.07.20 12.08.20 12.09.20 12.10.20 12.11.2057
ENCAVIS – One of the largest independent and listed European Renewable IPPs
Benchmarking by market capitalization as of Nov 12, 2020 (EUR million)
4,145
European listed renewable companies
Listed yield companies
2,644 2,576
2,472
1,724
1,509
1,401
1,273
701 698
504
25358
Date 2020 Event (I) Date 2020 Event (II)
Nov 16 Interim statement Q3/9M 2020 Dec 8 REUTERS The Future of Renewables,
London (UK)
Nov 16-18 German Virtual Equity Capital Market
Forum, Deutsche Börse, FFM (GER) Dec 11 Interest payment PNL 2015
Nov 23 REUTERS Energy Transition Summit, Date 2021
London (UK)
Jan 11-13 ODDO BHF Forum/100% virtual, Lyon (FR)
Nov 23/24 Commerzbank Virtual Investors Days,
Zurich/Geneva (CH) Jan 20 Virtual UniCredit/Kepler Cheuvreux
German Corporate Conference 2021,
Nov 24 DZ Bank Virtual Equity Conference 2020,
Frankfurt/Main (GER)
Frankfurt/Main (GER)
Nov 25/26 16th Virtual Structured FINANCE, Feb 3 Virtual Solar Finance & Investment
Stuttgart (GER) Summit Europe, London (UK)
Nov 30 Berenberg Virtual European Conf. 2020, Mar 13 Interest payment Hybrid Convertible
Pennyhill Park, Surrey / London (UK)59
Date 2021 Event (III) Date 2021 Event (IV)
Mar 22 Berenberg Virtual Energy Transition Aug 13 Interim report Q2/6M 2021
Conference, London (UK)
Sep 1 Commerzbank Sector Conference,
Mar 23 Consolidated Financial Statements 2020 Frankfurt/Main (GER)
Mar 24 Analysts’ Conference Call regarding the Sep 1-2 Stifel Cross Sector Insight Conference
Consolidated Financial Statements 2020 London (UK)
Mar 26 Jefferies Equity-Linked Virtual Conference Sep 12 Interest payment PNL 2018 “Green SSD”
2021, London (UK)
Sep 13 Interest payment Hybrid Convertible
Apr 12-14 RBI/Raiffeisen CENTROBANK Institutional
Investors Conference Zürs (AT)
Nov 15 Interim statement Q3/9M 2021
May 14 Interim statement Q1/3M 2021
Dec 11 Interest payment PNL 2015
May 27 Annual General Shareholders Meeting
Hamburg (GER)60
IR/ PR Contact The information provided in this document has been derived from sources that
Jörg Peters we believe to be reliable. However, we cannot guarantee the accuracy or
completeness of this information and we do not assume any responsibility for it.
Head of Investor Relations & Public Relations
Encavis AG assumes no liability for any errors or omissions or for any resulting
financial losses. Investments in capital markets, in particular in stock markets
T +49 (0)40 / 37 85 62 242
and futures markets, are fundamentally associated with risks and a complete
M +49 (0)160 / 429 65 40
loss of the invested capital cannot be ruled out. Recommendations provided
E joerg.peters@encavis.com
herein do not represent an offer to buy or sell and are not intended to replace
comprehensive and thorough advice before making a decision to buy or sell.
Encavis AG
Copies of the content of this presentation, in particular prints and copies or
Große Elbstraße 59
publications in electronic media, will only be authorized by written consent from
D- 22767 Hamburg
Encavis AG.
Germany
www.encavis.comYou can also read