HELLA GMBH & CO. KGAA - Q1 FY 2018/19 COMPANY PRESENTATION

Page created by Wanda Burke
 
CONTINUE READING
HELLA GMBH & CO. KGAA - Q1 FY 2018/19 COMPANY PRESENTATION
HELLA GmbH & Co. KGaA
                        Company Presentation

                        Q1 FY 2018/19

HF-7761DE_C (2013-10)
HELLA GMBH & CO. KGAA - Q1 FY 2018/19 COMPANY PRESENTATION
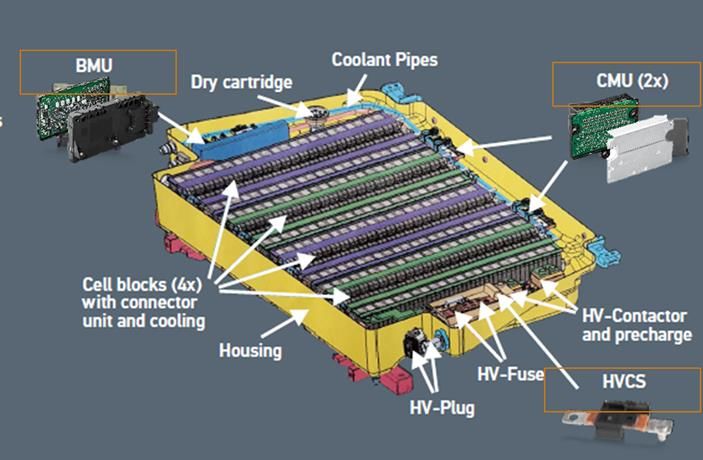
Disclaimer

This document was prepared with reasonable care. However, no responsibility can be assumed for
the correctness of the provided information. In addition, this document contains summary
information only and does not purport to be comprehensive and is not intended to be (and should
not be construed as) a basis of any analysis or other evaluation. No representation or warranty
(express or implied) is made as to, and no reliance should be placed on, any information, including
projections, targets, estimates and opinions contained herein.

This document may contain forward-looking statements and information on the markets in which
the HELLA Group is active as well as on the business development of the HELLA Group. These
statements are based on various assumptions relating, for example, to the development of the
economies of individual countries, and in particular of the automotive industry. Various known and
unknown risks, uncertainties and other factors (including those discussed in HELLA’s public
reports) could lead to material differences between the actual future results, financial situation,
development or performance of the HELLA Group and/or relevant markets and the statements and
estimates given here. We do not update forward-looking statements and estimates retrospectively.
Such statements and estimates are valid on the date of publication and can be superseded.

This document contains an English translation of the accounts of the Company and its subsidiaries.
In the event of a discrepancy between the English translation herein and the official German
version of such accounts, the official German version is the legal valid and binding version of the
accounts and shall prevail.

 2                                        HELLA Company Presentation | Q1 FY 2018/19
HELLA GMBH & CO. KGAA - Q1 FY 2018/19 COMPANY PRESENTATION
HELLA Company Presentation Q1 FY 2018/19
Outline

■ HELLA Financial Results Q1 FY 2018/19

■ HELLA at a Glance

■ HELLA’s view on Automotive Market Trends

 3                               HELLA Company Presentation | Q1 FY 2018/19
HELLA GMBH & CO. KGAA - Q1 FY 2018/19 COMPANY PRESENTATION
Positive sales growth and EBIT increase in Q1 FY 2018/19
Financial Highlights Q1 FY 2018/19

                                     ■ HELLA Group currency adjusted sales grew by 10.3% YoY to
         Sales                         1.8 bill. EUR

                                     ■ Adjusted Gross Profit margin at 28.0% (+0.6%-points YoY)
 Profitability                       ■ Adjusted EBIT +15 mill. EUR (+12.0% YoY) at 140 mill. EUR
                                     ■ Adjusted EBIT margin +0.1pp to 7.8%

                                     ■ Adjusted Free Cash Flow from operating activities increased by
      Liquidity
                                       9 mill. EUR (+18.5% YoY) to 59 mill. EUR

Note: Adjustments of profitability figures include restructuring expenses. Please note that where sums and percentages in the presentation have been rounded, differences
may arise as a result of commercial rounding.
  4                                                                      HELLA Company Presentation | Q1 FY 2018/19
HELLA GMBH & CO. KGAA - Q1 FY 2018/19 COMPANY PRESENTATION
HELLA top line growth with strong development in Q1 FY 18/19
Financial Highlights Q1 FY 2018/19

HELLA Group sales (EUR millions)                                                        Comment
                                                                                          ■ Currency adjusted growth HELLA Group
                                                                                            at 10.3%
                                             -10                                          ■ Reported sales growth HELLA Group at
                                                                                            9.7% (increased by 157 mill. EUR to 1,8
                          168
                                                                                            mill. EUR)
      +10.3%                                                             9.7%
                                                                                               Automotive +11.2% to 1.383 mill.
                                                                                                EUR. Demand for energy
                                                               1,787                            management products, radar
      1,629
                                                                                                solutions and advanced lighting
                                                                                                systems (front, rear, interior) drives
                                                                                                business
                                                                                               Aftermarket* total sales +6.8%,
 Q1 FY 17/18        adj. growth              FX           Q1 FY 18/19                           positive demand from Independent
                                                                                                Aftermarket and strong Workshop
                                                                                                business
                                                                                               Special Applications +0.8% to 100
                                                                                                mill. EUR, positive development in
 *The figures for the Aftermarket segment exclude the items from wholesale                      agriculture and construction
 distribution. Wholesale items included on Group level
  5                                                                     HELLA Company Presentation | Q1 FY 2018/19
HELLA GMBH & CO. KGAA - Q1 FY 2018/19 COMPANY PRESENTATION
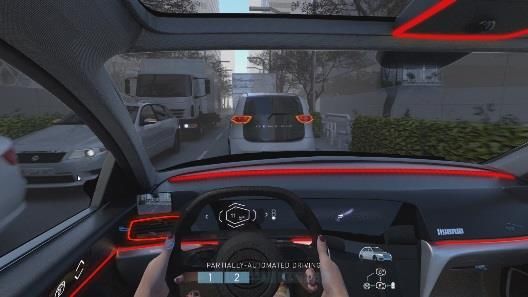
HELLA Automotive outperforming all important regions
Financial Highlights Q1 FY 2018/19
HELLA Automotive external sales by region (in EUR millions)

Global                                                      Europe                                                 North & South America                                Asia & RoW
                                           1,372                                                             859                                                  290                                                   223
                            1,227                             762             754             762                                                   264                                                 201
 1,138       1,163                                                                                                                                                                      181
                                                                                                                                     228                                 167
                                   +11.8%                            -1.1%          +1.1%           +12.7%             208                                +9.7%                                                +11.4%
         +2.2%          +5.5%                                                                                                                                                                  +10.8%
                                                                                                                                           +15.9%                              +8.2%
                                                                                                                             +9.4%
                 537                                  646

 Q1 FY       Q1 FY          Q1 FY          Q1 FY             Q1 FY           Q1 FY           Q1 FY       Q1 FY        Q1 FY      Q1 FY             Q1 FY      Q1 FY     Q1 FY       Q1 FY           Q1 FY           Q1 FY
 15/16       16/17          17/18          18/19             15/16           16/17           17/18       18/19        15/16      16/17             17/18      18/19     15/16       16/17           17/18           18/19

Light vehicle production (in million units)
Global                                                      Europe                                                 North & South America                                Asia & RoW
                                               22.3                                                          5.0       5.2           5.2                                                                11.7            11.7
                                22.1
                 21.8                                                                                                                                             5.2                   11.3
                                                                                                                             +0.2%                                                                             +0.1%
                                       +1.1%                                  4.9             4.9
                        +1.3%                                                                                                                                                                  +3.4%
  20.5                                                                               -0.2%          +3.1%                                           5.0
                                                              4.8                                                                                                       10.3
         +6.2%                                                      +3.2%                                                                  -4.0%          +3.2%                +10.3%

 Q1 FY       Q1 FY          Q1 FY          Q1 FY             Q1 FY           Q1 FY           Q1 FY       Q1 FY        Q1 FY      Q1 FY             Q1 FY      Q1 FY     Q1 FY       Q1 FY           Q1 FY           Q1 FY
 15/16       16/17          17/18          18/19             15/16           16/17           17/18       18/19        15/16      16/17             17/18      18/19     15/16       16/17           17/18           18/19

HELLA Automotive growth vs. market (Light vehicle production growth):

            -4.0%          +4.2%           +10.7%                            -4.3%       +1.3%           +9.6%                   +9.2%              +19.9% +6.4%                   -2.1%            +7.4%           +11.2%

 Source: HELLA; IHS (as of July 2018)

   6                                                                                                 HELLA Company Presentation | Q1 FY 2018/19
HELLA GMBH & CO. KGAA - Q1 FY 2018/19 COMPANY PRESENTATION
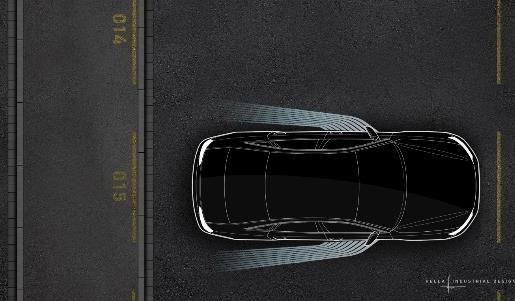
GPM increase due to strong overall business development
Financial results Q1 FY 2018/19

Adj. Gross Profit                                                                                   Highlights
EUR millions
                                                                           501                       ■ Adj. Gross Profit increased by 53
                                                    448                                                mill. EUR (+11.9%) to 501 mill. EUR
       399                    421

                  +23                    +26
                                                               +53
                                                                                                       Automotive +16.9% to 353 mill. EUR
                                                                                                          Aftermarket** +8.6 % to 61 mill. EUR
                                                                                                          Special Applications -3.8% to
                                                                                                           40 mill. EUR
 Q1 FY 15/16            Q1 FY 16/17*          Q1 FY 17/18*           Q1 FY 18/19

Adj. Gross Profit margin                                                                            Highlights
% sales
                                                                          28.0
                                                                                                     ■ Adj. Gross Profit margin improved
                                                    27.5                                               by 0.6%-points to 28.0%
                             27.1
       26.7                                                    +0.6                                    higher GPM Automotive (+1.3pp)
                                        +0.3
                  +0.5                                                                                  due to higher production volume
                                                                                                        driven by several launches
                                                                                                       increased GPM in Aftermarket
                                                                                                        (+0.6pp) due to Workshop sales
  Q1 FY 15/16           Q1 FY 16/17*          Q1 FY 17/18*           Q1 FY 18/19
                                                                                                       Special Applications -1.9pp due to
 *Restated for the reclassification of costs. For details see quarterly financial report
 **The figures for the Aftermarket segment exclude the items from wholesale                             positive one-time effects in PY
 distribution. Wholesale items included on Group level
   7                                                                           HELLA Company Presentation | Q1 FY 2018/19
HELLA GMBH & CO. KGAA - Q1 FY 2018/19 COMPANY PRESENTATION
Continuous high R&D expenses to secure future growth and to
support production ramp-up
Financial results Q1 FY 2018/19
R&D expenses                                                                                        Highlights
EUR millions
                                                                          168                         ■ Absolute R&D expenses increased
       3.7%
      140                    140                   147                                                  by 21 mill. EUR (+14.3% YoY) to
                   0 3.4%                +7                   +21                                       168 mill. EUR, mainly:
                                                                                                        Secure and strengthen technology
                                                                                                         leadership along the market trends
                                                                                                        Preparation and realization of
                                                                                                         production ramp-ups
 Q1 FY 15/16          Q1 FY 16/17*            Q1 FY 17/18*          Q1 FY 18/19                         continuous development of
                                                                                                         international R&D capacities
R&D expenses ratio                                                                                 Highlights
% sales
                                                                          9.4
                                                                                                     ■ Q1 FY 18/19 ratio +0.4pp to 9.4%
      9.3                    9.0                    9.0
                                                                                                       with over-proportional increase in
       8.1%      -0.3                   0.0                   +0.4                                     absolute R&D expenses
                       7.8%

 Q1 FY 15/16           Q1 FY 16/17*           Q1 FY 17/18*          Q1 FY 18/19
*Restated for the reclassification of costs. For details see quarterly financial report

  8                                                                           HELLA Company Presentation | Q1 FY 2018/19
HELLA GMBH & CO. KGAA - Q1 FY 2018/19 COMPANY PRESENTATION
Relatively stable development of SG&A costs
Financial results Q1 FY 2018/19

Adjusted SG&A expenses                                                                           Highlights
EUR millions
                                                                      204                         ■ Adj. SG&A costs increased (+17
       3.7%
       3.7%
                           178                   187                                                mill. EUR, +8.8%) to 204 mill. EUR
      166
                +12
                        3.4%
                        3.4%           +9                  +17                                    ■ Higher logistic costs with additional
                                                                                                    sales
                                                                                                  ■ Continuous investments in
                                                                                                    processes, systems and functions

Q1 FY 15/16          Q1 FY 16/17*          Q1 FY 17/18*          Q1 FY 18/19

       8.1%
Adjusted SG&A expenses ratio                                                                     Highlights
% sales
                       7.8%                                                                        ■ Adj. SG&A ratio decreased
      11.1                 11.5                 11.5                  11.4
                                                                                                     (-0.1ppt) to 11.4%
       8.1%     +0.4                  0.0                  -0.1

                       7.8%

 Q1 FY 15/16         Q1 FY 16/17*          Q1 FY 17/18*          Q1 FY 18/19
*Restated for the reclassification of costs. For details see quarterly financial report

  9                                                                           HELLA Company Presentation | Q1 FY 2018/19
HELLA GMBH & CO. KGAA - Q1 FY 2018/19 COMPANY PRESENTATION
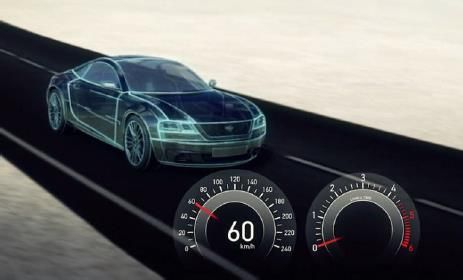
Adjusted EBIT and EBIT margin above prior-year’s level
Financial results Q1 FY 2018/19

Adjusted EBIT                                                                   Highlights
EUR millions
                                                        140                       ■ Adj. EBIT increased by 15 mill. EUR
                      118               125                                         (+12.0%) to 140 mill. EUR, mainly:
       101
                                +7             +15                                   increase in adj. Gross Profit by 53
               +17                                                                    mill. EUR (+11.9%)
                                                                                     higher R&D expenses (+21 mill.
                                                                                      EUR, +14.3%)
                                                                                     increase in adj. SG&A (mainly
 Q1 FY 15/16      Q1 FY 16/17        Q1 FY 17/18     Q1 FY 18/19                      distribution expenses) by 16 mill.
                                                                                      EUR (+8.8%)
Adjusted EBIT margin                                                            Highlights
% sales
                                                                                 ■ Adj. EBIT margin increased by 0.1%-
                      7.6               7.7             7.8
       6.8                                                                         points to 7.8%:
                            +0.1               0.1
               +0.9                                                                 increase of adj. GPM by 0.6pp
                                                                                    higher R&D expenses ratio (+0.4pp)
                                                                                    lower JV contribution (-0.1pp)

 Q1 FY 15/16      Q1 FY 16/17        Q1 FY 17/18     Q1 FY 18/19

  10                                                       HELLA Company Presentation | Q1 FY 2018/19
P&L including reconciliation
Financial results Q1 FY 2018/19

FY comparison                                                                                                               Comments
HELLA GROUP
                                                                 Q1 FY 17/18                     Q1 FY 18/19
in EUR mill.                                                                                                                ■ Reported EBIT Q1 FY 18/19
 Gross Profit *                               reported               447.1                             500.8                  increased by 15 mill. EUR
                                            Adjustments                          0.6                           0.03
                                                                                                                              (+12.5%) to 139 mill. EUR,
                                            adjusted
                                                                                                                              EBIT no major impact from
                                                                     447.7                             500.8
                                                                                                                              restructuring
 Other income and expenses                   reported                    5.1                            6.9
                                            Adjustments                          1.2                            0.7
                                                                                                                            ■ Net financial result decreased
                                                                                                                              slightly after local financing in
                                            adjusted                     6.2                            7.6
                                                                                                                              Mexico
 Distribution*                                reported               139.6                             152.3
                                                                                                                            ■ Earnings for the period
                                            Adjustments                          0.0                            0.6
                                                                                                                              increased driven by strong
                                            adjusted                 139.6                             151.7                  growth and lower one-offs
 EBIT                                        reported                123.2                             138.5                ■ Result driven higher tax
                                            Adjustments                          1.8                            1.4
                                                                                                                              payments, tax rate around
                                            adjusted                 124.9                             140.0                  25% comparable to PY. Excl.
 Net financial result
                                                                                                                              JVs tax rate at 27.1%,
                                                                      -11.9                            -11.7
                                                                                                                              improved vs PY (28.5%)
 Taxes                                                                -28.4                            -31.5
 Earnings for the period
                                                                                                                            ■ EPS increased by 12 Cent
                                                                       82.9                            95.4
                                                                                                                              (+16%) to 0.86 EUR
 Earnings per share (EUR)                                              0.74                            0.86
 *Q1 FY 17/18 restated for the reclassification of costs. For details see quarterly financial report
   11                                                                          HELLA Company Presentation | Q1 FY 2018/19
Adj. Free Cash Flow from operating activities increased due to
higher funds from operations
Financial results Q1 FY 2018/19
Adj. FCF from operating activities                                                           Highlights
EUR millions
                                                                                               ■ Adj. Free Cash Flow from
              -54.3%
        67
                                                      +17.7%                                     operating activities increased by
                                  +63.8%
                                                                  59                             9 mill. EUR to 59 mill. EUR, mainly
                                               50
                                                                                                 due to higher funds from
                           31                                                                    operations and improved WC
                                                                                                 consumptions
                                                                                               ■ Cash Conversion1 ratio increased
  Q1 FY 15/16          Q1 FY 16/17      Q1 FY 17/18          Q1 FY 18/19                         by 2.3pp to 42.4%
                                                                                               1) Adj. Free Cash Flow from operating activities / adj. EBIT

Net CAPEX2                                                                                   Highlights
 EUR millions
                                              145                149                           ■ Net CAPEX increased by 5 mill. EUR
                                                         5                                       to 149 mill. EUR
        106               106
                  -1
                                                                                               ■ Continuous investments in
                                    +39
                                                                                                 customer-specific equipment and
                                                                                                 capacity extensions
                                                                                               ■ No reimbursements included (in Q1
  Q1 FY 15/16          Q1 FY 16/17       Q1 FY 17/18         Q1 FY 18/19                         FY 17/18 11 mill. EUR)
2) In accordance with IFRS 15 reimbursement not deducted from CAPEX in Q1 FY 18/19.
 Note: Adjustments of FCF include restructuring expenses, factoring (Q1 FY 16/17 only)

   12                                                                   HELLA Company Presentation | Q1 FY 2018/19
Automotive segment with increasing growth and profitability
Financial results Q1 FY 2018/19
                                                 +11.2%
                              +5.9%                                                              Automotive Sales
            +1.5%                                         1,383
                                         1,244                    ■ Growth of 11.2% with ongoing production ramp-ups and
   1,158              1,175
                                                 10.8%
                                                                    higher demand for:
            537
              3.0%                 646
                                6.3%                      606
      500              515               547                               energy management and driver assistance
                                                                            products
                                                 12.6%
             +1.6%              4.9%
                                                          765
                                                                           innovative / advanced lighting products incl.
      638              648               680
                                                                            headlamps, rear-lamps and interior lighting with
      20               12                 17               11               international launches
Q1 FY 15/16     Q1 FY 16/17        Q1 FY 17/18      Q1 FY 18/19            Demand driven by Europe, NSA and China
   External Sales Electronics               Intersegment Sales
   External Sales Lighting
                                                                                          Automotive Profitability
            +25.8%
                                                 +16.1%            ■ Increase of adj. EBIT by 16.1% to 106 mill. EUR:
                                -6.7%
                       98
                                                          106         increased GPM with increase in production
                                          91
      78
                                                                        volume with several launches in Electronics
                                                                        and Lighting
                       8.3
                                          7.3              7.6        increase in R&D to prepare production ramp-
      6.8
                                                                        ups and expand the international R&D network
                                                                      higher SG&A with investments in logistics and
Q1 FY 15/16          Q1 16/17      Q1 FY 17/18      Q1 FY 18/19         corporate functions
   Adj. EBIT           Adj. EBIT Margin (% of total sales)
 13                                                               HELLA Company Presentation | Q1 FY 2018/19
Non Automotive segments with positive contributions
Financial results Q1 FY 2018/19
            +6.8%
                                                                                                        Aftermarket*
                                                 +9.3%
     163
                     174                                              ■ Total sales growth (+6.8%) due to strong
                                                          14.6
                                          13.4                          workshop business and positive IAM demand
                                                                      ■ Increase in adj. EBIT margin by 0.2pp to 8.4%
           537                             8.2             8.4          mainly due to higher GPM: Growth with leverage
                                                                        of fix costs especially in workshop business and
Q1 FY 17/18 Q1 FY 18/19              Q1 FY 17/18 Q1 FY 18/19            positive product mix effect in the Independent
                                                                        Aftermarket segment
                                         adj.*EBIT
                                         adj.* EBIT Margin
           +0.8%
                                                                                                Special Applications
                    100
                                                 -19.4%               ■ Modest top-line growth (+0.8%):
   100
                                          16.0                         increasing demand in Construction and
                                                          12.8
                                          16.1                           Agricultural sector
                                                          12.9         other product groups e.g. Trailer and Trucks
           537
                                                                         also growing
                                                                       End of production in Australia with negative
Q1 FY 17/18 Q1 FY 18/19              Q1 FY 17/18 Q1 FY 18/19
                                                                        effect on growth and margin
                                                                      ■ Profitability down by 19.4%
     Total Sales                              EBIT
                                              EBIT Margin              high comparable basis PY with pre-production in
 *The figures for the Aftermarket segment exclude the items from
 wholesale distribution.                                                 Australia and positive one-offs (total 4 mill. EUR)
   14                                                              HELLA Company Presentation | Q1 FY 2018/19
Overall market FY 18/19 expected to grow by 1.5% according to IHS
Outlook

                                Expected LVP
Region                                          Comment
                                 (in m units)
                                      -0.1%
                                                ■ Slightly decrease in 2018/19 expected. Europe
                                                  excluding Germany expected to grow by 1.5% to
Europe                                22.4
                                                  17.0m units, Germany with an expected decline of
                                    FY 18/19      4.7% to 5.5m units
                                      +3.2%

                                                ■ After negative previous year (-2.4%), strong
NSA                                   21.0
                                                  growth in 2018/19 expected
                                    FY 18/19

                                      +1.7%
                                                ■ China expected to grow 1.7% in 2018/19 to 28.6m
China                                 28.6        units, Asia/RoW expected to grow by 2.0% to
                                                  52.3m units
                                    FY 18/19

                                     +1.5%
 Global                               97.4
                                                ■ Overall market expected to grow by 1.5%
                                     FY 18/19

Source: IHS (as of July 2018)

  15                                             HELLA Company Presentation | Q1 FY 2018/19
Company specific development for FY 2018/19 continuously
positive
Guidance
Presuming no serious political, economic or social crises, we expect a positive
business development for the HELLA Group in fiscal year 2018/19:

                                 ■ Growth excluding FX and portfolio effects
       Sales growth
                                   between 5-10%

                                 ■ Growth excluding restructuring and portfolio
      Adj. EBIT growth
                                   effects between 5-10%

                                 ■ Margin excluding restructuring and portfolio
      Adj. EBIT margin             effects approximately equivalent to prior year’s
                                   level

 16                                HELLA Company Presentation | Q1 FY 2018/19
HELLA Company Presentation Q1 FY 2018/19
Outline

■ HELLA Financial Results Q1 FY 2018/19

■ HELLA at a Glance

■ HELLA’s view on Automotive Market Trends

 17                              HELLA Company Presentation | Q1 FY 2018/19
As one of the top 40 automotive suppliers worldwide HELLA
specializes in innovative lighting systems and vehicle electronics
HELLA at a Glance – Overview
KEY FACTS                                                                            KEY FINANCIALS

▪ Founded 1899 in Lippstadt (Germany)                                                in EUR millions and % of sales
▪ Global footprint with over 40,000 employees at more than 125                                                    FY 2016/17          FY 2017/18     Change
  locations in some 35 countries
          ▪ Thereof 41 research & 28 production sites                                 Sales                             6,585           7,060         +7.2%

▪ Integrated business portfolio in Automotive, Aftermarket,                           Adjusted EBIT                      534              581         +8.8%
  and Special Applications                                                            Adjusted EBIT                                                   +0.1%
                                                                                                                        8.1%             8.2%
                                                                                      margin                                                          points
▪ Leading market positions in automotive Lighting and
  Electronics                                                                         Adjusted
                                                                                                                         149              241       +61.7%
                                                                                      Free Cash Flow
▪ One of the top 40 automotive suppliers in the world and
  one of the 100 largest German industrial companies

SALES BY BUSINESS SEGMENT                                                            SALES BY REGION

external sales, fiscal year 2017/18                                                  based on the HQs of HELLA’s customers, fiscal year 2017/18
                         Special Applications                                                     North & South America
                             €418 million                                                              €1,221 million                        Germany
                                                                                                                                           €2,134 million
                                   6%
         Aftermarket                                                                                                     17%
        €1,225 million      17%
                                   €7.1                                                                                      €7.1       30%
                                            43%                                            Asia, Pacific, RoW
                                  billion          Automotive                                                               billion
                                                                                             €1,208 million       17%
                                  group              Lighting                                                               group
                                  sales           €3,014 million                                                            sales
            Automotive       34%
                                                                                                      Rest of Europe            36%
             Electronics
           €2,368 million                                                                              €2,497 million

   18                                                              HELLA Company Presentation | Q1 FY 2018/19
HELLA has shown sustainable profitable growth
since automotive crisis
HELLA at a Glance – Sales and EBIT development
SALES                                                                     ADJUSTED EBIT

in EUR millions and % of sales                                            in EUR millions and % of sales

                                 8%
                                                      7,060                                                                          581
                                              6,585                                                            14%
                                      6,352                                                                                    534
                       5,835                                                                                         476
             5,343                                                                                      445
  4,835                                                                                     399                                      8.2
                                                                                                                               8.1
                                                                                            7.5          7.6         7.5
                                                                              306

                                                                               6.3

FY 12/13 FY 13/14 FY 14/15 FY 15/16 FY 16/17 FY 17/18                      FY 12/13 FY 13/14 FY 14/15 FY 15/16 FY 16/17 FY 17/18

                                                                                                     Adj.* EBIT      % sales

▪ Sustainable growth during the last years mainly driven                ▪ Continuous EBIT increase despite large
  by Automotive                                                           investments in global structures and R&D
▪ Aftermarket and Special Applications also with                        ▪ Overall stable margin level through growth driven
  positive growth                                                         by technology leadership and increased efficiency

   19                                                   HELLA Company Presentation | Q1 FY 2018/19
To further secure profitable growth path HELLA continuously
expands its global footprint
HELLA at a Glance – Footprint

GLOBAL                                     USA                          Germany                       Lithunia                   China
  AUTONOMOUS
FOOTPRINT
    DRIVING                                Northville                   Lippstadt                     Kaunas                     Wuqing

                           New administration &         New visitor,                      New                     New Lighting plant
                           technical center for         administration and                Electronics plant       with Joint Venture-
                           Electronics                  exhibition center                 SOP mid-2018            Partner BHAP
                           Opening in early 2019        Opening mid-2019                                          SOP in 10/2017

                                                                                    Germany
                                                                                                                              China
                                                                                    Lippstadt
                                                                                                                              Shanghai
                                          Mexico
                                          Guanajuato           Digital Innovation Campus,
                                                               in collaboration with Hamm-                     Extension of Electronics
                           New Electronics plant               Lippstadt University and other                  plant, SOP mid-2018
                           SOP in early 2018                   partners; opening in 2020
        Recent openings
        since mid 2017                                                                                                     India
                                           Mexico                                         India
                                                                                                                           Coimbatore
                                           Irapuato &                                     Mehsana
        Outlook
                                           Guadalajara                                                    Additional R&D center for
                           Extension of two Lighting plants          New Electronics plant                lighting technology
                           SOP in 11/2017                            SOP in early 2019                    Opening in 07/2017

SOP: Start of production

   20                                                   HELLA Company Presentation | Q1 FY 2018/19
To secure profitable growth path HELLA has further developed its
well-established partner network
HELLA at a Glance – Partnership Network
                                 Parternship        Kind of
               TREND             examples           partnership      FOCUS
  AUTONOMOUS
    DRIVING                                             Open          Development and marketing of modern assistance systems
                                                     Cooperation      and autonomous driving functions

                                                        Open          Radar-based system technologies by combining radar
                                                     Cooperation      sensors from HELLA and radar system chips from NXP
                AUTONOMOUS
                  DRIVING
PARTNERSHIP                                             Joint         Development of radar systems; InnoSenT exclusively sells all
                                                       Venture        products and services in its automotive portfolio to HELLA
NETWORK

                                                                      Development of innovative electric actuating solutions;
                                                        Open
                                                     Cooperation
                                                                      first joint project will be the production of an electric purge
                 EFFICIENCY &                                         pump significantly reducing CO2 emissions
               ELECTRIFICATION

                                                        Open          Development of a cloud-based air quality management
                                                     Cooperation      system

               CONNECTIVITY &
               DIGITALIZATION                            Seed         Innovative software solution for cloud-based
                                                      Investment      communication of vehicle data to workshops

                                                        Joint         Development of individualized HMI concepts,
                                                       Venture        e.g. innovative touch displays & gesture control devices

                 INDIVIDUA-
                  LIZATION                              Joint         Design, development, production and logistics of
                                                       Venture        individualized, integrated front-end modules

 21                                            HELLA Company Presentation | Q1 FY 2018/19
High financial stability ensures long-term growth perspective and
provides freedom for entrepreneurship
HELLA at a Glance – Financial Stability
Solid capital structure                                                                                                                       Strategic flexibility
Leverage (Net debt / EBITDA)                                   Debt and maturity profile*, in millions EUR                                    HELLA has a stable
                                                                                                                                              and solid financial
  0.7x                                                                                                                                        fundament which
            0.6x                                                   500
                                                                                                                                              forms the basis for
                                                                                                                          352                 its future strategic
                               0.3x      0.3x                                    300
                     0.2x                          0.2x                                                                                       plans
                                                                                                70           105
                                                                                                                                               Prudent financial
May 13 May 14 May 15 May 16 May 17 May 18
                                                                                                                                                   policy throughout
                                                                  2020          2024          2032          2033         Other
                                                                                                                         Debt**                    the cycle with
                                                                                                                                                   leverage < 1.0x
                                                                  Bond     Bond               Aflac***      Aflac
Gearing (Net debt / Equity)                                       (2.375%) (1.00%)            bond I        bond II                            Financing of long-
  0.3x      0.3x                                                                                                                                    term growth
                                                                                                                                                    strategy secured
                                                                 Additional Revolving Credit (2022) of                                         Well balanced debt
                     0.1x      0.1x      0.1x      0.1x          EUR 450m with 10 core banks as back-up                                             portfolio
                                                                 facility
                                                                                                                                               New issuing
May 13 May 14 May 15 May 16 May 17 May 18                                                                                                           (senior, unsecured
                                                                                                                                                    / bearer debt) for
  Capital-market-oriented capital structure with investment grade rating                                                                           attractive
  Good liquidity profile and consistent liquidity management                                                                                       conditions
  EUR 117m dividends (1.05EUR/share) paid October 2018                                                                                        Mid term target:
                                                                                                                                                    Leverage < 1.0x
  Equity ratio at 41.9% and cash & assets at 1,021 mill. EUR
* As of August, 2018; Euro Bond I: 2,375%, Euro Bond II: 1,00%; Aflac bonds hedged values ** Mostly long term debt; starting with Aug 2018 lease liabilities according to IFRS
16 *** Abbreviation for “American Family Life Insurance Company“

   22                                                                      HELLA Company Presentation | Q1 FY 2018/19
In the Automotive segment, HELLA develops and produces
innovative solutions for automobile manufacturers worldwide
HELLA at a Glance – Business Segment Automotive
BUSINESS OVERVIEW*                                                                                        KEY FINANCIALS

Lighting                          ► #1 market position in LED                                             in EUR millions and % of sales
▪   Headlamps                       headlamps Europe
▪   Rear Combination Lamps                                                                                                                     FY 2016/17          FY 2017/18        Change
▪   Small Lamps                   ► #3-4 global and #1-2 European
▪   Interior Lighting               market position in OE passenger
▪   Lighting Electronics                                                                                   External Sales                          4,980                5,383         +8.1%
                                    car lighting
                                                                                                           Adjusted EBIT**                           444                 457          +2.8%
Electronics                       ► #2-3 global and #1-2 European                                                                                                                     -0.3%
▪   Components                      market position in defined automotive                                  Adjusted EBIT margin**                   8.8%                8.5%
                                                                                                                                                                                      points
▪   Energy Management
▪   Driver Assistance Systems
                                    electronic segments
▪   Body Electronics                                                                                       Ext. Sales Lighting                     2,788                3,014         +8.1%
▪   Steering
                                                                                                           Ext. Sales Electronics                  2,191                2,368         +8.1%

AUTOMOTIVE SALES BY CUSTOMERS                                                                             AUTOMOTIVE SALES BY REGIONS

fiscal year 2016/17                                                                                       fiscal year 2017/18

                                      Other***                                                                            North & South America
                                                                                                                               €1,112 million                                Germany
                                                                                                                                                                           €1,827 million
                                         6%
                                                               German                                                                               21%
                                                                OEM                                                                                                     34%
                                29%      €5.4          43%                                                       Asia, Pacific, RoW                       €5.4
                Tier X                                                                                              €987 million
                                        billion                                                                                                          billion
                                                                                                                                               18%

                                  11%
                                           13%                                                                                                                27%
                    Asian OEM                                                                                                 Rest of Europe
                                                                                                                               €1,457 million
                                         US OEM
*) All figures related to the selected markets and product categories based on HELLA‘s portfolio, as covered in an external market study commissioned by HELLA (2014)
**) Adjustments including restructuring expenses
***) Including European OEM (ex Germany) and trucks.

     23                                                                              HELLA Company Presentation | Q1 FY 2018/19
HELLA will benefit in its core business thanks to favorable
   positioning along major automotive market trends
   HELLA at a Glance – Automotive Technology Highlights
                   AUTONOMOUS                 EFFICIENCY &                          CONNECTIVITY &           INDIVIDUALI-
                     DRIVING                ELECTRIFICATION                         DIGITALIZATION             ZATION
     MAJOR
AUTOMOTIVE
   MARKET
    TRENDS
                           M

                                                       M

                                                                                            M

                                                                                                                 M
                           I

                                                       I

                                                                                            I

                                                                                                                 I
    Selected
   Examples

  Electronic
   portfolio
                Camera        77 GHz         48V       Purge      Battery                Particulate            Passive
                Software    Radar Sensor    DC/DC-     Pump       Mgmt.                 Matter Sensor         Entry System
                                           Converter              System

    Lighting
    portfolio

                     Driving Status                                                       High Definition   Ambient & Relaxing
                                               LED Technology                               headlamp         Interior lighting
                      Projections

     24                                                HELLA Company Presentation | Q1 FY 2018/19
HELLA with a comprehensive offering of automotive parts,
diagnostics, and services within Europe
HELLA at a Glance – Business Segment Aftermarket
BUSINESS OVERVIEW                                                        KEY FINANCIALS
         Independent Aftermarket (IAM)                                   in EUR millions and % of sales
         ▪ Sale of own and third-party spare parts to
           IAM wholesalers                                                                              FY 2016/17     FY 2017/18*        Change

         ▪ Own sales presence in >25 countries                            Sales                            1,222             647             n.m.
         ▪ Strong position of sales network and brand
                                                                          Adj. EBIT                         73.0            52.6             n.m.
           presence in European market (#1-3)
                                                                          Adj. EBIT margin                 6.0%             8.1%             n.m.

                                                                          Sales IAM                          553             568           +2.7%

                                                                          Sales Garage Equipment              66               67          +2.6%

         Workshop Equipment                                              STRATEGIC FOCUS
         ▪ Premium provider of workshop solutions,                       ▪ Further strengthen IAM product portfolio
           diagnostic tools and advanced equipment to                      e.g. enhance offering of Electronics/ Electrics and universal
           garages                                                         lighting products, expand partner network, push roll-out of 3rd
         ▪ Offering of professional services, e.g.                         party products to additional markets
           technical data/hotline, trainings & financial
           services                                                      ▪ Further enhance workshop products and services
         ▪ market position: #1                  #3                         e.g. set-up new digital offers and software driven business
                                                                           models (remote fleet manager, workshop broker platform),
                                                                           develop calibration solutions for complex cars

                                                                         *excludes Wholesale business (9 months). Closing September 3, 2018 for FTZ and
                                                                         INTERTEAM

 25                                                    HELLA Company Presentation | Q1 FY 2018/19
New high end diagnostic device mega macs 77 enables fast
trouble code reading and interpretation as well as other features
HELLA at a Glance – Aftermarket Technology Highlight

New dignostic device
for workshops:                         VALUE PROPOSITION: HIGH-END TECHNOLOGY COMBINED WITH
mega macs 77                           USER GUIDANCE
                                       ▪ Successor product of the diagnostic unit which is market leading in
                                         the DACH region
                                       ▪ Higher usability through Full HD 15.6‘’ touchscreen and refined user
                                         interface
                                       ▪ Real-time-repair concept making daily workshop business faster and
                                         therefore more profitable
                                       ▪ Further step towards fully guided repair: step by step instructions
                                         and guided measurement with automated verification of results
                                       ▪ Reduction of errors through automatic VIN-identification with
                                         automated link to parts catalogue

OUTLOOK
▪ International roll-out started in March 2018
▪ mega macs 77 hardware and software architecture as platform for further products
▪ Next-generation software at Automechanika 2018, taking guided repair another step forward

  26                                             HELLA Company Presentation | Q1 FY 2018/19
In Special Applications HELLA incorporates the extensive
technological expertise in lighting and electronics
HELLA at a Glance – Business Segment Special Applications
BUSINESS OVERVIEW                                                          KEY FINANCIALS
▪ Development, production and sale of lighting and electronics             in EUR millions and % of sales
  products for special vehicle manufacturers
                                                                                                      FY 2016/17    FY 2017/18      Change
▪ “Fast follower” of technological innovations in automotive
  segment along megatrends LED, energy efficiency and safety                Sales                           385         430       +11.6%
▪ Application of know-how through own research and                          EBIT                         19.7          48.0      +143.7%
  development resources and dedicated production footprint
                                                                                                                                    +6.1%
▪ Strong market position in lighting product areas based on                 EBIT margin                  5.1%         11.2%
                                                                                                                                    points
  long-standing experience, in particular in Europe
▪ Focusing on a variety of attractive target groups

TARGET GROUPS                                                              STRATEGIC FOCUS
                                                                           ▪ Drive further LEDfication
                                                                             e.g. build-up competences in intelligent lighting solutions,
                                                                             push Visiotech technology, broaden innovative roadmap
     Off-highway                                                             (LED matrix beam, Shapeline), increase number of vehicle
                                                                             specific lighting projects

                                                                           ▪ Boost growth of Electrics / Electronics business
      Highway &                                                              e.g. extend electronics scope (focus on sensors and
   Leisure Vehicles                                                          actuators), foster cooperation and M&A opportunities

                                                                           ▪ Penetrate growing customer segments
     Premium &                                                               e.g. drive growth in segments mining, power sports, and
   Special Vehicles                                                          marine, push solutions for e-cars and small cars, explore
                                                                             further growth potential of truck business

   27                                                    HELLA Company Presentation | Q1 FY 2018/19
Innovative HELLA technologies for special vehicles increase
workplace safety, the operator’s comfort and individualization
HELLA at a Glance – Special Applications Technology Highlight

Innovative
projection system               VISION
for special purpose vehicles:   ▪ Increasing workplace safety and the operator’s comfort
„VISIOTECH“                     ▪ Visually warn or alert other vehicles or passersby
                                ▪ Lead customer (Projection Module):
                                  LINDE (triangle symbol with a forklift)

  Module 50 Spot                              SL60 LED                                    Projection Module

➢ Creates a bright warning          ➢ Creates a line on the                            ➢ Projects exclamation
  spot on the ground                  ground                                             mark as warning symbol
                                    ➢ Customization option:                            ➢ Perfect view even under
                                      Add a customer logo on                             daylight conditions
                                      the backside of the lamp                         ➢ Other symbols / working area
                                                                                         warning projections possible

  28                                      HELLA Company Presentation | Q1 FY 2018/19
HELLA Company Presentation Q1 FY 2018/19
Outline

■ HELLA Financial Results Q1 FY 2018/19

■ HELLA at a Glance

■ HELLA’s view on Automotive Market Trends

 29                              HELLA Company Presentation | Q1 FY 2018/19
To benefit from latest market developments, HELLA has
incorporated their major implications into its strategic action plan
HELLA’s view on Automotive Market Trends
      AUTONOMOUS                EFFICIENCY &                           CONNECTIVITY &
                                                                                               INDIVIDUALIZATION
      DRIVING (AD)              ELECTRIFICATION                        DIGITALIZATION

▪ Safety regulations      ▪ Accelerated penetra-            ▪ Increasing importance       ▪ Stronger focus of
  (NCAP) are pushing        tion of electrified ve-           of software: Increase in      OEMs and consumers
  AD level 1-3              hicles due to incentives          functionalities with car      on vehicle design
                            and regulatory push               value shift from              features
▪ Increasing number of
                                                              hardware to software
  partnerships for AD     ▪ Especially increasing                                         ▪ Increasing demand
  level 4-5                 demand for mild-                ▪ 75% of vehicles               for passenger related
                            hybrid solutions                  estimated to have             applications and
▪ Higher willingness of
                                                              internet connection           functionalities
  consumers to pay for    ▪ Strong growth in China
                                                              by 2020
  AD features

   Major implication          Major implication                   Major implication           Major implication
 ➢ Increasing              ➢ Substantial growth               ➢ New business               ➢ Additional growth
   relevance of system       opportunities for                  opportunities                opportunities for
   competence and            HELLA (worldwide,                  e.g. cloud-based             HELLA especially in
   partnerships              but especially in                  solutions, domain            the field of interior
                             China)                             computer, digital            and car body
                                                                aftermarket solutions        lighting

 30                                          HELLA Company Presentation | Q1 FY 2018/19
For continuous organic growth, HELLA offers sensors and
software for the road to autonomous driving
HELLA’s view on Autonomous Driving

   CAGR           Number of manufactured vehicles                                Autonomous
                  (in mill. units) and penetration of level*   MARKET                                                 Technologies per car**
 2017-2022                                                                       Driving Level

                            76 (82%)
    -6%                                      53 (50%)
                                                                                     Level 1                       2-5
                                                     18 (19%)
   +24%
                                                49 (47%)
                                                                                     Level 2                                7-10

  +187%
                                                                  4 (4%)             Level 3                                                      15-21

      -
                                                                        0.3          Level 4                                                        17-22
                     2017
      -              2022                                                                                                                               17-24
                                                                      0.009          Level 5

MARKET Development                                                                          HELLA Position
  ▪ Strong ADAS penetration increase especially coming from L2-                             ▪ Enable the transition to increased automation as key
    3 with a CAGR of 26% (2017-2022), radar, camera and Lidar as                              supplier of ADAS, as strong component and (sub-) system
    strongest drivers                                                                         supplier
  ▪ ADAS sensors demand increasing globally, existing driver                                ▪ Thorough allocation of development resources to
    assistance functions are key enablers for automated driving                               continuously increase radar share and penetrate camera
  ▪ AD L4 and L5 functionalities important beyond 2022,                                       software market
    penetration increase of L5 starting 2025                                                ▪ Develop new functionalities and use cases from assisted to
                                                                                              automated driving

* Based on global LVP, source: IHS, Strategy Analytics, HELLA analysis
** Includes radar sensors (24 GHz and 77 GHz), front camera software functionalities (traffic sign, lane, light, object detection), LIDAR, and SHAKE. Potential # of sensors
includes redundancies
   31                                                                       HELLA Company Presentation | Q1 FY 2018/19
To seize business potentials from Autonomous Driving, HELLA
pursues a strategic approach based on three essential pillars
HELLA’s view on Autonomous Driving – Strategic approach

                              HELLA strategy: Autonomous Driving

         HELLA as strong                    HELLA as                                 HELLA as service and
       components supplier           Tier 1 system provider                            feature provider
                                       & network partner

      ▪ Scalable and cost-          ▪ HELLA as Tier 1 partner                        ▪ Services and software
        optimized solutions for       for functions and                                solutions in the area of
        assisted and automated        subsystems (e.g.                                 automated driving
        driving                       parking)
                                    ▪ HELLA as integrated
                                      network partner for
                                      OEMs and Tiers for
                                      overall system solutions

 32                                     HELLA Company Presentation | Q1 FY 2018/19
HELLA offers scalable and cost-optimized solutions for assisted
and automated driving e.g. sensing technologies
HELLA’s view on Autonomous Driving – Components supplier

        24GHz / 77GHz Radar
    AUTONOMOUS                                                                     SHAKE*                                                   LIDAR
      DRIVING

                                                                           (1)                   (2)

                                                                    (5)                                (3)

                                                                                      (4)

 Scalable radar family for complete                            Modular system architecture as                               Scalable LIDAR technologies
information on vehicle surrounding                              key technology for intelligent                             developed with strong USPs in
                                                                 touch & vibration sensing                                 regard to costs and integration
▪        Strong focus on Driver                            ▪      Shake sensor for automated                           ▪     LIDAR as additional technology
         Assistance and NCAP relevant                             driving functions (≥ L2)                                   for Autonomous Driving
         functions as driver for                           ▪      Sensor system allows several                         ▪     Tailor made HELLA solution
         surround view                                            low & high speed functions such                            based on existing serial
▪        Consequent modular platform                              as damage detection and road                               competence
         approach to create flexible                              condition sensing
         customer-oriented solutions

*Structural Health And Knock Emission; (1) Intelligent damage detection, (2) Adaptive impact detection, (3) Smart touch detection, (4) Predictive maintenance, (5) Road
condition sensing

    33                                                                    HELLA Company Presentation | Q1 FY 2018/19
HELLA’s 77 GHz radar sensor solution enables efficient
360° environment recognition for the entire vehicle
HELLA’s view on Autonomous Driving – Technology Highlight

       TECHNOLOGY
       77 GHz Radar Sensor                                                MAIN FUNCTIONALITIES
                                                                                                 Intersection
                                                                                                 Assistant
                   KEY FACTS
                   ▪ Highly integrated RF-CMOS
                     Radar System Chip
                   ▪ Higher functional object detection
                     performance

                                                                                                 Automated
                                                                                                 Parking

 KEY BENEFITS
 ▪ Reduced size & weight (significant package
   reduction compared to previous sensors)
 ▪ Identifies & reacts to approaching vehicles
                                                                                                 Automated
   from front-side when entering a junction or
                                                                                                 Driving
   pulling out forward from parking space
 ▪ Identifies & warns of objects in blind spot

 34                                                 HELLA Company Presentation | Q1 FY 2018/19
HELLA’s multi lens array improves comfort and safety by
supportive road projects for different driving situations
HELLA’s view on Autonomous Driving – Technology Highlight

       TECHNOLOGY
       Multi Lens Array                                                    MAIN FUNCTIONALITIES
                                                                                  First to        Welcome
                  KEY FACTS                                                       market          Light
                  ▪ Generation of sharp, contrasting
                    and homogeneous images
                  ▪ No loss of the graphic even by
                    partially dirty lens, 170 micro
                    projection lenses per Multi-Lens-
                    Array generating 1 image
                  ▪ Integration of projections with car                           Future
                    sensors                                                                       Driving Status
                                                                                  option
                                                                                                  Projections

 KEY BENEFITS
 ▪ Enhances safety through communication with
   pedestrians and other vehicles
 ▪ Evokes emotions by dynamic / changing                                         Future           Safety
   lighting                                                                      option           Projections
 ▪ Enables information about autonomous driving
   status

 35                                                  HELLA Company Presentation | Q1 FY 2018/19
HELLA addresses the gradual shift from combustion engine to
battery electric vehicles
HELLA’s view on Efficiency & Electrification

                Number of manufactured vehicles
   CAGR                                                                             Efficiency &
                (in mill. units) and penetration of           MARKET                                                   Technologies per car**
 2017-2022      powertrain concept*                                                Electrification

                           91 (96%)
                           91 (96%)                                               Internal Combustion
    -2%
                               83 (78%)
                               83  (78%)                                              Engine (ICE)           2

                                                                     1 (1%)         48V Mild Hybrid
   +71%
                                                               11 (10%)                 (MHV)                    4

                                                                    3 (3%)3
   +26%                                                                              Full- (FHEV) &
                                                                    (4%)
                                                                  8 (8%)         Plug-in Hybrid (PHEV)                                        8-15
                        2017                                          1 (1%)
                                                                           1
   +36%                                                                             Battery Electric
                        2022                                            4.3
                                                                    4 (4%)                                                                               7-23
                                                                                    Vehicle (BEV)

MARKET Development                                                                           HELLA Position
  ▪ Gradual Shift within powertrain concepts with strong                                      ▪ Focus on solutions for the energy managing of all
    momentum for penetration of electrified vehicles                                            powertrain concepts, carry and strengthen top market position
  ▪ Internal combustion engines will continue to be relevant                                    for ICE by next generation products (check)
    beyond 2030, but are expected to decline                                                  ▪ Leverage Hybrid and Electric Vehicle competence with
  ▪ Mild hybrid as intermediary solution to achieve CO2 emis-                                   further investments in development of DC/DC converters to
    sions and E-quote with strongest growth and biggest beneficiary                             benefit from increasing trend for mild-hybrids

  ▪ Further efficiency gains drive growth of new technologies                                 ▪ Resources allocation to BMS and High voltage products
    such as HV converters
* Based on global LVP, source: Strategy Analytics, HELLA analysis
** E.g. IBS, DC/DC converter (12V and 48V), BMS (incl. e.g. current sensor, cell monitoring device, battery control unit, isolation monitoring device)

   36                                                                         HELLA Company Presentation | Q1 FY 2018/19
Consequent roll-out of 48V DC/DC converter in order to participate
in growing 48V market, especially in China
HELLA’s view on Efficiency & Electrification – Technology Highlight

       TECHNOLOGY
       48V DC/DC-Converter                                                 MAIN FUNCTIONALITIES

                    KEY FACTS
                    ▪ Conversion efficiency
                      > 95%
                    ▪ Power rating according to
                      alternator up to 3kW
                                                                           Enhanced Start-Stop    Engine-Off-Coasting
                    ▪ Scalability thanks to multi-phase
                      approach
                                                       Awarded by
                                                      3 Customers
 KEY BENEFITS
 ▪ Enables new applications such as stop/start
   and idle cruising, whilst ensuring the supply of
   fuel-efficient power loads such as electrical
                                                                           Boosting               High Power Braking
   power-steering actuators
 ▪ Innovative vehicle applications, which support
   fuel efficient drive concepts such as high power
   regenerative braking or engine-off coasting
   applications

                                                                           Backup Energy          Fuel Economy

 37                                                  HELLA Company Presentation | Q1 FY 2018/19
HELLA offers the electronics solution for lithium-ion battery
management system
HELLA’s view on Efficiency & Electrification – Technology Highlight

        TECHNOLOGY
        BATTERY MANAGEMENT SYSTEM                                                           MAIN FUNCTIONALITIES
                                                                                            CALCULATE                 PROTECT
  KEY FACTS                                                                                 BATTERY               BATTERY AND
                                                                                            STATE                      VEHICLE
                                             BMS ECU: Battery state
                                             calculation and control of safety
                                                                                                                        DRIVER
                                             functions                                                                         against
                                             Cell Controller: Voltage and                   ▪ State of Charge     ▪ Battery overheating
                                             temperature measurements as                    ▪ State of Health      ▪ Over voltage and
                                             well as cell balancing                                                            current
                                                                                            ▪ Power capability
                                             High Voltage Current Sensor:                   ▪ Resistance           ▪ Contactor State of
                                             Measurement of battery current                                              Health (SoH)
                                             Insulation Monitoring Device:
                                             Measurement of insulation
                                             resistance between HV and LV
                                             (Integrated) Relay Box:
                                             Charge, pre-charge and main
                                             relays packaged including
                                             control electronics

  KEY BENEFITS
  ▪ Modular and scalable platform for 12V, 48V and high voltage                             ▪ Current                     ▪ Contactor
    lithium-ion batteries                                                                   ▪ Cell voltages         ▪ Communication
                                                                                            ▪ Cell temperatures          ▪ Limp home
  ▪ Best-in-class insulation monitoring device in exclusive                                 ▪ Battery voltages           ▪ Pre-charge
    cooperation with BENDER
                                                                                            MEASURE                     CONTROL

 38                                            HELLA Company Presentation | Q1 FY 2018/19
HELLA pushes the digitalization of LED headlamp technologies in
both mass and premium segments
HELLA’s view on Connectivity & Digitalization

                 Number of manufactured vehicles
  CAGR           (in mill. units) and penetration of                        Connectivity &
                 headlamp technology*
                                                         MARKET                                                 Content differences**
2017-2022                                                                    Digitalization

                   80 (84%)                                                     Halogen
   -5%                        62 (58%)                                                                 0.3x-0.5x
                                                             6 (7%)
  -16%                                                                           Xenon                       1.1x-1.6x
                                                               3 (3%)

                                                             7 (7%)
  +38%
                                            34 (32%)
                                                                                LED low                  1 (baseline)

  +21%                                                         3 (3%)
                                                                              LED high***                                       3x-5x
                                                             7 (6%)
                      2017
     -                2022                                            0
                                                                            LED Innovation                                                      6x-8x
                                                                 1 (1%)

MARKET Development                                                                     HELLA Position
 ▪ Strong LED penetration growth globally (CAGR 35%), Xenon                             ▪ Capture growth from increasing LED penetration by offering
   to be replaced, Halogen stays as low cost solution                                     broad technology portfolio to global customer base, focus on
 ▪ Europe with highest LED penetration, growth esp. from                                  operational efficiency and process to penetrate mass markets
   standard and high LED, demand for high innovative solutions                          ▪ Leading edge solutions for high-end demand especially in
   starting 2020                                                                          Europe
 ▪ NAFTA demand for standard LED increasing strongly
   despite regulation, LED high also with double digit CAGR                             ▪ Localization strategy and ramp-up of resources to serve high
                                                                                          LED demand in China and NSA
 ▪ China with lowest LED penetration but strongest LVP growth
   and strongest increase of standard LED solutions
* Based on global LVP and technical share of headlamp technologies (Source: IHS LVP forecast, HELLA estimates), **per vehicle, content differences based on global
average market prices and future potential prices, ***LED high includes LED Advanced package and LED Advanced next generation

  39                                                                    HELLA Company Presentation | Q1 FY 2018/19
Software-controlled high definition headlamp accelerates
functionalities and customer benefits
HELLA’s view on Connectivity & Digitalization – Technology Highlight

       TECHNOLOGY
       High definition headlamp                                             NEW FUNCTIONALITIES
                                                                                                   Pedestrian
                    KEY FACTS                                                                      marking
                    ▪ High definition lighting system with
                      over 50.000 Pixel

                                                                                                   Projection of
                                                                                                   cross-walk
 KEY BENEFITS
 ▪ State of the art functions, e.g. bend light,
   glare-free high beam, etc. with optimized end-
   user impact
 ▪ New functionalities, e.g. C2P (Car To
   Pedestrian) and C2D (Car To Driver)                                                             Highlight the
 ▪ High end resolution                                                                             walk way

 40                                                   HELLA Company Presentation | Q1 FY 2018/19
Innovative approach to optimize air quality in the vehicle based on
particulate matter sensor and cloud-based solutions
HELLA’s view on Connectivity & Digitalization – Technology Highlight

        TECHNOLOGY
        Cloud-Based Air Quality Management                                    MAIN FUNCTIONALITIES
                                                                                                     Pollution
                                                                                                     Notifications
                      KEY FACTS
                      ▪ Particulate Matter Sensor (PM2.5)
                      ▪ For vehicles with automatic climate
                        control
                      ▪ Measurement of air properties, in the
                        range of 25 µg / m³ - 500 µg / m³
                      ▪ Particle size distribution detection                                         Cloud-Based
                        by scattered light detection //                                              Clean Routing
                        amplitude of diffractive light       First to                                Option
                        depends on PM concentration          market
 KEY BENEFITS
 ▪ Detection of particulate matter < 2.5 µm
   (fine dust) in the inner cabin & ambient air
 ▪ Greater driving comfort due to continual
                                                                                                     Cloud-Based
   optimization of the air quality in the vehicle
                                                                                                     Health
 ▪ High particle concentration leads e.g. to: sensor                                                 Recommendations
   function for ventilation flap controlling (lowers in-
   cabin pollution level) or fine dust pollution level
   display as warning feature

 41                                                     HELLA Company Presentation | Q1 FY 2018/19
HELLA offers interior and car body lighting solutions with
individualized and connected features
HELLA’s view on Individualization

  CAGR         Number of manufactured vehicles with
               lighting packages (in mill. units)*
                                                           MARKET             Individualization                    Content differences**
2017-2022

                                59
   -4%                                                                            Standard1
                                         45                                                              1 (baseline)

                                                      25
   +8%                                                                            Advanced2
                                              40                                                              3x-5x

                                                                11
  +11%
                                                           20
                                                                                  High-end3                             5x-9x (-10x)5

                      2017                                              0
  +47%                                                                 1         Innovation4                                                       15x-20x (-30x)6
                      2022

MARKET Development                                                                        HELLA Position
 ▪ Increased demand for personalization of vehicle design and                              ▪ Offer smart lighting solutions to cover increasing
   features drives need for lighting packages in- and outside the car                        individualization demand, focus on ambient interior and effect
   far beyond standard offering                                                              exterior (surround) light
 ▪ Advanced ranks 1st in terms of market size in 2022,                                     ▪ Introduce multi color LED modules that interact with driver
   substituting standard packages especially in Europe
                                                                                           ▪ Enable MLA technology for new lighting features around the
 ▪ Innovation with strongest growth over all regions,                                        car linked to sensor data
   penetration starts together with AD L4 and L5

* Taking into account technology penetration and estimated LVP; source: IHS LVP forecast, HELLA estimates)
** Content differences based on global average market prices and future potential prices
1) Includes courtesy lamp; 2) includes dome and static ambient lighting; 3) includes dome and dynamic ambient lighting; 4) includes dome and dynamic ambient lighting
and grill illuminations; 5) plus car body lighting (MLA – Multi Lens Array); 6) plus car body lighting (MLA and grill)

  42                                                                       HELLA Company Presentation | Q1 FY 2018/19
HELLA’s dynamic ambient lighting systems enhance user
experience, safety and support automated driving scenarios
HELLA’s view on Individualization – Technology Highlight

       TECHNOLOGY
       Dynamic Ambient Lighting System                                      MAIN FUNCTIONALITIES
                                                                                  Future           Advanced
                    KEY FACTS                                                     option           Welcome
                    ▪ Competence in light & electronics                                            Scenario
                    ▪ Light as a complementary
                      information source for driving tasks
                    ▪ Infinite number of high speed light
                      scenarios

                                                                                  Future           Collision
                                                                                  option
                                                                                                   Warning
 KEY BENEFITS
 ▪ Integration in customer E/E architecture
 ▪ Supports partially and high automated driving
 ▪ Enhances safety in complex traffic situations
   through warning function
 ▪ Improves driving comfort by                                                    Future           Ambient &
   personalization of light                                                       option           Relaxing

 43                                                   HELLA Company Presentation | Q1 FY 2018/19
Thanks for your attention

Dr. Kerstin Dodel, CFA
Head of Investor Relations

Office phone    +49 2941 38 - 1349
Facsimile       +49 2941 38 - 471349
Mobile phone    +49 174 3343454
E-Mail          kerstin.dodel@hella.com
Internet        www.hella.com
You can also read